Inflection Family Backtest: Only Revenue Beats the Market
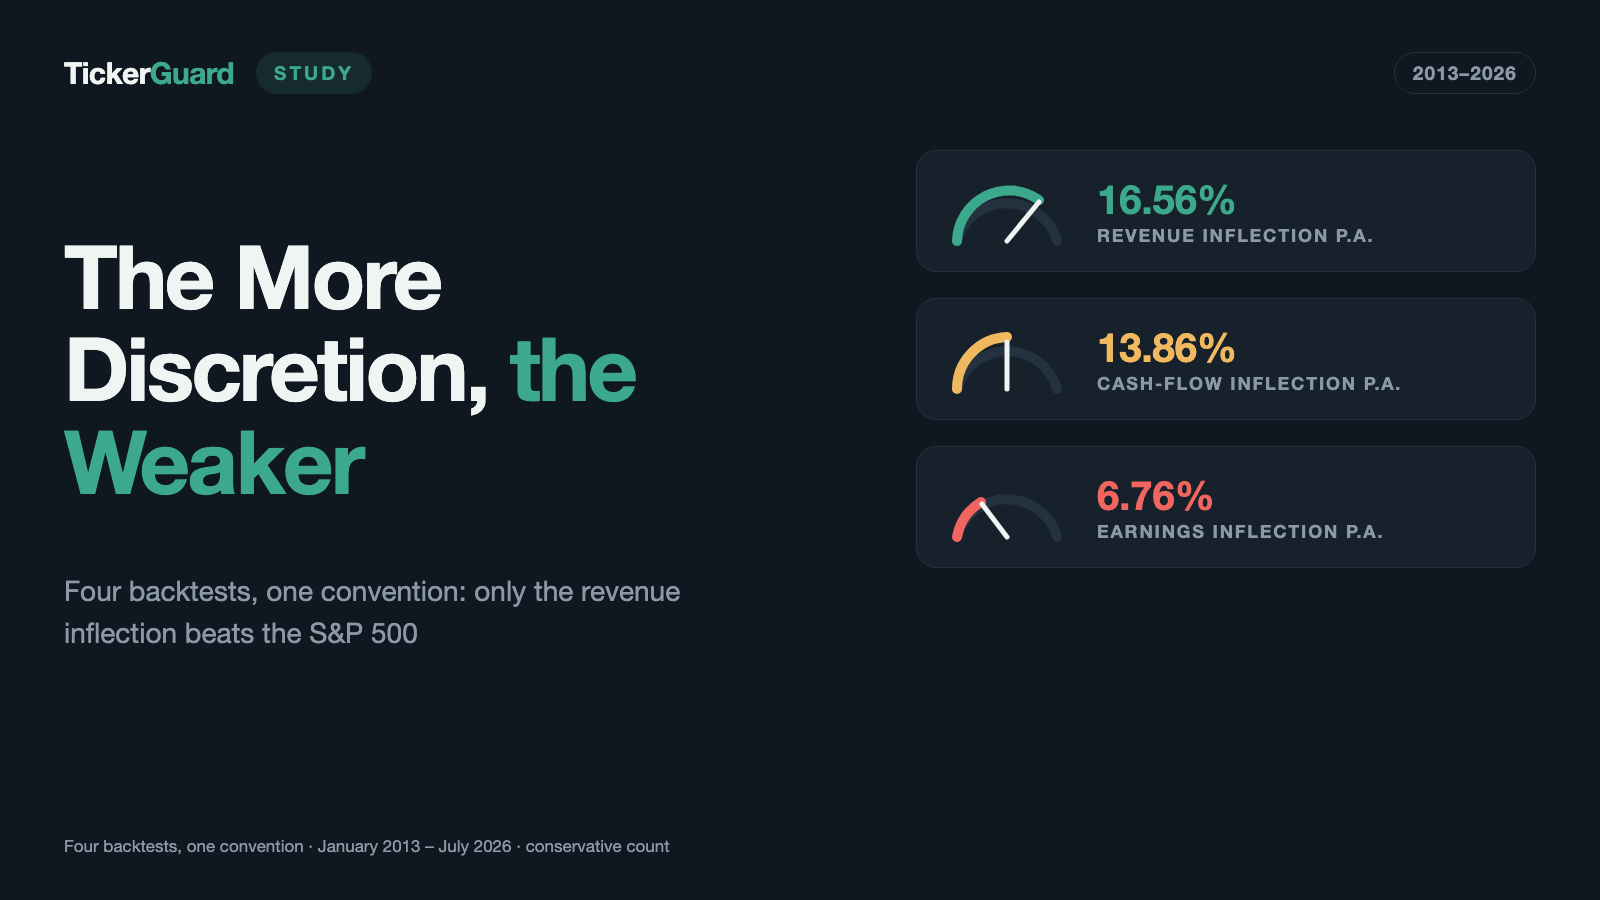
Four metrics, one pattern: the more shapeable a number in the filings, the weaker its buy signal — and only the revenue inflection beats the S&P 500 Total Return, at 16.56% against 15.02% a year. Cash-flow inflection (13.86%) and earnings inflection (6.76%) both fall short. The edge is narrow, though, and it rests on the organic-growth condition of the published headline figure: without it, the like-for-like arm sits just 0.03 points above the index.
 Thomas Mücke
Founder & Publisher
Thomas Mücke
Founder & Publisher
Five Questions, One Family
We have published five standalone backtests that all ask the same question — just at a different point in the financial statements: are companies at the start of a fresh inflection the better long-term buys than established, steady growers? First for revenue, then for earnings, then for operating cash flow — and with the FCF turnaround study, at a fourth point as well: the turnaround out of the red, instead of the inflection out of the black.
Each of these studies answers its own question on its own terms — honestly, with its own limits, sometimes with a clear yes, sometimes with a clear no. What was missing was the direct comparison: line the backtests up under the same convention, and which metric actually delivers the best signal? And does the thing that most sets these four metrics apart — how much each of them can be shaped by accounting choices — also produce a ranking in signal quality? This article answers exactly that. As a fifth backtest we add the cash probe, our backtest of the classic Sloan accrual anomaly — it follows a different convention and therefore sits in its own control chapter, but it belongs to the same question: is a metric with plenty of accounting discretion still worth something as a warning signal?
The result in four numbers
Which of the four inflection signals delivers the best buy signal — and does the ranking really follow each metric's accounting discretion? Four numbers carry the result:
- 16.56% per year is what the revenue inflection returned, conservative count — the only signal in the family to beat the index.
- 15.02% is what the S&P 500 Total Return returned over exactly the same window; the revenue inflection led by +1.54 points.
- 6.76% per year is what the earnings inflection returned, the family's weakest arm — the cash-flow inflection sat in between at 13.86%: the more discretion a metric allows, the weaker its signal.
- +0.03 points — that is all that was left without the organic-growth condition: the like-for-like arm of the revenue inflection returned 15.05%, only a razor-thin edge above the index. That is the finding's most important caveat.
Only the least shapeable metric in the family — revenue — beat the index in the tested window (2013 to 2026), and its edge rested on the organic-growth condition behind the published headline figure.
One Convention, Four Backtests — Plus One Control Chapter
Four of the five backtests — revenue inflection, earnings inflection, cash-flow inflection and FCF turnaround — share the same base convention, which is what makes them comparable at all: US stocks, January 2013 through July 2026 (163 months), bought equal-weighted at month-end, held twelve months, 0.1 percent cost per side. And, decisive for every figure in this article: the conservative count is the headline number throughout — it excludes positions with a monthly jump above 200 percent, because a portion of those are demonstrably broken price quotes, not real price moves. The full count stands alongside it, never in its place.
The shared benchmark: the S&P 500 Total Return returned 15.02 percent a year over this period, at a largest drawdown of −23.87 percent. The equal-weighted universe of all stocks in the dataset returned 4.77 percent a year (drawdown −53.23 percent), while the median stock in that universe returned just −5.45 percent — most individual stocks in the dataset lost money over the period, while the equal-weighted average is pulled into positive territory by a handful of strong outliers. Every figure in the rest of this article is either one of these three benchmarks or a return computed under exactly these rules. The cash probe in the final chapter is the sole exception — it follows its own convention, explained separately there, and is never mixed with these figures.
The Core Finding: The More Discretion, the Weaker
Lining up the four inflection signals in five arms under this one convention reveals a pattern none of the individual studies could show on its own:
| Backtest | Arm | Positions (conservative) | Return p.a. conservative | Return p.a. full |
|---|---|---|---|---|
| Revenue inflection (published headline) | fresh inflection, organic growth (K|org) | 274 | 16.56% | 26.28% |
| Revenue inflection (like-for-like, no organic condition) | fresh inflection, all growth types (K) | 502 | 15.05% | 19.76% |
| Cash-flow inflection | fresh inflection in operating cash flow (K) | 1,906 | 13.86% | 14.37% |
| FCF inflection (control arm of the FCF turnaround study) | sustained positive free cash flow that accelerates (beschl) | 1,143 | 10.95% | 11.14% |
| Earnings inflection | fresh earnings inflection, organic growth (K|org) | 258 | 6.76% | 6.76% |
| S&P 500 Total Return | — | — | 15.02% | 15.02% |
| Universe, equal-weighted | — | — | 4.77% | 4.77% |
| Universe, median stock | — | — | −5.45% | −5.45% |
The revenue inflection's published headline figure sits 1.54 percentage points ahead of the S&P 500 — a narrow but real edge. Even the like-for-like arm without the added organic-growth condition (15.05 percent) stays a razor-thin 0.03 points above the index. Every other inflection arm falls clearly short: the cash-flow inflection misses the market by 1.16 points, the FCF inflection by 4.07 points, the earnings inflection by 8.26 points.
And this ranking is not random scatter — it follows the accounting discretion each of the four metrics allows. Revenue is the least shapeable figure in a filing: it can barely be moved by depreciation, provisions or accounting choices. Operating cash flow is already more movable — payment terms, inventory cycles and tax dates shift it without the business changing at all. Free cash flow inherits that movability and adds management's capital-spending decision on top. Earnings sit at the end of the income statement, after depreciation, taxes and one-off items — the figure with the most room for discretion. Signal quality falls in exactly this order: revenue (16.56 percent) ahead of operating cash flow (13.86 percent) ahead of free cash flow (10.95 percent) ahead of earnings (6.76 percent) — a total spread of 9.80 percentage points between the top and bottom of this ranking.
What matters just as much is what this does not say: it is not a metric's position in the income and cash-flow statement that decides its signal quality. Earnings appear in the income statement before either cash-flow line — and still finish behind both, by a wide margin. What sorts the four metrics is the room they leave the accountant.
The truth sits at revenue, the noise at earnings — even though both come out of the same set of statements.
The Order of the Signals
An obvious objection: if earnings or cash-flow inflection arrive earlier than the revenue inflection, shouldn't they be the better early indicators — even if their own return is weaker? We measured this directly, checking at companies with multiple signals during the study period which one fired first.
| Comparison | Companies with both signals | Median lead | Who came first |
|---|---|---|---|
| Earnings inflection vs. revenue inflection | 1,050 (of 2,129 earnings cases, 49.32%) | 4 months — earnings first | Earnings 565 · revenue 414 · same month 71 |
| Cash-flow inflection vs. revenue inflection | 1,533 (50.66% of cash-flow, 71.07% of revenue cases) | 3 months — cash flow first | Cash flow 796 · revenue 664 · same month 73 |
| FCF turnaround vs. revenue inflection | 135 (of 896 turnaround and 513 revenue cases) | 6 months — turnaround later | Turnaround later 77 · revenue later 53 · same month 5 |
Both inflection signals really do lead the revenue inflection: the earnings inflection by a median of four months, the cash-flow inflection by three. And yet the lead does not pay off — quite the opposite: in the return ranking, it is exactly the later signal, the revenue inflection, that leads (16.56 percent), followed by the three-months-earlier cash-flow signal (13.86 percent) and last by the four-months-earlier earnings signal (6.76 percent). An earlier alarm is not a better one here. The FCF turnaround behaves differently from the two inflection signals — among the 135 companies with both signals, it tends to arrive later than the revenue inflection (in 77 of 135 cases), a median of six months after it, not before.
A narrower, more granular cut of the same FCF turnaround study only partly supports this reading: restricting the comparison to the 96 (conservative) or 99 (full) evaluable ones among those 135 companies — the rest dropped out on the minimum price, on missing measurability or because both signals fired at once — and comparing, company by company, whichever signal fired first against whichever fired second — both held for twelve months from their respective start — the median favors the earlier signal: +14.86 points on the conservative count (59 of 96 cases), +13.41 points on the full count (60 of 99 cases). The mean of this narrow comparison flips negative on the full count (−2.10 points, against +3.36 points conservative) — a sign of a few strong outliers in a small sample. This detail cut applies only to the narrow FCF-turnaround/revenue pair and does not overturn the broader family ranking: above all, it shows how sensitive timing comparisons are on small samples, and belongs here with that caveat attached — not as a second, contradicting core finding.
What remains: signal noise sits wherever a metric is malleable — at earnings and cash flow, where accounting discretion, tax dates and working-capital effects can move the number in the short run without much changing about the business. The truth sits at revenue — the least shapeable and slowest-reacting of the four metrics.
Turnaround Against Inflection
Every figure so far concerns fresh inflection — an already-growing metric growing even faster. Two of the individual studies (earnings, cash flow) and the FCF turnaround study additionally measured an independent signal: the turnaround out of the red, where a metric turns positive for the first time after several loss-making quarters. Placed directly against each other, under the same twelve-month convention:
| Metric | Turnaround | Inflection | Difference |
|---|---|---|---|
| Earnings (organic) | 14.43% · turned from loss to profit, organic growth (W|org) · 586 pos. | 6.76% · fresh earnings inflection, organic growth (K|org) · 258 pos. | +7.67 points for the turnaround |
| Operating cash flow | 8.21% · operating cash flow turns from negative to positive (W) · 1,750 pos. | 13.86% · fresh inflection in operating cash flow (K) · 1,906 pos. | −5.65 points for the turnaround |
| Free cash flow (FCF) | 9.61% · free cash flow turns from negative to positive (w_h4_b2_m1) · 1,061 pos. | 10.95% · sustained positive free cash flow that accelerates (beschl) · 1,143 pos. | −1.34 points for the turnaround |
| S&P 500 Total Return (for reference) | 15.02% | 15.02% | — |
For earnings and operating cash flow there is additionally a broader turnaround variant with no organic-growth condition: the "earnings turnaround, all" (arm W, without the restriction to organic growth) returns 10.02 percent a year on 967 positions — weaker than the organic turnaround, but still clearly ahead of the earnings inflection.
The picture is mixed, but clear on one point: none of the three turnarounds beats the S&P 500 in its main arm. Even the strongest, the organic earnings turnaround at 14.43 percent, stays 0.59 points below the index. To be precise, that statement covers the main arms shown in the table: the FCF turnaround study does report, on the conservative count, exactly one of seven sensitivity variants above the index: a longer loss-making history on a thinner roster, 595 instead of 1,064 positions on the full count. On the full count there are three of seven. That one conservative variant sits above the S&P 500 at 15.68 percent on a twelve-month hold, and further above it on the shorter holds (18.09 percent at three months, 18.75 percent at six). That study flags the result with an explicit in-sample caveat and explains it on the spot. It stays there, and it changes nothing about this comparison.
Where turnaround and inflection are directly comparable on the same metric — operating cash flow and free cash flow — the inflection is clearly ahead. Only for earnings does the picture flip: the turnaround out of the red beats the fresh inflection by a wide margin, 7.67 points. This is the one genuine exception in this comparison, and we name it explicitly: companies turning from red to black numbers appear to be a stronger buy signal than companies whose already-positive earnings simply accelerate — but even this strongest of all turnaround signals is not enough to beat the simplest alternative purchase.
Control Chapter: The Cash Probe (Sloan Anomaly)
A warning signal is the counterpart to a buy signal: instead of asking where a metric is accelerating, the cash probe asks where it is drifting away from actual cash. It rests on the classic Sloan accrual anomaly: companies whose earnings rely heavily on accounting discretion (large accruals, valuation choices) rather than real cash flow tend to underperform companies with "harder", more cash-backed earnings. This anomaly attacks the same weak spot as our inflection family — the accounting discretion that can dilute a signal — which is why we carry it here as its own control chapter. Important, so stated up front: the cash probe follows its own convention and does not belong in the family table above.
| Cut | D1 minus D10, full period (2000–2026) | of which 2nd half (2013–2026, the family's own coverage period) |
|---|---|---|
| Full cross-section (all companies) | −1.07 points (monotonicity 0.32) | −6.45 points (monotonicity −0.03) |
| Above $100M revenue | +3.68 points (monotonicity 0.89) | +0.60 points |
| On a cash-conversion basis | +3.17 points (monotonicity 0.83) | +3.56 points (1st half: +2.76 points) |
The finding is clear: across the full cross-section of all companies, the classic accrual anomaly is already weak over the full period (−1.07 points between the best and worst decile — in the "wrong" direction, the worst decile does slightly better). In the second half of the period, which overlaps with our inflection family's own coverage, the picture turns even more clearly negative: −6.45 points, at a monotonicity near zero — the decile ranking is practically random. The famous accrual anomaly has vanished across the full cross-section over the family's own period.
Restricting the test to companies above $100 million in revenue — the same size threshold we identified as sensible for the revenue inflection scanner — leaves an edge of 3.68 points over the full period, with a clean decile monotonicity of 0.89. But even this remainder nearly evaporates in the second half, down to just 0.60 points. The cut on a cash-conversion basis (how much of earnings actually shows up as cash flow) proves more robust: here the effect holds in both halves — 2.76 points in the first, 3.56 in the second — 3.17 points in total across the full period.
We also checked whether an accrual filter improves our seven-point recipe from the growth backtest — once in its base form (internally "E7") and once in the form with a loss cap ("SB15"). Those are two versions of the same recipe, not two standalone signals. Skipping a purchase in the base form whenever a stock sits in the worst accrual tercile barely changes the return (14.38 to 14.29 percent a year, skipping 2,620 purchases); the loss-capped form shows the same pattern (15.58 to 15.53 percent, 3,130 purchases skipped). The filter mostly costs purchases without measurably improving the return — further evidence that the accrual signal has lost power over our period.
For this article's overall argument, that means: even as a warning signal, not only as a buy signal, accounting discretion no longer carries. Where the classic literature describes a robust effect, we find it in our period only with restrictions — meaningfully weakened at larger companies, reversed across the full cross-section. That fits the family's core finding: the further you move away from the unshaped headline number, revenue, the more noise gathers in the signal, whether as a buy or a warning signal.
Consequence: Only One Live Scanner
Out of this family of five backtests, exactly one live scanner has emerged: the revenue inflection scanner. It holds a narrow but real edge over the S&P 500, and it bakes in two lessons directly from the individual study: it lists only companies above $100 million in revenue (see the limits chapter below), and it lists a company only while the entry is still early — from the third accelerating quarter on, it automatically drops out again.
For the four remaining backtests we deliberately built no scanner derived from them: the earnings inflection misses the market by over eight points, the cash-flow inflection by a good point, the FCF turnaround (and its control arm) misses it too, and the cash probe yields no robust, standalone warning signal over our period anymore. A scanner shipping a signal that does not beat the simplest alternative purchase would be a distraction, not a tool — that holds unchanged for each of these four signals.
What This Comparison Does Not Say
This family view inherits the limits of each individual study and adds its own:
- Conservative versus full is a large gap throughout. Most striking at the revenue inflection: the conservative headline figure (16.56 percent) is less than two-thirds of the full count (26.28 percent) — a sign of how strongly a handful of suspect price quotes can pull the full count upward. We therefore consistently show the conservative figure as the headline number, with the full count alongside it only for context.
- Tiny revenue bases are poison across the whole family. On the revenue inflection, companies with a revenue base below $10 million return −1.25 percent a year on the conservative count (97 positions), companies between $10 million and $100 million only 3.30 percent (563 positions) — both below the universe average of 4.77 percent. Only above $100 million does the return become solid (14.58 percent, 2,017 positions), and combining "fresh" with "above $100M" delivers the strongest single cut in the family within the twelve-month convention, at 16.88 percent (372 positions). This exact revenue threshold is what the live scanner builds on.
- On revenue, a late entry is especially costly. Buying only from the third accelerating quarter on, instead of early, brings the full count down to just 0.69 percent a year (132 positions) — a drop of 25.59 percentage points against the early main variant (26.28 percent full) and a markedly larger drawdown (−70.54 against −24.44 percent). On the cash-flow inflection, the individual study explicitly found this sharp lesson does not apply — a late entry costs practically nothing there. The family's four metrics therefore do not respond uniformly to the same robustness test, and this article deliberately does not generalize across those differences.
- The ranking holds for the twelve-month convention. On shorter holds, the cash-flow inflection sits marginally above the index: 15.80 percent at three months, 16.01 percent at six months and 15.03 percent in the "as long as growth holds" variant — each on the conservative count, against 15.02 percent for the S&P 500. We say so openly. It changes nothing about the overall verdict: the short holds rest on a markedly thinner monthly roster, which is why the cash-flow study itself treats twelve months as its headline hold — and the revenue inflection stays ahead within its own headline convention.
- In-sample by construction. Every figure comes from the same, once-fixed run over a closed historical period (or, for the cash probe, a different closed period). None of the five rules has since been tested outside that period.
- Taxes and trading spreads are not modeled anywhere. Throughout, the only cost applied is 0.1 percent per side (per order for the cash probe).
- A backtest is not a forecast. This comparison is market research, not investment advice and not a buy recommendation — for none of the five backtests and none of their combinations.
Sources. Every figure in this roundup is carried over unchanged from the datasets and the accompanying run reports of the five linked individual studies; their underlying raw data is documented there (mandatory filings with the US securities regulator, 10-K and 10-Q, plus our own price history). No new computation was run for this article.
Frequently Asked Questions
Four standalone backtests from our team — revenue, earnings and cash-flow inflection, plus the FCF turnaround with its FCF inflection control arm — under the same convention (twelve-month hold, January 2013 to July 2026, equal-weighted, conservative count as headline number). The cash probe (Sloan accrual anomaly) joins as a fifth backtest; because it follows its own convention, it sits in a separate control chapter. None of the figures are freshly computed — each is carried over unchanged from the respective study's dataset or run report.
Because revenue is the least shapeable of the family's four metrics — it can barely be moved by depreciation, provisions or accounting discretion. At 16.56 percent a year, the revenue inflection sits 1.54 points ahead of the index; the cash-flow inflection (13.86 percent) and the earnings inflection (6.76 percent) miss it by 1.16 and 8.26 points respectively. The more accounting discretion a metric allows, the weaker its signal turns out to be in our numbers — its position in the income and cash-flow statement is not what decides, since earnings appear ahead of both cash-flow lines and still finish behind them.
Yes, they arrive earlier: among companies with both signals, the earnings inflection leads the revenue inflection by a median of four months, the cash-flow inflection by three. The lead did not help the return, though — quite the opposite: it is exactly the later signals (cash flow, then revenue later still) that pay better in our ranking. An earlier alarm is not a better one here.
Mixed, but clear on one point: none of the three tested turnarounds (earnings, operating cash flow, free cash flow) beats the S&P 500 in its main arm. For cash flow and free cash flow, the inflection leads over the turnaround in each case. Only for earnings does the picture flip: the organic earnings turnaround (14.43 percent) clearly beats the earnings inflection (6.76 percent) by 7.67 points — but stays 0.59 points below the index itself.
Because it follows a different convention — a different period (2000 to 2026 instead of 2013 to 2026), a different formation rule (end of June instead of month-end), its own benchmarks. We therefore never mix its figures into the family table. It fits the core finding all the same: even as a warning signal, the classic accrual anomaly has flipped to −6.45 percentage points across the full cross-section over our family's own period (2013 to 2026) — only with restrictions, such as above $100 million in revenue or on a cash-conversion basis, does anything survive.


