Revenue Inflection Backtest: The Fresh Inflection Beats the Established Grower — 16.6% Against 9.9% per Year
A company whose revenue suddenly jumps 30 to 70 percent after four quiet quarters: is it a better buy than one that has been growing hard for years? We tested the question across thirteen and a half years and 20,356 signals in the main variant — with delisted stocks left in the portfolio, with the filing date rather than the quarter end as the cut-off, and with a ceiling on the growth band, because triple-digit growth is no longer a beginning. The answer is yes, with three conditions: real revenue, an early entry, and a willingness to accept a markedly lower headline return once you strip out the positions under split suspicion. Against the S&P 500 including dividends, what then remains is about one and a half points a year — at markedly deeper drawdowns.
 Thomas Mücke
Founder & Publisher
Thomas Mücke
Founder & Publisher
The question: the start of a growth story, or the middle?
A growth screener reliably finds companies whose revenue is exploding right now. The problem is not the number, it is the timing: if we can see a tripling, so can the market. The more interesting question is therefore not "who is growing fastest?" but "who is just starting to grow?".
That is what we measured. The rule in this backtest looks for the inflection in the revenue curve — the moment an unremarkable business switches on. It has two parts, and both have to hold:
- Acceleration. The most recent two or more consecutive quarters each grow 30 to 70 percent against their year-ago quarter. That is a band, not a floor — and the thesis lives in that distinction.
- A quiet run before it. The four quarters immediately preceding the first accelerating quarter each grew by less than 15 percent. Only that turns a growth stock into an inflection; without it every long-running grower that happens to sit in the band would be counted too.
The 70 percent ceiling is the claim everything hangs on: a company growing at triple digits is no longer at the start. The counter-test is Nvidia. Through its 2023/24 hypergrowth phase six consecutive quarters sat between 93 and 265 percent growth — all above the band. Nvidia produced no signal in any variant in that period. Exactly as intended.
Nothing that meets the acceleration test is discarded. A company that cannot put the quiet run on the record is reported rather than thrown out — either as history too short (usually a recent listing) or as already growing (at least one prior quarter sat above the quiet threshold). Comparing those three classes is the study. A filter would have turned the comparison into an assertion.
The result in four numbers
Was the fresh revenue inflection, in hindsight, the better buy than an already established grower? Four numbers carry the result:
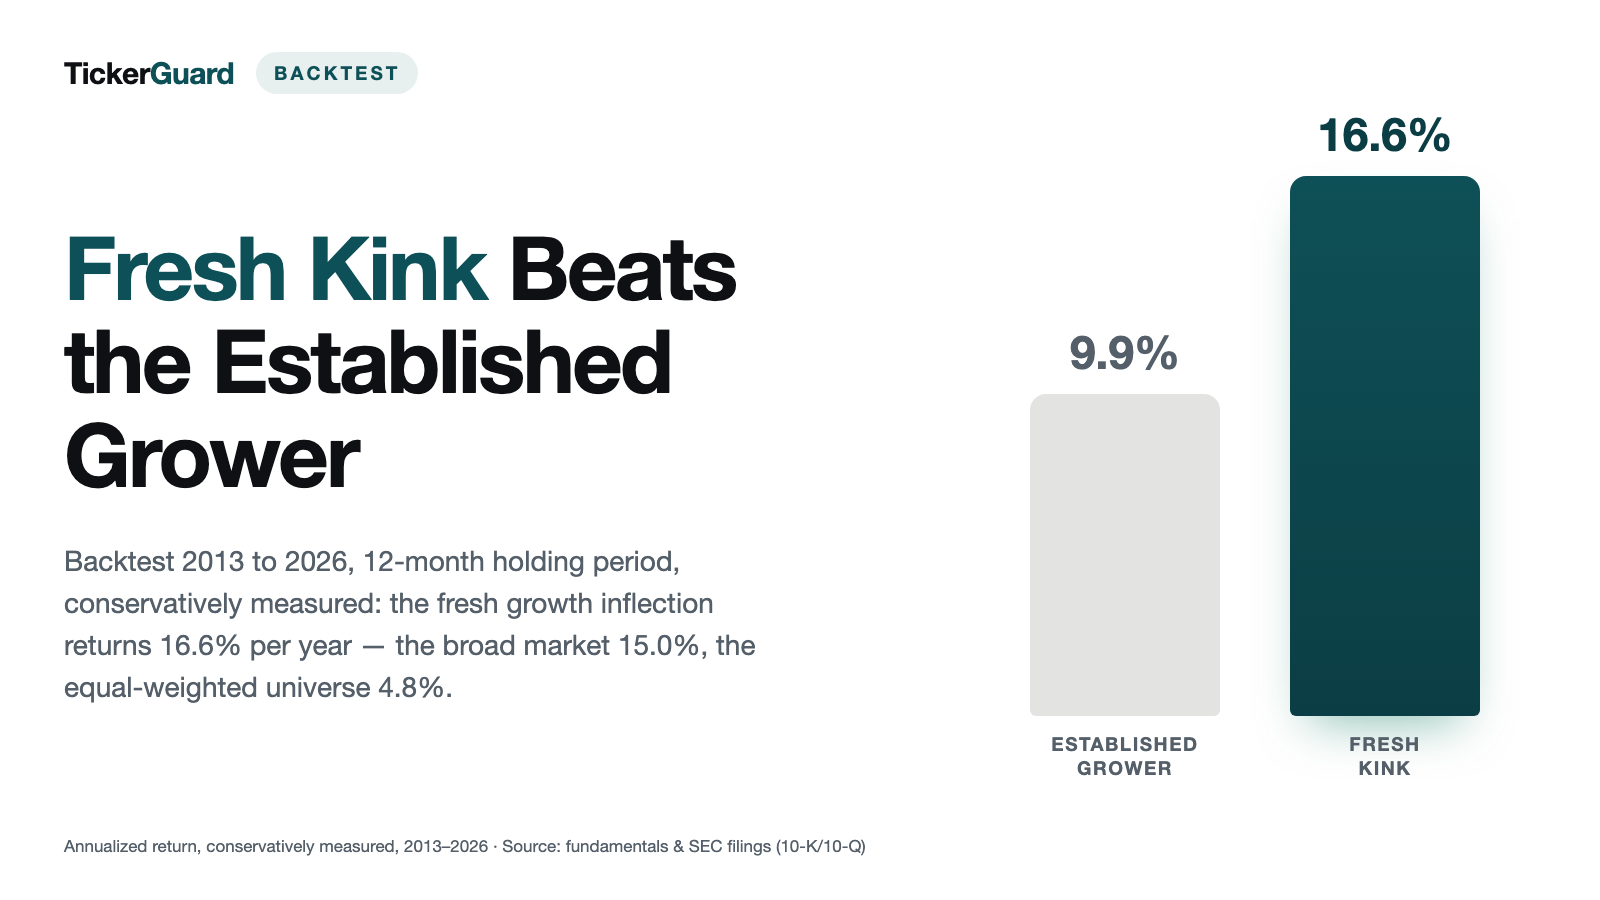
- 16.56% per year is what the fresh inflection (organic, twelve-month hold) returned on the conservative count — the headline figure of this study. On the headline run it would be 26.28%, but a price error in a handful of positions inflates that level artificially.
- 9.89% is what the established grower returned by comparison on the conservative count, against 15.02% for the S&P 500 including dividends over the same months. The fresh inflection barely beat the index — at a markedly deeper drawdown (−33.71% against −23.87%).
- 0.69% per year was left once a third accelerating quarter was required instead of two, against 26.28% for the timely entry. One extra quarter of confirmation cost practically the entire excess return.
- 21.54% per year is what purchases with a revenue base above $100M returned — between $10M and $100M just 5.77%, below that 2.25%. Without real revenue the signal did not carry.
In the tested window from 2013 to 2026, the fresh revenue inflection outpaced the established grower and narrowly outpaced the benchmark — but only where revenue was real and the entry was early, and only the conservative figure matched the actual return level.
The result: the fresh inflection comes out ahead
We show the core figure in two versions side by side, and the more cautious one comes first. Why is in the chapter on the data error further down — in short: 16 of the 2,693 positions in the headline run are under split suspicion, and removing them cuts the fresh inflection by a good third (26.28% to 16.56%) and the established grower by half (19.35% to 9.89%), without reversing the ranking.
| Arm | Positions (headline run) | conservative (excl. split suspects) | headline run | largest drawdown (conservative) |
|---|---|---|---|---|
| fresh inflection, organic | 277 | 16.56% | 26.28% | −33.71% |
| established grower, organic | 1,045 | 9.89% | 19.35% | −43.70% |
| history too short (IPO-adjacent), organic | 93 | −6.96% | −6.96% | −99.11% |
| all purchases in the backtest | 2,693 | 11.91% | 18.47% | −33.20% |
| S&P 500 Total Return | — | 15.02% (identical in both calculations) | −23.87% | |
| Universe, equal-weighted (trimmed mean) | — | 4.77% (identical in both calculations) | −53.23% | |
Both versions say the same thing about the order: the fresh inflection beats the established grower, and both beat the equal-weighted universe by a wide margin — though that universe is the trimmed average of all stocks (the most extreme one percent at each end is left out), not the market an index fund tracks. They say something very different about the level. Anyone taking one number away from this study should take 16.56%, not 26.28%.
Which leaves the question an investor asks first: what does this buy you over an index fund? On the conservative count the edge is 1.5 percentage points — 16.56% against 15.02% for the S&P 500 including dividends. And it is paid for with a markedly deeper hole along the way: a 33.71% drawdown against 23.87% for the index. The established grower sits clearly below the index at 9.89%, and all purchases in the backtest together come to 11.91% on the conservative count — below the index as well. Put differently: whatever survives against the market here sits entirely in the selection of fresh inflections, and it is narrower than the headline run suggests.
Nor is the advantage uniform across holding periods. It is largest over three months — but there the arm holds a median of only four stocks per month, a number that measures individual companies more than a strategy. Over twelve months the arm holds a median of 15 stocks and never drops to two or fewer in a single month. That is why twelve months is the main mode of this study and three is not.
| Holding period | Arm | Positions | Stocks/month (median) | Months with ≤ 2 | Return p.a. |
|---|---|---|---|---|---|
| 3 months | fresh inflection, organic | 277 | 4.0 | 39 | 36.74% |
| 3 months | established grower, organic | 1,121 | 17.0 | 0 | 13.50% |
| 6 months | fresh inflection, organic | 277 | 8.0 | 6 | 29.63% |
| 6 months | established grower, organic | 1,121 | 32.0 | 0 | 11.03% |
| 12 months | fresh inflection, organic | 277 | 15.0 | 0 | 26.28% |
| 12 months | established grower, organic | 1,045 | 59.0 | 0 | 19.35% |
| as long as growth holds | fresh inflection, organic | 277 | 13.0 | 0 | 16.02% |
| as long as growth holds | established grower, organic | 994 | 58.5 | 0 | 15.05% |
The most important limitation: the signal needs real revenue
Split the purchases by the size of the business the inflection sits on — the sum of the last four reported quarters — and the result falls apart into two worlds:
| Revenue base | all purchases | fresh inflections only (any origin) |
|---|---|---|
| below $10M | 2.25% | 4.48% (12 positions) |
| $10M to $100M | 5.77% | 7.78% (119 positions) |
| above $100M | 21.54% | 21.88% (374 positions) |
The reason is arithmetic, not judgement. An example from the database: Cuentas Inc. produced a clean signal in August 2021 — two quarters at 67.9 and 32.5 percent growth, four quiet quarters before them, fully compliant with the rule. Revenue rose from $117,000 to $155,000. A revenue base of $687,000. The position lost 72.7 percent over twelve months.
A revenue jump of that size is statistically hard to tell apart from noise. That is exactly why our live "Revenue Inflection" scanner does not list companies below $100M in revenue at all. That threshold is not part of the tested rule, it is its consequence: it sits where the measurement put it.
The second limitation: the entry has to be early
We turned three dials on the rule, one at a time, everything else unchanged — the quiet threshold in both directions, which makes four variants. Two of the three change little. One changes everything: the number of accelerating quarters demanded.
| Variant | What was turned | Positions | Return p.a. |
|---|---|---|---|
k2_30_70_r15 | Baseline: band 30–70%, quiet below 15%, two quarters | 277 | 26.28% |
k2_30_70_r10 | Quiet threshold tightened to 10% | 206 | 26.49% |
k2_30_70_r20 | Quiet threshold loosened to 20% | 380 | 23.09% |
k2_25_80_r15 | Band widened to 25–80% | 493 | 22.01% |
k3_30_70_r15 | Three instead of two accelerating quarters required | 132 | 0.69% |
Waiting for a third accelerating quarter instead of buying after two does not buy better confirmation, it buys in too late: 0.69% per year instead of 26.28%. One extra quarter of confirmation costs practically the entire excess return. This is the most uncomfortable finding in the study, because it cuts against intuition — more confirmation feels safer and demonstrably is not.
The other two dials behave well. A tighter or looser quiet threshold (10 instead of 15, 20 instead of 15 percent) only shifts positions between classes and leaves the conclusion standing. A wider band (25 to 80 instead of 30 to 70 percent) nearly doubles the number of hits and lowers the return slightly — the direction holds, the advantage shrinks. So the result depends on the rule, not on an arbitrary setting of it.
The data error that cuts the headline number by a third
Recomputing individual positions by hand, one stood out: DHCP, entry March 2017, booked gain over twelve months plus 730.7 percent. The underlying price series shows $0.6732 for January 2018 and $10.19 for February 2018 — with an adjustment factor of an unchanged 1.0.
That is not a price move. That is a reverse split that was never carried into the adjusted price. The gain does not exist.
How common? 172 of 419,389 position-months across the whole database sit above 200 percent monthly return — 0.04 percent. In the main arm on a twelve-month hold it affects three of 277 positions. Those three carry almost ten percentage points of annual return. The error is proven for one of those cases; the rest are under suspicion, because a monthly jump of that size almost always has the same cause.
| Arm | with all positions | excluding split suspects | difference |
|---|---|---|---|
| fresh inflection, organic | 26.28% | 16.56% | −9.72 points |
| established grower, organic | 19.35% | 9.89% | −9.47 points |
| all purchases in the backtest | 18.47% | 11.91% | −6.56 points |
We do not quietly remove these positions, because a monthly jump above 200 percent can also be real — a takeover bid, a drug approval. Both calculations therefore stand side by side. The gap between them is the honest answer to how much rides on a handful of positions: the ranking holds, the level does not.
Year by year: the advantage comes from a few years
An average annual return of 16 or 26 percent says little about what holding it would have felt like. The yearly series does:
| Year | fresh inflection, organic | same group, conservative | established grower, organic | S&P 500 TR | Universe |
|---|---|---|---|---|---|
| 2013 | +20.74% | +20.74% | +31.79% | +32.39% | +31.86% |
| 2014 | −6.28% | −6.28% | +164.63% | +13.69% | +1.13% |
| 2015 | −3.97% | −13.03% | −16.45% | +1.38% | −12.76% |
| 2016 | −0.11% | −7.06% | +5.92% | +11.96% | +14.55% |
| 2017 | +6.37% | +4.59% | +10.72% | +21.83% | +15.72% |
| 2018 | +102.29% | +4.97% | −17.56% | −4.38% | −13.03% |
| 2019 | +39.79% | +39.79% | +27.23% | +31.49% | +14.23% |
| 2020 | +77.60% | +81.31% | +27.65% | +18.40% | +51.12% |
| 2021 | +57.03% | +20.47% | +11.04% | +28.71% | +24.69% |
| 2022 | −3.75% | −3.75% | −26.07% | −18.11% | −33.71% |
| 2023 | +26.64% | +26.64% | +12.80% | +26.29% | −3.08% |
| 2024 | +30.58% | +30.58% | +38.23% | +25.02% | −3.22% |
| 2025 | +37.73% | +37.73% | +61.43% | +17.88% | +2.08% |
| 2026 (partial) | +19.26% | +19.26% | +16.98% | +10.14% | +2.70% |
Two things stand out. First, the excess return of the fresh inflections comes from a few very strong years — 2018, 2020 and 2021 carry the advantage, while in four years the arm was negative (2014, 2015, 2016 and 2022) — and in two of those, 2014 and 2016, the market rose by double digits at the same time. Second, the difference between the headline and the conservative calculation concentrates in a few years — and in different ones for each arm. For the fresh inflection they are 2018 (102.29% against 4.97%) and 2021 (57.03% against 20.47%). The single most striking figure in the table belongs to the established grower instead: the 164.63% of 2014 shrink to −0.65% on the conservative count — that row is almost entirely a price artefact rather than performance. For the fresh inflection 2014 is unremarkable; there both calculations agree.
How many hits are there at all?
| Year | Companies | Signals | fresh inflection | history too short | already growing |
|---|---|---|---|---|---|
| 2013 | 235 | 954 | 130 | 102 | 722 |
| 2014 | 260 | 1,079 | 176 | 61 | 842 |
| 2015 | 311 | 1,437 | 247 | 162 | 1,028 |
| 2016 | 270 | 1,331 | 202 | 201 | 928 |
| 2017 | 283 | 1,299 | 276 | 149 | 874 |
| 2018 | 341 | 1,656 | 282 | 156 | 1,218 |
| 2019 | 339 | 1,569 | 228 | 257 | 1,084 |
| 2020 | 286 | 1,162 | 199 | 192 | 771 |
| 2021 | 471 | 1,895 | 508 | 174 | 1,213 |
| 2022 | 670 | 3,122 | 501 | 288 | 2,333 |
| 2023 | 452 | 1,961 | 213 | 182 | 1,566 |
| 2024 | 264 | 1,073 | 146 | 77 | 850 |
| 2025 | 243 | 1,101 | 164 | 74 | 863 |
| 2026 | 207 | 717 | 124 | 60 | 533 |
The number of hits swings hard with the market backdrop — 2022 is the record year, and that is no accident: after the 2020 Covid collapse, many quarters looked artificially good in the year-on-year comparison. So we repeated the calculation without every entry between April 2020 and December 2022.
| Holding period | fresh inflection, organic | established grower, organic | all purchases | positions dropped (all purchases) |
|---|---|---|---|---|
| 3 months | 28.09% | 9.84% | 13.73% | 918 of 2,833 |
| 6 months | 25.60% | 8.85% | 11.02% | 918 of 2,833 |
| 12 months | 23.03% | 20.07% | 18.85% | 875 of 2,693 |
| as long as growth holds | 13.41% | 13.53% | 12.32% | 844 of 2,597 |
The finding holds in the main mode. Without the Covid window the fresh inflection stays ahead on a twelve-month hold, if by a smaller margin — 23.03% against 20.07%. In the "as long as growth holds" row the ranking flips instead (13.41% against 13.53%); the conclusion of this study rests on the twelve-month mode, not on that selling rule. So the advantage is not purely a base effect, but it is supported by one.
Valuation: "cheap" only helps inside the group
The obvious follow-up: are the cheaper inflections the better ones? We split the 2,658 purchases with a known price-to-sales ratio (of 2,693) into two halves at the median of that ratio, then looked at how the fresh inflections distribute across the two sides. The result is two-sided and does not generalise:
| Group | cheaper side | more expensive side |
|---|---|---|
| fresh, organically grown inflections only | 27.77% (176 positions) | 18.55% (100 positions) |
| all purchases in the backtest | 13.80% (1,329 positions) | 22.02% (1,329 positions) |
Within the fresh, organically grown inflections the cheaper side clearly beats the more expensive one. Across all purchases in the backtest it is exactly the other way round: there the expensive side leads. Turning the first finding into a general rule reads the opposite of what the numbers say.
Two notes on reading this: the dividing line is the median across ALL purchases, not the median within the inflection group. It therefore halves only the total set (1,329 against 1,329); of the 277 fresh, organically grown inflections 176 land on the cheaper and 100 on the more expensive side (one lacks a ratio) — they are cheaper than the average purchase to begin with. And 100 positions is a thin basis for the more expensive side.
Organic or acquired?
Revenue can also jump because one company bought another. We reused the classification from our organic growth backtest unchanged: organic, acquired or unknown, as of the cut-off date. "Unknown" is never counted as "organic".
| Origin | all purchases | fresh inflections only |
|---|---|---|
| organically grown | 23.19% (1,415) | 26.28% (277) |
| acquired | 7.60% (640) | 7.54% (136) |
| unknown | 13.60% (638) | 7.18% (92) |
The difference is large and points the expected way. That is why the return comparisons in this study — core table, holding periods, yearly series, robustness — use the organic arm rather than the full one: an acquired revenue jump is not an inflection, it is an accounting entry. The revenue-base table further up is the exception: it asks about the size of the business and therefore lists every fresh inflection, whatever the origin of its growth.
How we calculated
The cut-off date is the whole point. We compute exclusively on quarters that had actually been filed with the securities regulator as of the respective month end. A backtest that uses a figure from the day its quarter ended buys six to eight weeks early — and for a stock that is just switching on, half the move often sits in exactly that window. The result would be systematically too good, without it showing anywhere.
- Universe and period. US stocks, January 2013 to July 2026, 163 months. The start sits in 2013 because machine-readable filing only took hold around 2009 and the longest window of this signal reaches twelve quarters back.
- Delisted stocks are included and stay in the portfolio. If a price series ends mid-period, the position is force-sold at the last price. That is what makes this backtest say anything at all.
- Portfolio. Equal-weighted, monthly rebalancing, 0.1 percent costs per side, minimum price $1 on the entry day (measured on the raw price, computed on the adjusted one). A purchase happens at the first signal of an episode; a running position is never topped up. A month without a position earns zero.
- Gap-free series. We compute on the gap-free tail of the quarter sequence, measured by label rather than calendar day — with 52/53-week fiscal years the quarter ends shift by up to a week, the label sequence does not.
- Threshold comparisons run with tolerance. Every limit is defined as inclusive: exactly 30 percent is a hit, exactly 15 percent is a breach of the quiet run. Without that tolerance the floating-point representation decides instead of the rule: growth of exactly 15 percent lands just below the line for one company's revenue figures and just above it for another's. The rule would not be strict, it would be arbitrary.
- Cross-check. The monthly series re-aggregated for this report deviate from those stored during the portfolio run by 0 percentage points. Report and main run compute the same thing.
Sources. Quarterly revenue and filing dates from the public mandatory disclosures of the US securities regulator (annual reports 10-K and quarterly reports 10-Q, machine-readable via EDGAR); where figures were restated, the first reported value counts. Monthly prices, share counts and the S&P 500 Total Return benchmark from our own database, taken unchanged from the organic growth backtest. No network requests during the run.
What this study does not say
- The main arm is narrow. A median of 15 stocks per month. Enough not to be measuring individual companies, few enough that single years swing hard.
- 15.02% of quarters are derived arithmetically. The fourth quarter is formed as annual revenue minus the first three quarters, because the regulator does not require it separately. Those quarters are computed, not reported.
- For 22.15% of signals it is unknown whether the growth was organic. Those cases run as their own group and are never counted as organic.
- The IPO-adjacent group carries no conclusion. In 31 of its 159 invested months it held at most two stocks — for comparison, the main arm never drops to two or fewer across its 162 invested months. We report the group but base no return claim on it.
- The level is not robust, the ranking is. See the chapter on the data error.
- Taxes and trading spreads are missing. We model 0.1 percent costs per side and nothing else. A portfolio that adds monthly and turns over yearly pays tax on its gains; with smaller US stocks the spread between bid and ask comes on top. Both cut into the result further.
- Only monthly jumps above 200 percent were screened. Smaller reverse splits that were likewise never carried into the adjusted price may still sit inside the conservative figure.
- A backtest is not a forecast. This study is market research, not investment advice and not a buy recommendation.
What we built from it
The backtest turned into a live scanner: Revenue Inflection. It applies the tested rule to our universe every day — the same two conditions, the same band ceiling, the same demand for four quiet quarters on the record. Two findings from this study are built into it: it only lists companies from $100M in revenue upwards, and it only lists a company while that entry is still early: from the third accelerating quarter onwards it drops back off. The number of accelerating quarters sits on every hit.
A hit there is a find, not a buy signal. This study says under which conditions the rule carried in hindsight — not that it will do so again.
Frequently Asked Questions
A buy rule in two parts. First, acceleration: the most recent two or more consecutive quarters each grow 30 to 70 percent against their year-ago quarter. Second, the quiet run before it: the four quarters immediately preceding the first accelerating quarter each grew by less than 15 percent. A company meeting both counts as a fresh inflection. Purchases happen at month end, equal-weighted, with 0.1 percent costs per side, and are held for 3, 6 or 12 months depending on the variant, or — in the fourth variant — for as long as the latest reported quarter still sits at least 20 percent above its year-ago quarter, capped at 120 months.
Because the thesis is about the start of a story, not its middle. A company growing at triple digits is no beginner — the market has seen that story and priced it. The 70 percent ceiling is the real claim of this backtest, and it survives the counter-test: Nvidia produced no signal in any variant during its 2023/24 hypergrowth phase, because all six quarters sat above the line.
Because 16 of the 2,693 positions in the headline run rest on a data error. The price database contains reverse splits that were never carried into the adjusted price; the documented case is DHCP, whose price jumps from $0.67 to $10.19 between January and February 2018 while the adjustment factor stays at 1.0. Three such positions carry almost ten percentage points of annual return in the main arm. We do not quietly delete them, because a monthly jump above 200 percent can also be real — a takeover bid, a drug approval. The gap between the two figures is the honest answer to how much rides on them.
Because the signal does not carry there. Split by revenue base across all purchases in the backtest, the group above $100M returned 21.54% per year, the group between $10M and $100M 5.77%, and everything below 2.25%; restricted to the fresh inflections it is 21.88%, 7.78% and 4.48% — the same gradient. The reason is arithmetic: a revenue jump from $117,000 to $155,000 formally satisfies the rule but is statistically hard to tell apart from noise. Our live scanner therefore only lists companies from $100M in revenue upwards.
They form their own class, and this backtest says nothing reliable about them. A company that meets the acceleration test but has no four prior quarters cannot put the quiet run on the record. We do not throw those cases away, we report them separately — and we also report that the group is too thinly populated: in 31 of its 159 invested months it held at most two stocks. A portfolio of one or two shares measures those companies, not the rule. A return figure on that basis measures a company, not a strategy.
Within the inflection group yes, across all purchases no — and that difference does not generalise. The dividing line is the median price-to-sales ratio across all purchases with a known ratio (2,658 of 2,693), so it halves that set (1,329 against 1,329) rather than each subgroup. Of the 277 fresh, organically grown inflections, 176 fall on the cheaper side and 100 on the more expensive one; one lacks a ratio. They are cheaper than the average purchase to begin with. On the cheaper side they returned 27.77% per year, on the more expensive one 18.55%. Across all purchases the relationship reverses: 13.80% cheap against 22.02% expensive. Turning the first finding into a general rule reads the opposite of what the numbers say.


