Organic Hypergrowth: 18.13% a Year — Acquired Hypergrowth Loses Money
We retested the "Triple-Digit Revenue Growth" stock scanner from January 2013 through July 2026 on the US stock market — every delisted company included, every signal evaluated only on figures already filed by that date. The real question wasn't whether hypergrowth beats the market; it was where the growth came from. Companies that grew seven straight quarters under their own power beat the S&P 500 in every holding period we tested. Companies that hit the identical revenue pattern through acquisitions lost money in three of the four holding periods and merely broke even in the fourth, with drawdowns as deep as −94%. Buy both groups together without separating them, and you get only an unreliable average — with drawdowns as deep as −58.7%.
 Thomas Mücke
Founder & Publisher
Thomas Mücke
Founder & Publisher
The platform runs a stock scanner called "Triple-Digit Revenue Growth": it flags a company the moment its quarterly revenue has risen against the prior quarter for seven consecutive quarters and has at least doubled across that window. We retested this signal on the entire US stock market from January 2013 through July 2026, including every company that has since delisted, been acquired, or gone bankrupt. The obvious question is whether hypergrowth beats the market.
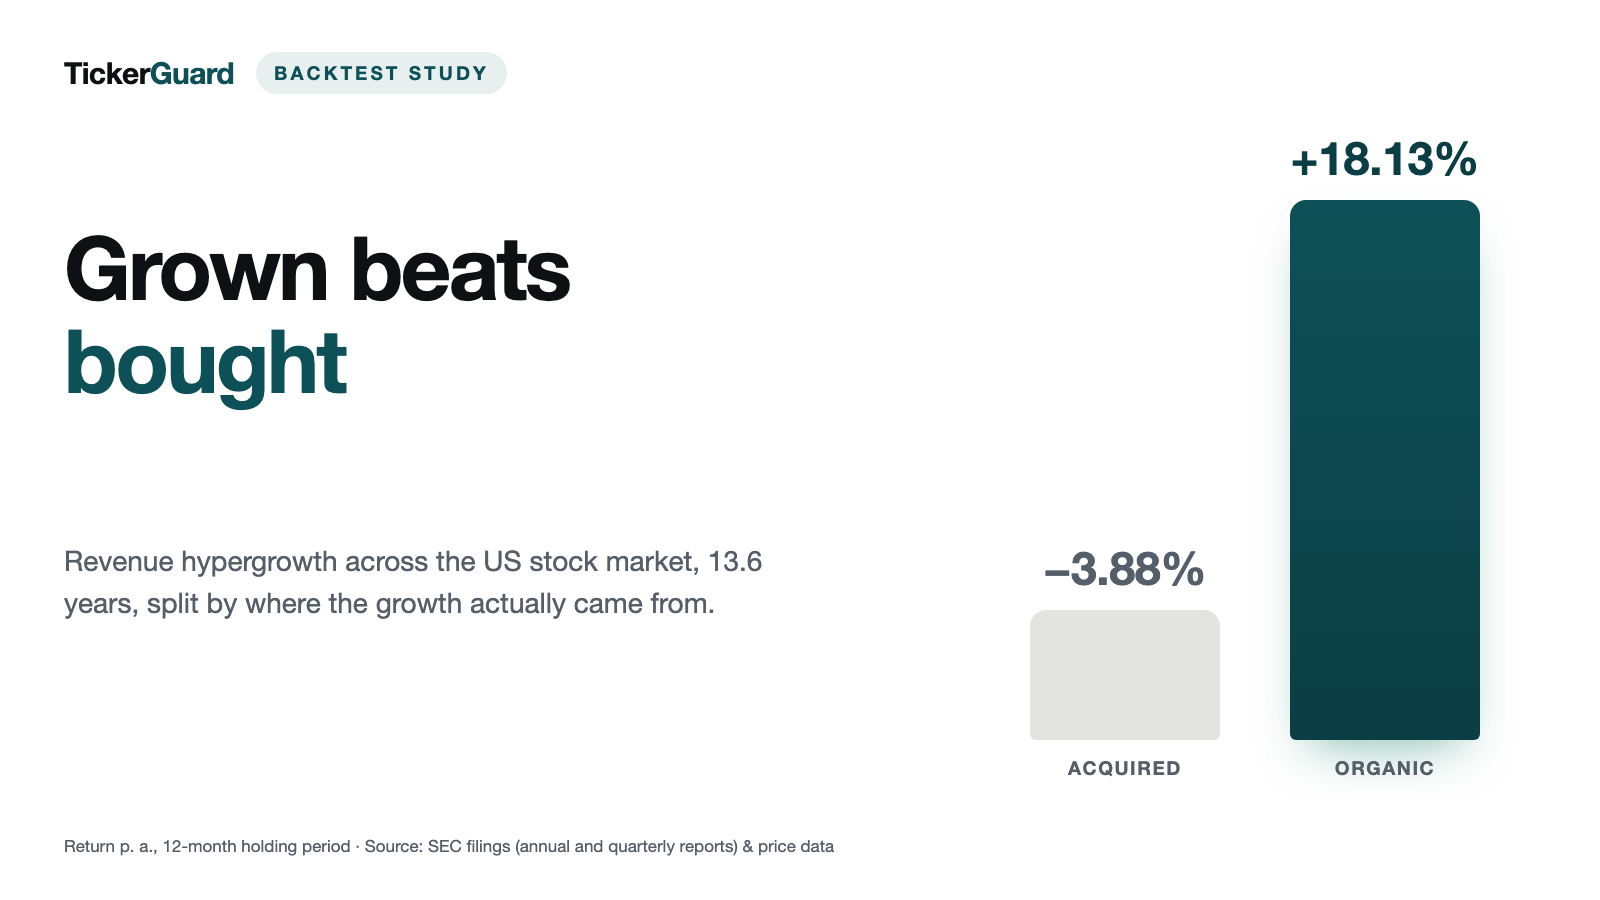
The honest answer is messier than the question suggests: it depends entirely on where the growth came from. Companies that grew under their own power beat the S&P 500 Total Return Index in every holding period we tested — at a 12-month hold, 18.13% a year against 15.02% for the index. Companies that hit the exact same revenue pattern through acquisitions lost money in three of the four holding periods tested and merely broke even in the fourth — at 12 months, −3.88% a year. Buy every signal without separating the two, and the result is a shaky average of 9.46% — worse than the market the scanner is supposed to beat. Data as of August 7, 2026.
The result in four numbers
Does hypergrowth beat the market — and does it depend on where the growth came from? Four numbers from this study's main holding period (12 months) carry the answer:
- 18.13% a year is what the organically grown arm B returned — companies whose revenue growth came under their own power, not from acquisitions.
- 15.02% is what the S&P 500 Total Return Index returned over the same period, as the benchmark. The organic arm led in all four holding periods tested, between 18.13% and 31.83% a year.
- −3.88% a year is what the acquired arm C returned instead — the identical revenue pattern, reached through acquisitions. Buy every signal without separating the two (arm A), and the return is 9.46% — worse than the index.
- −52.07% maximum drawdown hit even the organic arm at some point, against −23.87% for the index — the higher return came with a drawdown more than twice as deep.
Across the test window from 2013 through July 2026, organic hypergrowth beat the market, while acquired growth under the identical signal lost money.
The signal: seven quarters, each one stronger than the last
The main signal in this study is internally called f7_x2.0: seven consecutive quarters in which revenue rose against the prior quarter in every single step, ending at least double the starting quarter's revenue. That's deliberately strict — one weaker quarter anywhere in the chain breaks the signal, no matter how strong the rest of the picture looks.
Every signal fires only on the monthly test date by which the most recent required quarter had actually been filed with regulators — not at the end of the quarter itself. Without that rule, the backtest would have bought six to eight weeks too early, using information no real investor had at the time. A position is only opened on a growth episode's first signal; an ongoing signal doesn't trigger additional buying.
So the headline finding doesn't rest on one arbitrarily chosen window size, we ran five related variants of the same idea in parallel — shorter and longer windows (five and nine quarters), lower and higher growth thresholds (1.5x and 2.5x), and a year-over-year version requiring four quarters of growth against the same quarter a year earlier. The main signal, f7_x2.0, fired 5,963 signal-months across 700 different companies over the full period — an average of a little over two new organic buy signals a month, plus the acquired and unknown hits on top.
Organic or acquired: how we drew the line
Doubled revenue alone says nothing about whether a company grew under its own power or bought the growth. We checked every seven-quarter window against two figures taken directly from each company's actual SEC filings (annual and quarterly reports, 10-K/10-Q):
- Acquisition spending within the window, measured against the window's total revenue — if it exceeds 5%, the growth is treated as at least partly acquired.
- Goodwill growth within the window, measured against annualized revenue growth — if it exceeds 20% of that figure, that's a second, independent sign of acquisitions rather than organic growth.
If either threshold is tripped, the hit goes into arm C — acquired. If both figures stay clean, it goes into arm B — organic. If the filings don't contain enough information to judge either way, it goes into arm U — unknown, which is never counted as organic. Arm A, for context, is simply every hit combined — the scanner's raw, unsorted signal.
Across the main signal's 5,963 signal-months, the split comes out to 2,861 (48.0%) organic, 1,091 (18.3%) acquired, and 2,011 (33.7%) unknown. A third of all hits simply can't be classified with the available filing data — that's part of this study's honest picture too.
The headline result: four holding periods, one recurring pattern
We bought every signal under four different holding rules: fixed 3-, 6- and 12-month holds, plus a fourth version that holds a position for as long as the signal itself keeps firing and sells the month it first stops. Twelve months is this study's main holding period.
| Arm | Return p.a. | $100,000 becomes | Max drawdown |
|---|---|---|---|
| A — all hits | 9.46% | $341,410 | −58.74% |
| B — organically grown | 18.13% | $961,690 | −52.07% |
| C — acquired growth | −3.88% | $58,420 | −88.78% |
| U — not classifiable | 1.68% | $125,380 | −61.05% |
| S&P 500 Total Return | 15.02% | $669,350 | −23.87% |
| Equal-weighted universe (no selection) | 4.77% | $188,190 | −53.23% |
The gap between 18.13% and −3.88% a year isn't a footnote — it's the actual finding of this study. And it doesn't just hold at a 12-month hold:
| Holding period | A — all | B — organic | C — acquired | U — unknown |
|---|---|---|---|---|
| 3 months | 17.21% (−52.91%) | 31.83% (−54.77%) | −12.62% (−94.02%) | 4.39% (−66.94%) |
| 6 months | 11.83% (−58.32%) | 25.23% (−55.04%) | −5.28% (−91.93%) | 4.75% (−66.72%) |
| 12 months (main) | 9.46% (−58.74%) | 18.13% (−52.07%) | −3.88% (−88.78%) | 1.68% (−61.05%) |
| Held while signal lasts | 16.68% (−55.27%) | 26.03% (−53.67%) | 0.03% (−80.77%) | 11.41% (−46.92%) |
In every one of the four holding periods, the organic arm lands between 18.13% and 31.83% a year, clearly above the S&P 500 Total Return Index's 15.02%. In every one of the four holding periods, the acquired arm lands between −12.62% and 0.03% — never above the index, mostly deep in negative territory. The unsorted arm A, by contrast, swings between 9.46% and 17.21%: occasionally just above the market, mostly below it. The scanner's raw signal is, on its own, an unreliable buy rule — it's the average of a dependable winner and a dependable loser, and depending on the holding period, one or the other happens to dominate the blended result.
That edge did not build evenly, though. At the main holding period the organic arm finished ahead of the S&P 500 Total Return Index in only 6 of 14 calendar years — its excess return comes from a handful of very strong years, above all 2020:
| Year | B — organic | C — acquired | S&P 500 TR |
|---|---|---|---|
| 2013 | +69.20% | +48.23% | +32.39% |
| 2014 | −0.16% | −4.21% | +13.69% |
| 2015 | −1.79% | −15.03% | +1.38% |
| 2016 | −6.08% | −4.72% | +11.96% |
| 2017 | +42.68% | +33.79% | +21.83% |
| 2018 | −12.96% | −35.78% | −4.38% |
| 2019 | +21.42% | −14.70% | +31.49% |
| 2020 | +115.90% | −4.09% | +18.40% |
| 2021 | −13.59% | −26.68% | +28.71% |
| 2022 | −29.94% | −46.10% | −18.11% |
| 2023 | +10.94% | −6.80% | +26.29% |
| 2024 | +39.30% | +14.35% | +25.02% |
| 2025 | +38.13% | +62.65% | +17.88% |
| 2026 (through July) | +46.70% | +5.53% | +10.14% |
The uncomfortable part: brutal drawdowns in all four arms
The extra return didn't come free. Even the organic arm B — the best of the four — lost between 52.1% and 55.0% of its value at some point, more than double the S&P 500 Total Return Index's worst drawdown of −23.87% over the same period. The acquired arm C is by far the harshest case: drawdowns between −80.8% and −94.0%, depending on holding period — a range a portfolio essentially never recovers from.
Delistings during a holding period are booked at the last tradable price in this study, not erased — the more realistic but also gentler assumption. A second, harsher track counts every delisting as a total loss (−100%) instead. At the main 12-month hold, that barely moves the organic arm, from 18.13% down to 17.02% a year; the acquired arm falls further, from −3.88% to −9.17%. Worth noting: even under this harshest assumption, the organic arm still clears the S&P 500 Total Return Index in every one of the four holding periods (17.02% to 29.71%, against 15.02%) — the excess return isn't riding on an optimistic delisting assumption.
The Covid trap: why 2022 isn't a normal year
Counting signals by year turns up an outlier that's impossible to miss: 2022 fired the main signal on 279 companies across 1,446 signal-months — more than double the strongest other year (2023: 627 signal-months) and several times a typical year (177 to 478 signal-months, 44 to 93 companies).
| Year | Companies | Signal-months |
|---|---|---|
| 2013 | 49 | 261 |
| 2014 | 75 | 425 |
| 2015 | 74 | 344 |
| 2016 | 73 | 316 |
| 2017 | 72 | 337 |
| 2018 | 85 | 478 |
| 2019 | 93 | 399 |
| 2020 | 74 | 344 |
| 2021 | 76 | 375 |
| 2022 | 279 | 1,446 |
| 2023 | 140 | 627 |
| 2024 | 51 | 219 |
| 2025 | 55 | 215 |
| 2026 | 44 | 177 |
The cause isn't a data error — it's a genuine base effect. 80.6% of these 2022 signal-months had their seven-quarter window start during the 2020 lockdown trough (window opening between Q2 and Q4 2020), meaning they mostly measure a return to pre-Covid revenue levels rather than genuine hypergrowth. Documented on actual hits with a 2020Q2-to-2021Q4 window: Chevron (3.57x), Delta Air Lines (6.45x), Live Nation (36.5x), MGM Resorts (10.5x) and Valero Energy (3.45x) — reopening and oil-price stories, not hypergrowth in any meaningful sense. As a counter-check, Snowflake also fires that year, but from genuine, secular revenue growth — correctly counted. On top of that, 46.2% of 2022's flagged companies fire in no other year of the entire study period — a sign of one-off distortions rather than a lasting growth pattern.
We therefore built a second, more robust version: the identical strategy, but excluding every entry in 2021 and 2022 — both years drop out because the seven-quarter window spans the calendar-year boundary and would otherwise blend contaminated and clean cohorts.
| Holding period | A — all | B — organic | C — acquired | U — unknown |
|---|---|---|---|---|
| 3 months | 20.08% (−32.82%) | 36.14% (−33.64%) | −3.22% (−76.03%) | 7.78% (−49.75%) |
| 6 months | 14.59% (−41.48%) | 29.81% (−32.74%) | −0.77% (−84.80%) | 8.60% (−50.76%) |
| 12 months (main) | 10.33% (−54.16%) | 19.79% (−41.33%) | −1.97% (−85.35%) | 5.08% (−43.22%) |
| Held while signal lasts | 12.25% (−72.89%) | 18.78% (−75.90%) | −6.71% (−90.13%) | 8.84% (−71.97%) |
Without the Covid-era entries, the organic arm rises meaningfully in three of the four holding periods — up to 19.79%-36.14% a year — but slips slightly in the "held while signal lasts" version, from 26.03% down to 18.78%, because some of the 2021/22 positions were among the ones that happened to sell quickly and cushion that mode's drawdown. Maximum drawdowns improve substantially for the fixed holding periods (3 months: −54.8% to −33.6%), but actually worsen for "held while signal lasts" (−53.7% to −75.9%) — a sign that the Covid cohort absorbed some risk the rest of the record still carries. The underlying pattern holds in both versions: organic beats the market, acquired trails it or loses money.
Two companies that show the rules hold up
Two individual cases from checking the raw data show that both the point-in-time logic and the organic classification work the way they're supposed to — not just on average, but traceably in specific instances.
Nvidia first fires the main signal in May 2024 and stays in signal without a gap through July 2026 — 27 signal-months in total. Its first window shows quarterly revenue jumping from $5,931 million to $26,044 million, a 4.39x increase. The most recent required quarter had been filed on May 29, 2024; the buy date fell on May 31, 2024 — no informational edge an investor at the time wouldn't have had. The classification stays "organic" throughout — correctly so, since Nvidia's growth in this period came from underlying chip demand, not acquisitions.
Super Micro Computer illustrates the opposite lesson: a company with spectacular revenue growth that never triggers the strict main signal f7_x2.0 at all — only the looser year-over-year variant fires on it. The reason: its quarterly revenue repeatedly broke the required unbroken chain of increases, for instance from Q4 2022 to Q1 2023 ($1,803 million down to $1,283 million). A genuine five-quarter run from Q3 2023 to Q3 2024, with a 2.80x increase, existed on paper — but was never actually observable on any monthly test date, because the company didn't file Q2 through Q4 2024 until it reported all three together on February 25, 2025, and Q4 on its own was actually a decline. A backtest without a strict point-in-time rule would have shown this "phantom hit"; ours specifically prevents it.
How sensitive is the organic threshold?
The 5%-acquisitions and 20%-goodwill thresholds are a deliberate choice, not a law of nature. We ran nine combinations of three acquisition thresholds (2%, 5%, 10%) and three goodwill thresholds (10%, 20%, 50%), each at a 6-month holding period:
| Acquisition threshold | Goodwill threshold | B — organic p.a. | C — acquired p.a. |
|---|---|---|---|
| 2% | 10% | 25.63% | −4.86% |
| 2% | 20% | 24.73% | −1.94% |
| 2% | 50% | 24.28% | −3.90% |
| 5% | 10% | 26.40% | −7.13% |
| 5% (main) | 20% (main) | 25.23% | −5.28% |
| 5% | 50% | 24.76% | −7.26% |
| 10% | 10% | 25.42% | −8.77% |
| 10% | 20% | 24.01% | −6.19% |
| 10% | 50% | 23.63% | −9.82% |
Across all nine combinations, the organic arm stays between 23.63% and 26.40% a year — a range under 3 percentage points. The acquired arm stays negative in every single combination, between −1.94% and −9.82%. The result doesn't hinge on the exact choice of either threshold — the line between organic and acquired growth lands on the same finding under every plausible variant we tested.
Honest limits of this study
Four caveats belong in any honest read of these numbers, independent of everything above.
The Covid base effect isn't confined to 2022. Even though the robustness run excluding 2021 and 2022 confirms the underlying pattern, 2022 with its multiple of the usual signal-month count remains a methodologically awkward year, in which "hypergrowth" partly just means "back to pre-Covid revenue."
The price data has a gap at younger IPOs. Of 48,941 "Common Stock" entries in the US ticker lists, only 11,250 have a usable price file at all — part of that gap is misclassified warrants and units, but a real shortfall remains; the dataset actually used for the study holds 10,246 tickers with a price file. Notable 2020 and 2021 IPOs are missing entirely, including Upstart, Coinbase and SoFi; younger IPO vintages are underrepresented overall. Present, by contrast, are names like Roblox, Airbnb, DoorDash, Rivian, Lucid, Palantir, Robinhood, Unity and Cloudflare. The universe is an incomplete, non-randomly distributed sample of the US main exchanges — one that, if anything, tends to understate rather than flatter the result, since it's specifically the younger growth names that are missing.
Not every company with an SEC identifier has a usable quarterly series. 85.5% of tickers with price data have a matched SEC filer identifier (CIK) at all; of those, 79.3% have a quarterly revenue series usable for this signal. Coverage also grew over time, from roughly 34% in 2013 to 66.5% in 2026 — the earlier years of the study sit on a thinner data base than the more recent ones.
Few names a month, US market only, no taxes. Positions break down like this across the full period at the main holding rule:
| Arm | Positions | Months with an open position (of 163) |
|---|---|---|
| A — all hits | 673 | 162 |
| B — organically grown | 336 | 162 |
| C — acquired growth | 123 | 159 |
| U — not classifiable | 214 | 162 |
336 positions over 13.6 years in the organic arm works out to a little over two new buy signals a month on average, with some months producing none at all. That's a narrow book with real concentration risk, not a broadly diversified fund — a single unusually strong or weak position carries noticeably more weight here than it would in a hundred-stock portfolio. The study also covers US stocks only, prices in 0.1% cost on every buy and every sell, and models no taxes, no spread, and no market impact from the study's own hypothetical buying — assumptions that are more forgiving for a single portfolio in practice than they would be for an institutional-scale replication.
How this backtest was built
Universe. US stocks with a price file in the market-data base, active and delisted names together — without the delisted names, this would be a survivorship-biased study. A purchase only happens when the raw price on the entry date is at least $1; a later reverse split can't retroactively make an old penny stock investable.
Signal. Seven consecutive quarters of revenue rising against the prior quarter, ending at least double the starting quarter's revenue (main signal f7_x2.0). Five secondary variants (shorter/longer windows, different growth thresholds, year-over-year comparison) support the headline finding but aren't examined in detail in this study.
Organic classification. Three-way, from SEC filings (annual and quarterly reports, 10-K/10-Q): acquired if acquisition spending in the window exceeds 5% of the window's total revenue, or if goodwill growth exceeds 20% of annualized revenue growth; otherwise organic; unknown without sufficient filing data to judge.
Point-in-time. A signal is generated exclusively from quarterly figures that had already been filed with regulators by the relevant monthly test date. Without this rule, the backtest would have systematically bought early, using information no real investor had at the time.
Holding period and weighting. Four variants: fixed 3-, 6- and 12-month holds, plus "held while the signal lasts" (sold the month the signal first stops firing). Equal-weighted with monthly rebalancing; a month with no open position counts as a zero return. A position is only opened on a growth episode's first signal — no adding to an already-open position.
Costs and delisting. A flat 0.1% order fee on every buy and every sell, already built into the prices used. If a stock's price series ends before the study period does, the position is force-sold at the last available monthly price; a second, harsher track counts the same case as a total loss (−100%) instead — both tracks are reported.
Benchmarks. The S&P 500 Total Return Index (an inherited index series) and an equal-weighted universe of every stock with a price in the prior month, trimmed by the most extreme 1% at each end every month — an untrimmed control series showed that a handful of broken price rows in the data (placeholder values, bad price adjustments) would otherwise generate monthly returns in the millions of percent and make any comparison useless.
Sources. SEC EDGAR XBRL company facts for revenue, acquisition spending and goodwill from filed annual and quarterly reports (10-K/10-Q); historical price data, consolidated to monthly closing prices; US ticker lists from the market-data base, active and delisted names together. Data as of August 7, 2026.
What does not follow from this study
Organically grown hypergrowth companies beating the market across 13.6 years, in every holding period tested, doesn't mean the next 13.6 years will look the same, and it doesn't mean any single scanner hit today is promising that same return. The brutal drawdowns — up to −94% in the acquired arm, up to −55% even in the organic arm — show that holding this strategy at the portfolio level would have been hard to stomach regardless of how good the average number looks in hindsight. The gap in the price data around younger IPOs also means that some of the newest, potentially most relevant growth companies are simply missing from the universe.
This study joins our own series of whole-universe stock backtests — including a retest of Joel Greenblatt's Magic Formula, which showed how a mechanical buy rule would have performed across 26.6 years. We've also examined several of the individual companies named here in depth; the full collection lives in our stock analyses.
This article is a historical analysis and not investment advice. It contains no buy or sell recommendation, no price target, and no forecast; individual companies named in it serve solely to illustrate historical revenue and price patterns and the coverage limits of the data set. Anyone making investment decisions should assess their own situation and risks — with professional advice where appropriate.
Frequently Asked Questions
The platform's live "Triple-Digit Revenue Growth" scanner: a buy signal fires when a company's quarterly revenue has risen for seven consecutive quarters against the prior quarter and has at least doubled across that window. We retested this signal on the entire US stock market from January 2013 through July 2026, using only the quarterly figures already filed with regulators by each monthly test date, and including every company that has since delisted.
Using the figures actually reported in each company's SEC filings (annual and quarterly reports, 10-K/10-Q) across the seven-quarter window: a hit is classified as acquired if acquisition spending exceeds 5% of the window's total revenue, or if goodwill growth exceeds 20% of annualized revenue growth. Otherwise it's classified as organic — unless the filings don't contain enough information to judge, in which case it's "unknown" and is never counted as organic.
Within the test period, yes: in every one of the four holding periods tested, often by a wide margin — 18.13% a year at a 12-month holding period, up to 31.83% at three months, against 15.02% for the S&P 500 Total Return Index over the same span. The drawback is a deeper drawdown too — between −52.1% and −55.0%, against −23.9% for the index.
2022 produced 1,446 signal-months across 279 companies — several times more than any other year in the study (177 to 627 signal-months). The cause is a base effect: 80.6% of these signals had their seven-quarter window start during the 2020 lockdown trough, so they mostly measure a recovery back to pre-Covid revenue levels rather than genuine hypergrowth — documented on Chevron (3.57x), Delta Air Lines (6.45x) and MGM Resorts (10.5x). A robustness run excluding all 2021 and 2022 entries is included; in that version the organic arm rises to 19.8%-36.1% a year in three of the four holding periods — only in the "held while signal lasts" period does it fall, from 26.0% to 18.8%.
Very robust. Nine different combinations of the acquisition-spending and goodwill thresholds (2% to 10% for acquisitions, 10% to 50% for goodwill) return between 23.63% and 26.40% a year for the organic arm — a range under 3 percentage points. Even when every delisting is counted as a total loss instead of an exit at the last tradable price, the organic arm still clears the S&P 500 in every holding period.
No. This is a historical backtest of a fixed rule over 13.6 years, on a universe with documented gaps — not a recommendation for any stock today. It contains no buy or sell recommendation and no forecast for any company currently trading. Anyone making investment decisions should assess their own situation and risks, with professional advice where appropriate.


