The Magic Formula, Retested: 14.48% a Year Since 2000 — Behind the Market Since 2010
We ran Greenblatt's original Magic Formula — earnings yield plus return on capital, top 30, equal-weighted — through a survivorship-free backtest of 22,871 US stocks since 2000, 72 percent of them no longer listed. The formula returned 14.48% a year against 8.28% for the S&P 500 Total Return Index, turning $100,000 into roughly $3.64 million. Almost the entire edge, though, comes from a single decade: since 2010 the formula has trailed both the index and the market it was drawn from.
 Thomas Mücke
Founder & Publisher
Thomas Mücke
Founder & Publisher
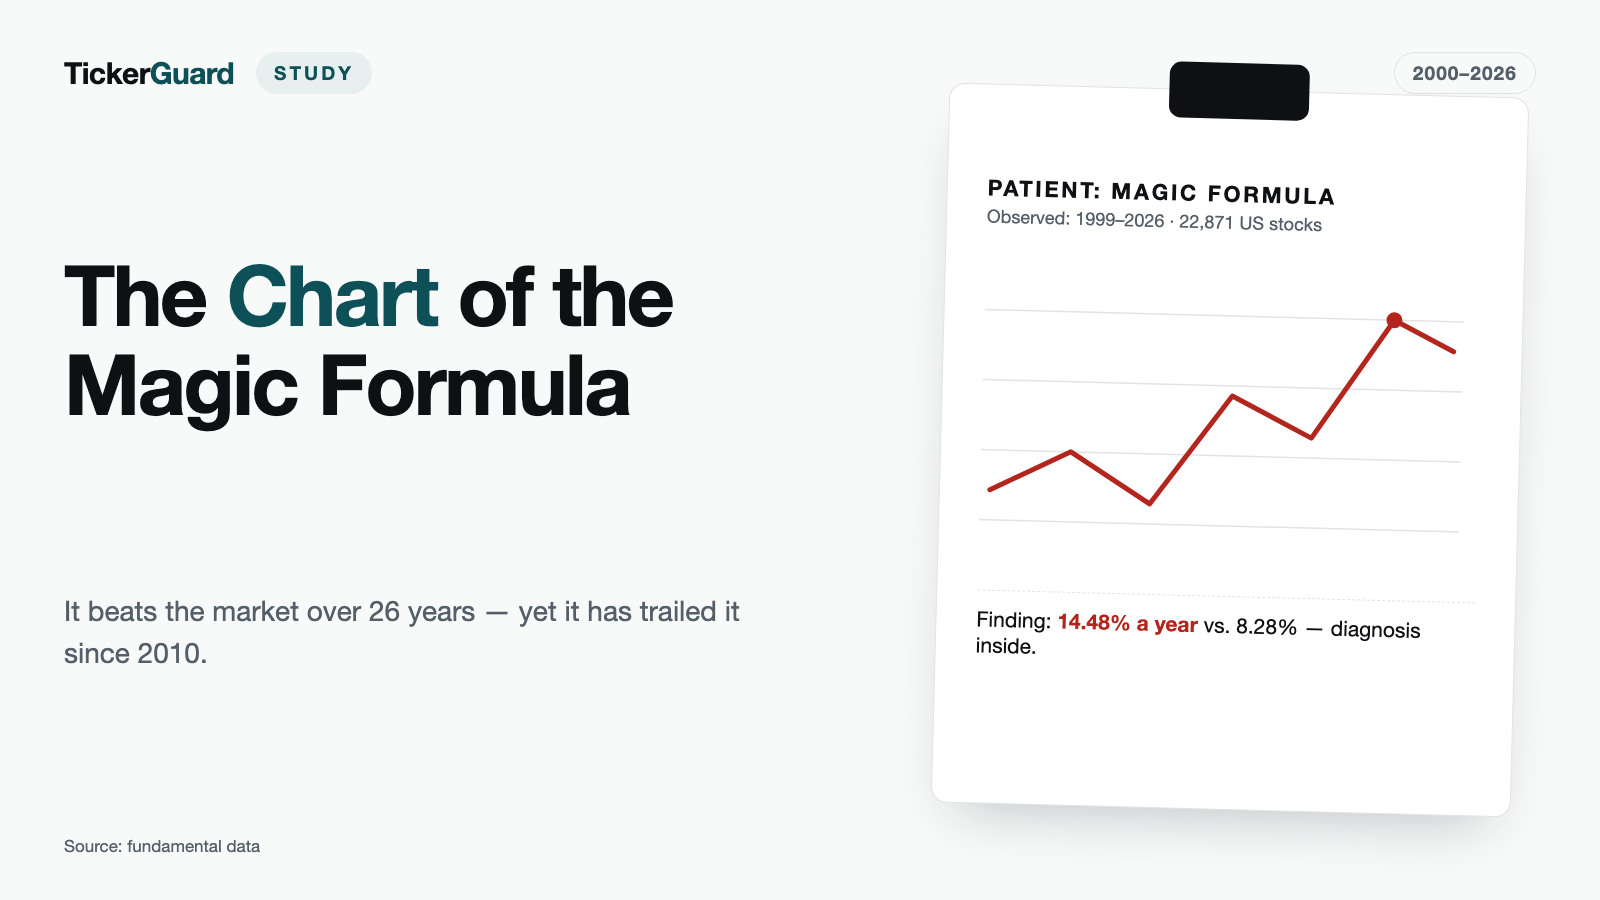
Retested on the full US stock market since 2000, Joel Greenblatt's Magic Formula returned 14.48% a year — against 8.28% for the S&P 500 Total Return Index. Run the two side by side for 26.6 years and $100,000 becomes about $3.64 million with the formula, versus $829,000 for the index alone.
The test is built to be hard to game: 22,871 US common stocks from 2000 through July 2026, of which 16,472 — 72% — are no longer listed. Point-in-time annual statements, no look-ahead, and every delisting counted as an exit at the last tradable price rather than dropped from the sample. The formula itself is Greenblatt's original: rank each stock by earnings yield and return on capital, buy the cheapest 30 by combined rank, hold a year, rebalance annually.
The uncomfortable part comes when the 26.6 years are split in two. Almost the entire advantage over the market was earned between 2000 and 2009 — a decade when the S&P 500 itself lost money. Since 2010, the formula has made 10.49% a year against 14.26% for the index: it has been behind the market it was supposed to beat, in eleven of the last sixteen calendar years.
The result in four numbers
Does Joel Greenblatt's Magic Formula hold up to what the book promises? We retested the original recipe from 2000 through July 2026 on a survivorship-free universe of 22,871 US stocks. Four numbers carry the result:
- 14.48% a year is what the original Magic Formula returned over the full period — the equal-weighted universe with no selection at all already returned 13.20%, so the ranking itself added only about 1.3 percentage points.
- 8.28% is what the S&P 500 returned with dividends over the same window — the formula clearly beat it.
- 30.8% a year is Greenblatt's own published book figure (1988–2004) — the rebuild falls well short of it, though 14.48% sits squarely inside the independent replication range.
- 10.49% a year is what the formula returned since 2010, against 14.26% for the S&P 500. The entire lifetime edge was earned between 2000 and 2009 (21.40% against −0.95% for the index); since 2010 the formula has trailed the market.
Over the tested window, the original recipe beat the market overall, fell well short of Greenblatt's published book figure, and has trailed the S&P 500 since 2010.
The original recipe, and what Greenblatt actually published
Greenblatt's Magic Formula, first published in The Little Book That Beats the Market (2005), ranks stocks on two measures and buys the stocks that score well on both at once.
- Earnings yield = EBIT / Enterprise Value — how cheap the business is, priced off operating earnings rather than net income, and against the whole capital structure rather than just the equity.
- Return on capital = EBIT / (net working capital + net fixed assets) — how much operating profit the business generates per dollar of capital actually employed in it.
Each stock is ranked separately on both measures; the two ranks are added together, and the 30 stocks with the lowest combined rank — the cheapest, highest-quality names — are bought in equal size, held for a year, and rotated into the next year's top 30. Greenblatt applied it to US stocks above $50 million in market value.
The numbers Greenblatt published for that recipe are the reason the formula became famous:
| Period | Universe | Result | vs. S&P 500 |
|---|---|---|---|
| 1988–2004 (2005 book) | >$50 million, top 30 | 30.8% a year | 12.4% a year |
| 1988–2004 | largest 1,000 (>~$1 billion) | 22.9% a year | — |
| 1988–2004 | largest 2,500 | 23.7% a year | — |
| 1988–2009 (2010 edition) | >$50 million | 23.8% a year | 9.5% a year |
| 1988–2009 | >$1 billion | 19.7% a year | — |
Greenblatt's own backtest ran on Compustat's point-in-time database, was survivorship-free and excluded costs and taxes; rolling three-year windows beat the market about 95% of the time. No one outside his firm has reproduced the 30.8% figure since — which is the question this backtest sets out to answer directly rather than by citation.
The headline result: 14.48% a year, $100,000 turning into $3.64 million
Running the original recipe on the survivorship-free US universe from December 31, 1999 through July 31, 2026 — 320 month-end dates, averaged across 12 monthly-staggered starting cohorts to remove single-date luck — produces this:
| Portfolio | Return p.a. | $100,000 becomes |
|---|---|---|
| Magic Formula (original recipe) | 14.48% | ~$3.64 million |
| Equal-weighted investable universe (no ranking) | 13.20% | ~$2.70 million |
| S&P 500 Total Return Index | 8.28% | ~$829,000 |
Along the way the strategy carried 18.86% annualized volatility and a maximum drawdown of −44.92%, bottoming out in February 2009. 2001 was the best year, up 49.55%; 2008 the worst, down 26.77%. It beat the S&P 500 Total Return Index in 16 of 26 calendar years (61.5%). Costs — 0.2% on every buy and every sell — cut 0.45 percentage points a year off the return; without them the formula made 14.93%.
Of 9,600 total positions taken, 9,248 closed before the end of the test and 352 remained open; 138 of the closed positions, 1.49%, exited through a delisting rather than a sale. Looked at trade by trade rather than as a compounded curve, the picture is noisier: the average closed position gained 17.94% before costs, the median gained a more modest 8.93%, and 58.6% of trades made money at all. The single best trade was Inhibrx Biosciences, up 947.9% between April 2025 and April 2026; the worst lost 99.4%, and only 0.37% of all trades lost more than 90%.
The uncomfortable part: what happened after 2009
Split the test in two and the headline number stops telling the whole story.
| Period | Magic Formula | S&P 500 TR | Equal-weighted universe |
|---|---|---|---|
| 2000–2009 | 21.40% | −0.95% | 14.99% |
| 2010–2026 (through July) | 10.49% | 14.26% | 12.13% |
| Full period | 14.48% | 8.28% | 13.20% |
Almost the entire lifetime advantage was earned in the S&P 500's "lost decade," when the index itself lost money and almost anything equity-shaped beat it. Since 2010, the Magic Formula has made 10.49% a year against 14.26% for the index — about 3.8 percentage points a year behind the market, and also behind the 12.13% an investor would have made just by equal-weighting the same universe without any ranking at all. Since 2011, the formula has trailed the S&P 500 in 11 of the last 16 calendar years.
The year-by-year record makes the pattern visible rather than asserted:
| Year | Magic Formula | S&P 500 TR | Difference (pp) |
|---|---|---|---|
| 2000 | +20.54% | −9.10% | +29.6 |
| 2001 | +49.55% | −11.89% | +61.4 |
| 2002 | +6.20% | −22.10% | +28.3 |
| 2003 | +48.24% | +28.68% | +19.6 |
| 2004 | +34.18% | +10.88% | +23.3 |
| 2005 | +8.02% | +4.91% | +3.1 |
| 2006 | +38.36% | +15.79% | +22.6 |
| 2007 | +13.73% | +5.49% | +8.2 |
| 2008 | −26.77% | −37.00% | +10.2 |
| 2009 | +46.68% | +26.46% | +20.2 |
| 2010 | +30.02% | +15.06% | +15.0 |
| 2011 | −5.81% | +2.11% | −7.9 |
| 2012 | +10.49% | +16.00% | −5.5 |
| 2013 | +39.65% | +32.39% | +7.3 |
| 2014 | +11.62% | +13.69% | −2.1 |
| 2015 | −7.95% | +1.38% | −9.3 |
| 2016 | +16.63% | +11.96% | +4.7 |
| 2017 | +28.26% | +21.83% | +6.4 |
| 2018 | −15.26% | −4.38% | −10.9 |
| 2019 | +25.46% | +31.49% | −6.0 |
| 2020 | +27.50% | +18.40% | +9.1 |
| 2021 | +18.82% | +28.71% | −9.9 |
| 2022 | −24.91% | −18.11% | −6.8 |
| 2023 | +9.22% | +26.29% | −17.1 |
| 2024 | +11.92% | +25.02% | −13.1 |
| 2025 | +27.37% | +17.88% | +9.5 |
| 2026 (through July) | −4.34% | +10.14% | −14.5 |
This matches what the independent replication literature has found for years rather than contradicting it: a 2022 Erasmus University study of the Magic Formula on US data from 1987 to 2021 found statistically significant alpha only through 2009, and none from 2010 to 2021. Our own test, run independently on different data, lands on the same year.
Where the 14.48% really came from
The formula's headline return looks like it comes from picking 30 good stocks out of thousands. Mostly, it doesn't.
Buying the entire investable universe — the same $50 million floor, the same exclusion of financials and utilities, no ranking or selection of any kind, just equal weight across everything that qualifies — returns 13.20% a year on its own. That is most of the 14.48%. The Magic Formula's actual selection — choosing the cheapest, highest-quality 30 rather than holding everything — adds roughly 1.3 percentage points a year on top.
The rest of the advantage over the S&P 500 comes from a structural choice that has nothing to do with ranking: equal-weighting small and mid-sized companies rather than holding a cap-weighted index dominated by its largest members. A separate run using the same recipe but requiring a $1 billion market-cap floor instead of $50 million — the same floor Greenblatt used for his own large-cap variant — returns 12.01% a year, confirming that a meaningful share of the edge sits in the smaller end of the market rather than in the ranking itself.
Splitting the formula: which half pulls the weight
The Magic Formula combines two rankings into one. Running each ranking on its own, through the identical engine and universe, isolates what each half is actually contributing — the standard check every independent replication of this strategy performs.
| Ranking | Return p.a. | Max drawdown | Years ahead of S&P 500 |
|---|---|---|---|
| Earnings yield only (EBIT/EV) | 16.22% | −53.74% | 61.5% |
| Return on capital only | 12.30% | −53.82% | 57.7% |
| Combination (original formula) | 14.48% | −44.92% | 61.5% |
| Live scanner approximation | 10.07% | −47.29% | 53.8% |
Earnings yield alone beats the full combination by 1.74 percentage points a year — the same finding reported by Gray & Carlisle, Montier, and Davydov et al. in essentially every independent replication of this formula outside our own. Adding the return-on-capital ranking costs return here too. What it buys instead is a shallower drawdown: −44.92% for the combination against −53.74% to −53.82% for either measure run alone. Return on capital functions less as a return driver and more as a risk brake.
What happens when the recipe changes
Holding every other rule fixed and changing one parameter at a time shows how sensitive the 14.48% figure is to the choices behind it.
| Parameter changed | Return p.a. | Notes |
|---|---|---|
| Holding period: 6 months | 14.69% | vs. 12 months (main run) |
| Holding period: 12 months | 14.48% | main run |
| Holding period: 24 months | 13.99% | — |
| Fixed stop, −20% | 11.38% | drawdown improves to −28.87% |
| Trailing stop, −25% | 9.61% | drawdown improves to −21.75% |
| Without trading costs | 14.93% | vs. 14.48% with 0.2% per side |
| Market-cap floor $1 billion | 12.01% | drawdown widens to −53.25% |
| Price filter ≥ $1 | 13.91% | — |
| Price filter ≥ $5 | 13.38% | — |
| Worst-case delisting (every exit = total loss) | 12.72% | edge survives even the harshest assumption |
Two findings stand out. Stops reduce the return in every variant tested — a fixed −20% stop and a −25% trailing stop both cost between roughly 3 and 5 percentage points a year — while meaningfully cutting the depth of the drawdowns; whether that trade is worth making depends on an investor's tolerance for a −44.92% peak-to-trough decline, not on the numbers alone. And raising the market-cap floor to $1 billion costs 2.5 percentage points a year, echoing Greenblatt's own finding that his large-cap variant fell from 30.8% to 22.9% — small-company exposure is doing real work in both versions of the test.
The worst-case delisting check matters most for credibility: even assuming every one of the 138 delisted positions was a complete, unrecoverable loss rather than an exit at the last tradable price, the strategy still returns 12.72% a year. The excess return over the S&P 500 does not depend on how delistings are handled.
Screening out the risky ones: does an AI quality verdict help?
The Magic Formula buys whatever looks cheap and profitable. It never asks whether the business behind the numbers is sound. So we ran the obvious counter-test: what if every purchase had been vetted first, and the shaky ones simply left alone? Each buy in the main run received a traffic-light verdict — red for a balance-sheet risk evidenced in the figures, amber for an open question with no clear answer, green for demonstrated stability. An AI issued the verdicts under a strict blind protocol: it saw only the annual accounts already published on the day of purchase, and nothing that happened afterwards. The share price never enters the colour. That produced 1,218 verdicts, one per company and financial year: 755 green (62.0%), 377 amber (31.0%), 86 red (7.1%). Six of them come from an earlier pilot run using the same scale.
The engine then ran three more times — same recipe, same ranking, except that one colour was barred from purchase each time. One rule matters more than any other here: a barred purchase is not replaced. The money simply sits in cash, earning nothing, until the next buying date. Had the next name on the ranking moved up instead, the test would no longer measure the filter but "filter plus substitute" — two changes at once.
| Variant | Return p.a. | Worst drawdown | Volatility | Trades | Average cash |
|---|---|---|---|---|---|
| Main run, no filter | 14.48% | −44.92% | 18.86% | 9,248 | 0% |
| No red purchases | 12.52% | −44.36% | 17.60% | 8,579 | 7.8% |
| No amber purchases | 10.42% | −29.91% | 12.89% | 6,307 | 31.3% |
| No green purchases | 7.10% | −21.81% | 9.39% | 3,610 | 59.2% |
Not one colour filter improves the result. Every one of them costs return, in the order you would expect: dropping green hurts most, dropping red hurts least. But even the red filter, which removes just 669 of the 9,248 trades (7.2%), costs roughly two percentage points a year — more than the 7.8% average cash balance alone can account for. All three filtered runs fall below the equal-weighted purchase of the entire universe (13.20%), and the green filter, at 7.10%, falls below the S&P 500 as well (8.28%).
The shrinking drawdowns and volatility are not a selection success. They are arithmetic: if 59% of the money is sitting idle on average, there is less of it left to fall.
Why the filters fail becomes clear once the 9,248 trades actually executed are grouped by the traffic-light verdict in force when each was bought. This is a rear-view decomposition, not a trading system: it says how those trades turned out, not how a portfolio restricted to one colour would have performed.
| Verdict at purchase | Trades | Average return per trade | Median | Share profitable | Share at least halved |
|---|---|---|---|---|---|
| Green | 5,638 | +16.2% | +9.4% | 59.7% | 5.3% |
| Amber | 2,941 | +18.6% | +6.5% | 55.6% | 7.8% |
| Red | 669 | +29.4% | +14.6% | 61.6% | 10.5% |
| All trades | 9,248 | +17.9% | +8.9% | 58.6% | 6.5% |
Exactly one measure ranks the three colours without a gap — and it is the one the traffic light was built for: risk. The share of trades that lost at least half their value rises from 5.3% for green through 7.8% for amber to 10.5% for red. A red-rated purchase ended in a halving roughly twice as often as a green one. The share of profitable trades, by contrast, does not rank at all: red leads on 61.6%, ahead of green on 59.7%.
On return, the picture inverts entirely. Red-rated purchases averaged +29.4% per trade against +16.2% for green — and not only on the mean, but on the median too. That is the signature of a risk premium: over this test period, carrying an evidenced risk paid on average. Our backtest of Graham's net-net formula produced the same finding on a different strategy and a different universe of stocks.
None of which means buying red-rated stocks on purpose is a good idea. The red group is small and outlier-heavy: the 20 best of its 669 trades carry a quarter of all red gains (25.3%), against 4.5% for green. And a red-only portfolio would barely be buildable — an average of 2.6 red names were available per buying date, none at all on 59 of 316 dates, and not a single red purchase anywhere in 2009. Such a portfolio would be a two- or three-stock concentration whose fate hung on a handful of hits.
Two limitations belong with this finding. First, the verdict rests on the figures in the annual accounts, not on their narrative sections — risks disclosed only in the written parts of an annual report are invisible to it. Second, despite the blind protocol, a residual risk remains that the model recognises a well-known company and lets later knowledge slip in unnoticed.
The practical conclusion is an uncomfortable one: the traffic light works as a warning lamp, not as a return filter. Used as a buy filter it purchases peace of mind — shallower drawdowns, less volatility — and pays for it in return. Most of that calm comes from the money that was never invested, not from better selection. Anyone who wants that trade can get it more cheaply by simply holding a smaller equity allocation.
How this measures up — against Greenblatt, and against everyone else who tried
Against Greenblatt's published 30.8%, 14.48% is a large shortfall. Against the field of independent attempts to reproduce his result, it is squarely typical.
| Study | Universe / period | Result |
|---|---|---|
| Alpha Architect (Wesley Gray) | US large-cap, 30 stocks, annual rebalance | 13.80% CAGR — "nowhere near the 31%" |
| Alpha Architect, liquidity-filtered | US, 1970–2010 | 12.11%, falling to 7.66% with a liquidity filter |
| Gray & Carlisle, Quantitative Value | US, 1964–2011 | 12.79% vs. 9.52% for the S&P 500; earnings yield alone beats the full formula |
| Kreft 2022 (Erasmus University) | US, 1987–2021 | Alpha significant only 1987–2009; none from 2010 to 2021 |
| Reasonable Deviations | US, >$100 million, 2003–2015 | 11.4% vs. 8.7%; a 57% drawdown 2007–2010 |
| Persson & Selander | Nordic markets, 1998–2008 | 14.68% vs. 9.28%; alpha not statistically significant |
| Davydov, Tikkanen & Äijö | Finland, 1991–2013 | 19.26%; earnings yield alone reaches 20.57% |
| Validea live tracking | US, since 2006 | 7.1% vs. 5.0% for its benchmark, as of 2016 |
Wesley Gray, whose Alpha Architect group ran the test on US large caps, summed up his own result bluntly:
"nowhere near the 31%"
— Alpha Architect (Wesley Gray) on his own Magic Formula backtest, which produced a 13.80% CAGR.
And Validea, which has tracked a Magic Formula portfolio live since 2006, drew this conclusion after a decade of real-money results:
"replications largely not successful"
— Validea, reviewing its live Magic Formula tracking portfolio (as of 2016).
Our 14.48% sits comfortably inside the roughly 12%–15% range this body of independent work has converged on, and it reproduces the same post-2010 fade that Kreft's 2022 study documents formally. No outside replication has come anywhere near Greenblatt's own figures.
The literature's consensus explanation for the gap has five parts, and our own results independently confirm each one: a small-cap and illiquidity premium baked into a $50 million floor that is barely tradable at real size (our $1 billion floor run: 12.01%); no trading costs or taxes in Greenblatt's original backtest; a value regime that weakened after roughly 2010 (our own sub-period split); a behavioral hurdle — a −44.92% drawdown and multi-year stretches of underperformance that are easy to abandon in practice even when a strategy is working over decades; and a return-on-capital component that costs return in most tests, ours included, even as it dampens the drawdown.
Our stock scanner runs a different — but honestly labelled — version
Investors sometimes ask how this backtest relates to the Magic Formula scanner running on our platform today. It is not the same strategy, and it says so.
The full double-ranking test in this study needs an earnings-yield and return-on-capital rank for every stock in the universe every month — a lot of moving parts. Greenblatt himself published a simpler version in the book for investors without access to that kind of screener: a return-on-capital threshold above 25%, combined with a P/E floor of 5 to filter out data outliers, no ranking at all. Our stock scanner runs that simplified book version.
We measured it separately, on the same universe and the same rules for everything else — same exclusions, all matching stocks equal-weighted, annual rebalance:
| Version | Return p.a. | Max drawdown |
|---|---|---|
| Live scanner approximation (ROC ≥ 25%, P/E ≥ 5) | 10.07% | −47.29% |
| Full double ranking (this study's main result) | 14.48% | −44.92% |
10.07% a year beats the S&P 500's 8.28%, but it falls well short of the full formula's 14.48%. That gap is the honest cost of trading ranking sophistication for a simpler, screenable rule — not an error in either version.
How this backtest was built
Universe. 22,871 US common stocks tracked from December 1999 through July 2026, of which 16,472 — 72% — have since delisted, been acquired, or gone bankrupt. That is what makes the test survivorship-free: a study built only on stocks still trading today would erase most of the failures and overstate what an investor following the rule would actually have earned. 22,629 of the 22,871 (98.9%) have a usable price series; 13,675 (59.8%) have at least one usable annual statement, since a stock with no reported financials can never be ranked. At the final date used in this study (July 31, 2026), the investable universe stood at 3,882 stocks after excluding 1,345 financials, 561 flagged by the price-quality gate below, 135 utilities and 89 with statements too old to use — and zero excluded for missing sector data, because sector coverage reaches 100% by combining the stored sector classification with a fallback bridge from each company's SIC code.
Recipe. Earnings yield = EBIT / Enterprise Value (market value of equity plus preferred shares plus interest-bearing debt, minus excess cash, without minority interest — an original footnote of Greenblatt's, not a later addition). Return on capital = EBIT / (net working capital + net fixed assets). Every stock is ranked on both measures each month; the 30 with the lowest combined rank are bought in equal size, held for 12 months, and rotated annually. To remove the luck of any single starting date, the main result averages 12 portfolios started on staggered monthly anniversaries rather than reporting one calendar-year test.
Point-in-time. Every ranking uses only the most recent annual statement that had actually been filed by that date — no metric is computed from a report that would not yet have existed at the time. Statements older than 18 months are dropped from the ranking entirely; without that cap, a company that had stopped reporting while its stock kept falling would show an artificially rising, and misleading, earnings yield.
Ten deviations from Greenblatt's original recipe. None of these are hidden; all are listed here because each one moves the result:
- Annual statements rather than trailing-twelve-month figures — a ranking can be up to a year out of date between two filings.
- Excess cash, which Greenblatt's book never defines precisely, is calculated as the cash beyond what is needed to cover current liabilities not already covered by other current assets — the single largest known source of divergence between different attempts to rebuild this formula.
- Sector classification uses each company's current sector even for historical dates; the financials and utilities exclusions (SIC 6000–6999 and 4900–4999) are a replication convention, not a rule Greenblatt published.
- Share counts are held constant between statement dates; 45.4% of market-cap calculations could not be corrected for a stock split that happened between the statement and the reference date.
- The main result averages 12 monthly-staggered annual cohorts rather than a single test date, mirroring Greenblatt's own recommendation to phase into positions gradually.
- Statements older than 18 months are excluded from ranking, as noted above.
- A price-series quality gate (below) removes 9.6% of the investable universe that the original recipe has no mechanism to catch.
- Enterprise value excludes minority interest, matching Greenblatt's own footnote; stocks with zero or negative EBIT cannot be ranked at all, the standard convention across every replication we found.
- Total return is read off the split- and dividend-adjusted closing price; there is no separate dividend-reinvestment calculation.
- No taxes are modeled; trading costs are a flat 0.2% charged on every purchase and every sale.
Data checks. The largest one is a price-series quality gate built specifically for this test. Some ticker symbols are recycled after a company delists, and a handful of those recycled symbols carry two unrelated companies' prices in one unbroken monthly series with no stock split to explain the jump. Measured on the split-and-dividend-adjusted close, we exclude only jumps upward — a monthly move of eightfold or more, or a level permanently raised at least 2.5 times, including cases where the series itself starts abruptly. Downward jumps are deliberately left in the data: spot-checked cases (Axcelis Technologies in October 2008, Amylyx in March 2024) show a real collapse rather than a data error, and removing them would have made the strategy's result look better than it should — exactly the kind of survivorship distortion this study exists to avoid. The gate removes 394 of the 4,117 stocks in the final investable universe (9.6%), and 2,587 of all 22,629 stocks with a price series (11.4%). Greenblatt's original recipe has no equivalent check; this is a data correction, not a strategy rule.
Limits. Share counts that could not be split-adjusted (45.4% of rows) leave some market-cap figures off — too low after a regular split, too high after a reverse split — for stocks whose share count changed after their statement date. Sector history is approximated with each company's current classification rather than a true historical record. And the study, like every backtest, cannot account for the price impact of many investors trying to run the same rule at once — a limit Greenblatt himself has pointed to when explaining why the formula might keep working precisely because it is uncomfortable to hold.
Sources. The fundamental and price data in our research base cover 1.65 million company-months across 320 month-end dates. Greenblatt's published figures come from The Little Book That Beats the Market (2005) and its 2010 revised edition, cross-checked against secondary sources including AAII and StableBread. Independent replication figures are drawn from the original published studies: Gray & Carlisle's Quantitative Value, James Montier's research, Kreft (2022, Erasmus University), Persson & Selander (2009), Davydov, Tikkanen & Äijö (2016), Reasonable Deviations (2020), and Validea's live tracking record. Data as of July 31, 2026.
What does not follow from this study
A 14.48% historical average does not mean the next 26 years will look anything like the last. The formula's entire lifetime edge over the S&P 500 was earned in one specific decade, 2000 to 2009, and the more recent 16 years show it trailing the market it was built to beat in the majority of individual years. Whatever caused that shift — a value regime change, too much money chasing the same handful of cheap stocks, or something else — a backtest cannot tell you whether it will reverse, continue, or intensify.
Nor does the 25%-return-on-capital, P/E-5 scanner running on our platform reproduce this study's 14.48% figure; it is a different, simpler rule that Greenblatt published for a different purpose, and it returns less on the same data (10.07%). Neither number is a forecast for either version going forward.
This is the third in our series of studies that examine entire stock universes rather than individual companies. The first measured 126 U.S. stocks that rose more than elevenfold within five years and what set them apart beforehand; the second read every mandatory regulatory filing behind 792 U.S. bankruptcies since 2005. Both studies, and everything that follows, live in the Studies section.
This article is a historical analysis and not investment advice. It contains no buy or sell recommendation, no price target, and no forecast; individual companies named in it serve solely to illustrate historical price patterns. Anyone making investment decisions should assess their own situation and risks — with professional advice where appropriate.
Frequently Asked Questions
Joel Greenblatt's Magic Formula ranks stocks by two measures — earnings yield (EBIT over enterprise value) and return on capital — and buys the cheapest, highest-quality 30 by combined rank. Retested on 22,871 US stocks since 2000, including 16,472 that no longer trade, it returned 14.48% a year against 8.28% for the S&P 500 Total Return Index.
Greenblatt's 2005 book reported 30.8% a year for 1988–2004, and the 2010 edition reported 23.8% for 1988–2009. Our 14.48% falls well short of both, but it lands squarely inside the roughly 12%–15% range that independent replications have found since — Greenblatt's own numbers have never been reproduced by an outside study.
Split the 26.6 years in two: 2000–2009 delivered 21.40% a year while the S&P 500 lost 0.95% a year, the market's "lost decade." From 2010 through July 2026 the formula made 10.49% while the index made 14.26%. Nearly the entire lifetime edge comes from the first period; the formula has trailed the index in 11 of the last 16 calendar years.
Mostly the latter. An equal-weighted portfolio of the entire investable universe — no ranking at all, same $50 million floor and sector exclusions — returned 13.20% a year on its own. The Magic Formula's ranking added only about 1.3 percentage points on top of what equal-weighting small stocks already delivers.
It means every stock that ever traded is included, not just the ones still listed today. Of the 22,871 US stocks in our data, 72% have since delisted, gone bankrupt or been acquired. Studies built only on today's survivors systematically overstate past returns because they erase the losers.
No. Our stock scanner uses the simplified screener Greenblatt published in the book for investors without an EBIT/EV tool — return on capital above 25% and a P/E of at least 5, with every match equal-weighted rather than ranked into a top 30. Measured on its own, that version returned 10.07% a year, ahead of the S&P 500 but clearly behind the full double ranking.
Not in this backtest. An AI verdict drawn only from the annual accounts available at the time (red/amber/green) measures risk correctly: red-rated purchases ended in a halving twice as often as green ones (10.5% against 5.3%). As a buy filter, though, every colour costs return — barring red purchases gives 12.52% a year instead of 14.48%, barring amber 10.42%, barring green 7.10%. Red-rated purchases even returned the most per trade (+29.4% against +16.2% for green), which reads as a risk premium.
No. This is a historical backtest of a mechanical rule over 26.6 years, not a recommendation for any stock today. It shows what a rules-based ranking would have returned in the past, including a 44.92% peak-to-trough decline and a decade of underperformance — not what any company will do next. This is not investment advice.


