The Ten-Baggers: 126 U.S. stocks that rose elevenfold — and what they had in common beforehand
We ran the numbers on 50,545 U.S. stocks across 14 years of trading — including the 32,371 that no longer exist. 126 of them rose more than elevenfold within five years or less. The surprise is not who made it, but what those companies looked like beforehand: small, cheaply valued and mostly loss-making. Only one in four earned money at the starting point — in the control group it was nearly two out of three. And the other half of the truth: every second ten-bagger later gave back more than half of the gain.
 Thomas Mücke
Founder & Publisher
Thomas Mücke
Founder & Publisher
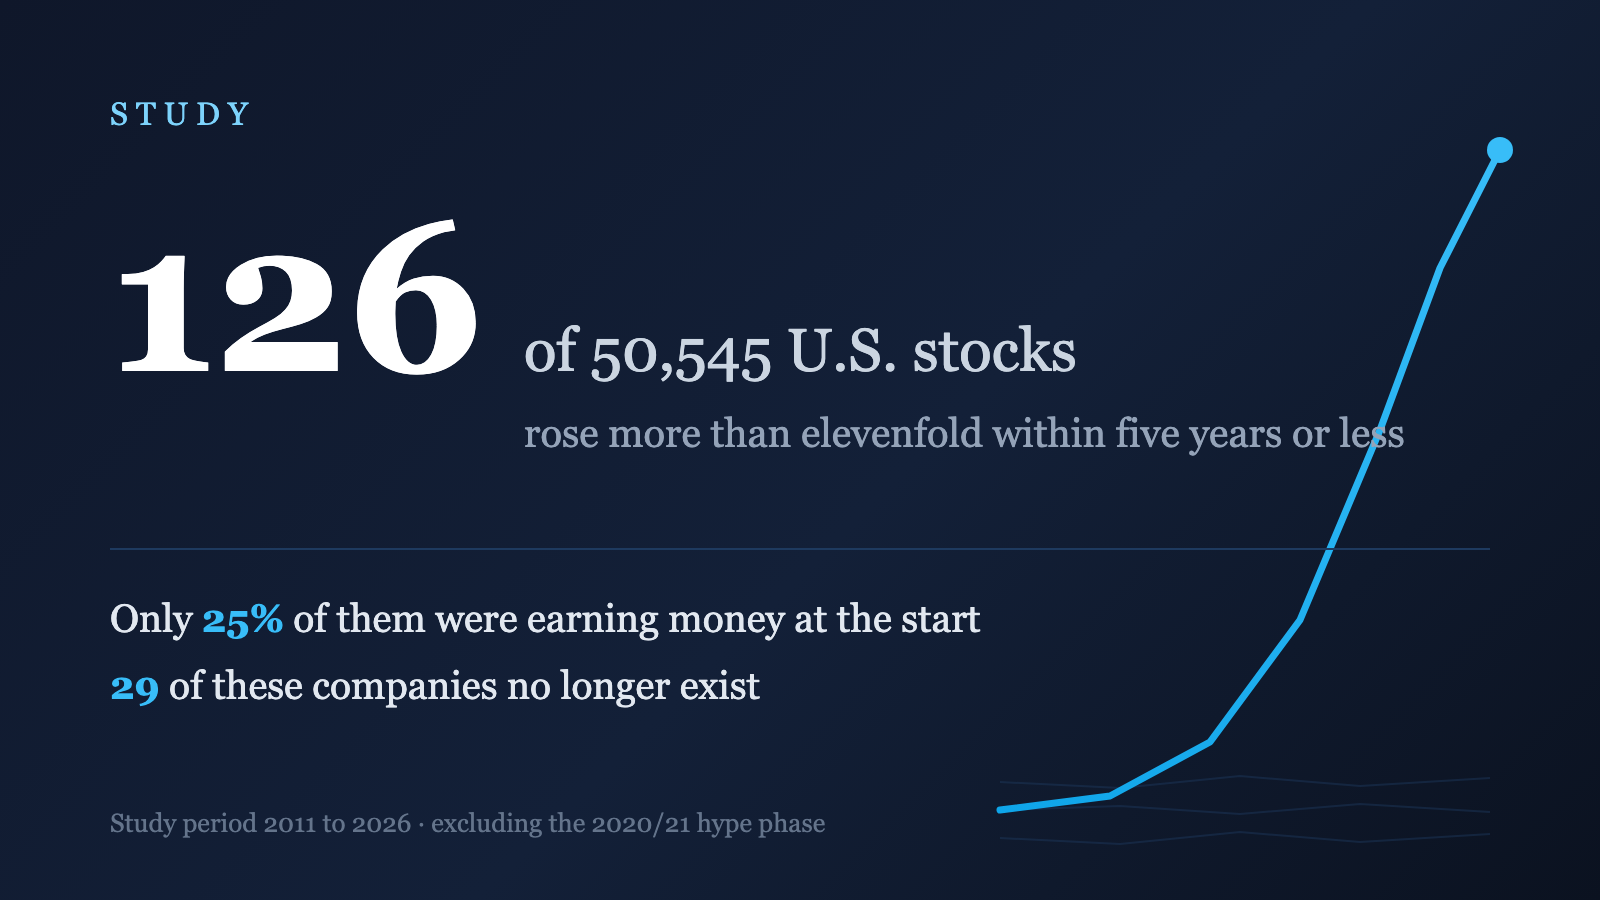
126 out of 50,545 U.S. stocks examined rose more than elevenfold within five years or less between 2011 and 2026. That is three in a thousand titles with a usable price history. We ran the calculation across every single U.S. common stock traded in that period — including the 32,371 that no longer exist.
The result runs against expectation. At the starting point, the later winners were not the dynamic growth companies you might assume. They were small, cheaply valued and loss-making three times out of four. In a control group of 444 comparably tradable stocks that never made it, 63 percent were earning money.
And the uncomfortable half of the truth: among the ten-baggers whose price can be tracked past their peak, every second one later gave back more than half of the gain. Fourteen were never traded again after their high.
The result in four numbers
How rare is an elevenfold rise, really, and what set the later winners apart from the rest beforehand? Four numbers carry the result:
- 126 of 50,545 U.S. stocks examined rose elevenfold between 2011 and 2026 within five years or less — measured against the 44,211 titles with a usable price history, a hit rate of 0.3 percent, three in a thousand.
- 25 percent of the later ten-baggers were profitable at the starting point — in the control group it was 63 percent. Most winners started out in the red.
- $215 million was the median market value of the ten-baggers at the starting point — against $1,123 million in the control group, barely a fifth.
- 49.4 percent was the median drawdown after the peak — 55 of the 112 titles with a subsequent history, almost exactly half, gave back more than half of the gain.
Across the tested period from 2011 to 2026, the 126 ten-baggers were mostly small and loss-making at the starting point, and the majority of them gave back a large share of the rise after the peak.
Who made it — and how rare that is
The starting point was the complete universe of U.S. common stocks: 18,174 currently listed and 32,371 vanished titles. For 44,211 of them a usable price history was available. Within that history we searched for every window of 60 months or less in which the split- and dividend-adjusted price rose at least elevenfold.
Arithmetically there were 11,741 such windows. Most of them are worthless: 10,349 belong to stocks trading at a dollar or less at the starting point — micro caps that jumped from $0.003 to $0.05. Arithmetically an elevenfold rise, practically untradable. That group alone accounts for 88 percent of all apparent ten-baggers and would dominate any unfiltered study.
After removing them and applying every further check, 126 hits remain. At the starting point each had to clear four hurdles: listed on Nasdaq, NYSE or NYSE American, priced above one dollar, worth more than $50 million and turning over more than $100,000 a day.
| Stage | Count |
|---|---|
| U.S. common stocks in the universe | 50,545 |
| of those with usable price history | 44,211 |
| windows with an elevenfold rise in five years or less | 11,741 |
| of those with a starting price above one dollar | 1,392 |
| after all tradability and data checks | 126 |
29 of these 126 companies no longer exist — they were acquired, went bankrupt or dropped off the tape. That is almost a quarter. Anyone running this kind of study on currently tradable stocks alone misses every one of them.
The median advance across the 126 hits is 15.7-fold, the median duration 36 months. 92 of the titles were listed on Nasdaq, 34 on the NYSE.
What the winners had in common at the starting point
This is the core of the study. Judging what set the ten-baggers apart requires a yardstick. So we drew a random sample of stocks that clear the same tradability hurdles but never achieved an elevenfold rise. Fundamentals from SEC annual reports are available for 444 of them and for 107 of the hits.
| Metric | Ten-baggers (107) | Control group (444) |
|---|---|---|
| Market value | $215 million | $1,123 million |
| Price-to-sales ratio | 1.67 | 1.91 |
| Revenue growth | 11.2% | 12.5% |
| Debt-to-equity | 0.91 | 1.26 |
| Share of profitable companies | 25% | 63% |
Three findings stand out.
First, size. At the starting point the later winners were worth a median $215 million — barely a fifth of the control group. Unsurprising, but it narrows the field: anyone hunting for an elevenfold rise is hunting almost exclusively among small caps.
Second, absent profits. Only a quarter of the later ten-baggers were earning money at the starting point. In the control group it was nearly two out of three. That inverts the usual assumption: the largest advances mostly began at companies in the red — biotechs before approval, turnaround cases, businesses the market expected little from.
Third, no growth edge. On revenue growth the two groups are practically identical: 11.2 against 12.5 percent. The ten-baggers were not growing faster beforehand. What set them apart was not a visible growth advantage but an event still to come.
What happened next
Most compilations leave this part out. For all 126 hits we tracked the price after the peak — through to today or to the last trading day.
| Share of the peak level retained | Count | Percent |
|---|---|---|
| above 100 percent — rose further | 16 | 14% |
| 50 to 100 percent | 64 | 57% |
| 10 to 50 percent | 23 | 21% |
| below 10 percent | 9 | 8% |
55 of the 112 titles — almost exactly half — at some point fell more than 50 percent from their high; the table above, by contrast, shows where prices stand today. The median drawdown is 49.4 percent. Another 14 titles do not appear in this calculation at all because they were never traded again after their peak: they were acquired or vanished from the market.
Put differently: catching an elevenfold rise is one thing, keeping it is another. Only 16 of the 126 companies trade higher today than at their peak back then.
What triggered the rise
For each of the 126 cases we researched individually what set the advance in motion. The results fall into seven patterns.
| Trigger | Cases | Example |
|---|---|---|
| Structural demand shift | 42 | AXT — base material for optical modules in AI data centers |
| Approval or trial success | 36 | Anacor — phase 3 data for an atopic dermatitis ointment |
| Turnaround | 22 | Sezzle — from loss-maker to profitable installment lender |
| Other | 9 | China Biologic — years of growth in blood plasma products |
| Commodity price | 8 | Hycroft Mining — gold and silver prices make old reserves viable |
| Takeover | 5 | Dyax — Shire pays $37.30 per share in cash |
| Speculative frenzy | 4 | Zhong Yang Financial — over 600 percent in a single day without news |
The most common pattern is not a stroke of managerial genius but a demand shift from outside: the build-out of AI data centers repriced suppliers of power, cooling, cabling and semiconductor materials within a few years. 42 of the 126 cases follow this pattern, the vast majority of them from 2022 onward.
How concretely that demand shift lands in the financial statements shows in two sentences from original SEC filings. Sterling Infrastructure, up fortyfold in the study period, writes in its first-quarter 2026 report:
"The recently acquired CEC business contributed $156.1 million to revenue in the quarter."
Source: Sterling Infrastructure, Q1 2026 quarterly report (SEC)
And chip supplier Credo Technology, up 33-fold over the same period, on group revenue in its fiscal 2026 annual report:
"more than tripled to $1.3 billion"
Source: Credo Technology Group, Form 10-K for fiscal year 2026 (SEC), announcement of June 1, 2026
The second most common pattern is the binary approval decision in medicine. 36 cases trace back to a trial result or a market approval — events that can multiply a company's value in a single day. That also explains the high share of loss-making firms: a biotech company before approval has no earnings by definition.
Five cases that show the patterns
Sezzle Inc. — 119.5-fold in 20 months
The buy-now-pay-later provider Sezzle swung from losses to high profits while growing very fast at the same time: revenue reached $98.2 million in Q4 2024 (doubling year over year) and $116.8 million in Q3 2025 (+67%) with about $27 million in profit, topping $1 billion in quarterly merchandise volume for the first time. Before that, the stock had drawn almost no attention following its move from the Australian exchange to Nasdaq in 2023. Where this company stands today is covered in our full analysis of Sezzle Inc..
Period 2023-10 to 2025-06. Market value at the starting point $51 million, still listed. Source: Sezzle Q4 2024 results (earnings call, February 2025) and Q3 2025 results (media reports, 2025); Sezzle press release of March 10, 2025 on the 6:1 stock split (GlobeNewswire)
AXT Inc — 73.7-fold in 13 months
AXT makes indium phosphide substrates, the base material for the optical transmit-and-receive modules used in AI data centers. Demand exploded: AXT is doubling capacity in 2026 and doubling it again in 2027, raised $632.5 million in fresh capital to fund it, and reported record order backlogs, while Chinese export controls further tightened supply.
Period 2025-04 to 2026-05. Market value at the starting point $64 million, still listed. Source: Media reports of May 4, 2026 (AXT doubles indium phosphide capacity for AI data centers; Q1 2026 revenue of $26.9 million, up from $19.4 million; $632.5 million capital raise); media reports 2026 on the stock's 345.7% year-to-date gain
Dyax Corp — 30.5-fold in 52 months
On November 2, 2015, the Irish pharmaceutical group Shire announced the acquisition of Dyax for $37.30 per share in cash (about $5.9 billion, plus $4 per share upon later approval of the lead drug); the deal closed on January 22, 2016. The driver was DX-2930 (later Takhzyro), a treatment for hereditary angioedema that showed a more than 90% reduction in attacks in the Phase 1b trial.
Period 2011-09 to 2016-01. Market value at the starting point $124 million, no longer listed. Source: Shire press releases of November 2, 2015 (acquisition offer) and January 22, 2016 (deal closing); Dyax Form 10-K annual report 2011 filed with the SEC (quarterly price ranges)
Viking Therapeutics Inc — 36.9-fold in 22 months
On February 27, 2024, Viking Therapeutics released the results of the Phase 2 VENTURE trial for its weight-loss drug VK2735 (a dual GLP-1/GIP agonist): up to 14.7% weight loss within 13 weeks. The stock jumped 121% in a single trading day, as the company was suddenly seen as a serious challenger to Novo Nordisk and Eli Lilly in the weight-loss market.
Period 2022-05 to 2024-03. Market value at the starting point $172 million, still listed. Source: Viking Therapeutics press release of February 27, 2024 (Phase 2 VENTURE topline results); CNBC, February 27, 2024 ("stock jumps 120 % after positive weight loss drug trial results")
Hycroft Mining Holding Corporation — 26.8-fold in 24 months
Silver and gold prices exploded (silver up about 130% in 2025 to over $69 an ounce, gold up 65% and setting records above $5,500 an ounce in early 2026), which suddenly made the company's huge Nevada ore reserves — previously considered uneconomic — attractive. On top of that came the highest silver grades ever measured from the Vortex system in December 2025 (the stock jumped about 50% in a single day), a 55% higher gold resource and 56% higher silver resource in January/February 2026, and a debt-free balance sheet after repaying $125.5 million in October 2025.
Period 2024-02 to 2026-02. Market value at the starting point $380 million, still listed. Source: Hycroft press releases "Hycroft Delivers 55% Growth in Mineral Resources" (technical report dated January 21, 2026) and Form 10-K filing, March 2026; media reports of December 22, 2025 on the Vortex drilling results; CNBC, January 2026, on the gold price
All 126 ten-baggers at a glance
Sorted by advance. The factor refers to split- and dividend-adjusted month-end prices. "Retained" gives today's price relative to the peak of the window; a dash means the stock was never traded again afterwards.
| Ticker | Company | Factor | Period | Months | Market value at start | Trigger | Retained | Status |
|---|---|---|---|---|---|---|---|---|
| SEZL | Sezzle Inc. | 119.5× | 2023-10 to 2025-06 | 20 | $51M | Turnaround | 86% | listed |
| AXTI | AXT Inc | 73.7× | 2025-04 to 2026-05 | 13 | $64M | Demand shift | 46% | listed |
| POWL | Powell Industries Inc | 47.2× | 2022-04 to 2026-06 | 50 | $227M | Demand shift | 81% | listed |
| ANAC | Anacor Pharmaceuticals Ltd. | 42.8× | 2013-02 to 2015-07 | 29 | $124M | Approval or trial success | 66% | gone |
| AXSM | Axsome Therapeutics Inc | 42.2× | 2018-03 to 2019-12 | 21 | $62M | Approval or trial success | 233% | listed |
| VRT | Vertiv Holdings Co | 40.9× | 2022-06 to 2026-06 | 48 | $3,096M | Demand shift | 87% | listed |
| STRL | Sterling Infrastructure, Inc. | 40.1× | 2022-09 to 2026-05 | 44 | $651M | Demand shift | 77% | listed |
| RKLB | Rocket Lab USA Inc. | 38.2× | 2024-04 to 2026-05 | 25 | $1,839M | Demand shift | 45% | listed |
| VKTX | Viking Therapeutics Inc | 36.9× | 2022-05 to 2024-03 | 22 | $172M | Approval or trial success | 42% | listed |
| BE | Bloom Energy Corp | 34.5× | 2024-02 to 2026-06 | 28 | $1,973M | Demand shift | 61% | listed |
| CRDO | Credo Technology Group Holding Ltd | 33.5× | 2023-04 to 2026-06 | 38 | $1,205M | Demand shift | 78% | listed |
| RYTM | Rhythm Pharmaceuticals Inc | 33.1× | 2022-05 to 2025-10 | 41 | $173M | Approval or trial success | 90% | listed |
| DYAX | Dyax Corp | 30.5× | 2011-09 to 2016-01 | 52 | $124M | Takeover | — | gone |
| KOD | Kodiak Sciences Inc | 30.0× | 2023-10 to 2026-04 | 30 | $76M | Approval or trial success | 95% | listed |
| WDC | Western Digital Corporation | 26.9× | 2022-12 to 2026-06 | 42 | $10,022M | Demand shift | 81% | listed |
| HYMC | Hycroft Mining Holding Corporation | 26.8× | 2024-02 to 2026-02 | 24 | $380M | Commodity price | 40% | listed |
| IESC | IES Holdings Inc | 26.6× | 2022-09 to 2026-06 | 45 | $567M | Demand shift | 85% | listed |
| AGX | Argan Inc | 26.4× | 2022-09 to 2026-06 | 45 | $447M | Demand shift | 71% | listed |
| VRNA | Verona Pharma PLC ADR | 25.5× | 2022-04 to 2025-09 | 41 | $2,019M | Approval or trial success | 81% | gone |
| TOP | Zhong Yang Financial Group Limited Ordinary Shares | 24.9× | 2023-02 to 2023-04 | 2 | $130M | Speculative frenzy | 2% | listed |
| ABMD | ABIOMED Inc | 23.6× | 2013-09 to 2018-09 | 60 | $749M | Approval or trial success | 85% | gone |
| NFLX | Netflix Inc | 23.4× | 2012-09 to 2017-07 | 58 | $3,023M | Demand shift | 386% | listed |
| LITE | Lumentum Holdings Inc | 23.0× | 2023-10 to 2026-04 | 30 | $2,615M | Demand shift | 85% | listed |
| IAG | IAMGold Corporation | 23.0× | 2022-09 to 2026-02 | 41 | $510M | Commodity price | 60% | listed |
| TNGX | Tango Therapeutics Inc | 22.8× | 2025-03 to 2026-06 | 15 | $148M | Approval or trial success | 85% | listed |
| LOXO | Loxo Oncology Inc | 22.8× | 2014-11 to 2019-02 | 51 | $171M | Approval or trial success | — | gone |
| ABVX | Abivax SA American Depositary Shares | 22.6× | 2025-01 to 2025-12 | 11 | $378M | Approval or trial success | 93% | listed |
| OKLO | Oklo Inc. | 22.2× | 2024-08 to 2025-10 | 14 | $729M | Demand shift | 30% | listed |
| STX | Seagate Technology PLC | 21.6× | 2022-10 to 2026-06 | 44 | $10,253M | Demand shift | 88% | listed |
| EXEL | Exelixis Inc | 21.1× | 2014-12 to 2017-12 | 36 | $281M | Approval or trial success | 182% | listed |
| CBPO | China Biologic Products Holdings Inc | 20.9× | 2011-09 to 2015-12 | 51 | $174M | Other | 84% | gone |
| IONQ | IONQ Inc | 20.9× | 2022-12 to 2026-05 | 41 | $690M | Speculative frenzy | 46% | listed |
| ELLI | Ellie Mae Inc | 20.8× | 2011-10 to 2016-10 | 60 | $106M | Demand shift | 93% | gone |
| CELC | Celcuity LLC | 20.4× | 2022-04 to 2026-05 | 49 | $97M | Approval or trial success | 62% | listed |
| ETON | Eton Pharmaceuticals Inc | 20.3× | 2022-09 to 2026-07 | 46 | $53M | Turnaround | — | listed |
| ALNY | Alnylam Pharmaceuticals Inc | 20.0× | 2011-09 to 2015-05 | 44 | $280M | Approval or trial success | 207% | listed |
| MDVN | Medivation Inc | 19.9× | 2011-08 to 2016-08 | 60 | $564M | Approval or trial success | 101% | gone |
| AMPX | Amprius Technologies Inc. | 19.7× | 2024-08 to 2026-04 | 20 | $119M | Demand shift | 44% | listed |
| SUNE | SunEdison Inc | 19.1× | 2012-05 to 2015-05 | 36 | $385M | Turnaround | 21% | gone |
| CECO | CECO Environmental Corp. | 19.1× | 2022-04 to 2026-06 | 50 | $167M | Demand shift | 83% | listed |
| PAYC | Paycom Software, Inc. | 18.8× | 2014-07 to 2019-07 | 60 | $652M | Other | 62% | listed |
| INGN | Inogen Inc | 18.8× | 2014-04 to 2018-08 | 52 | $257M | Demand shift | 2% | listed |
| LPA | Logistic Properties of the Americas | 18.6× | 2024-04 to 2024-05 | 1 | $222M | Speculative frenzy | 2% | listed |
| OUST | Ouster, Inc. Common Stock | 17.7× | 2023-04 to 2026-06 | 38 | $1,367M | Demand shift | 54% | listed |
| ECYT | Endocyte Inc | 17.6× | 2017-08 to 2018-12 | 16 | $58M | Takeover | — | gone |
| IQNT | Inteliquent Inc | 17.6× | 2012-12 to 2016-12 | 48 | $65M | Turnaround | 100% | gone |
| TPC | Tutor Perini Corporation | 17.6× | 2023-04 to 2026-04 | 36 | $274M | Turnaround | 93% | listed |
| HZNP | Horizon Pharma PLC | 17.5× | 2013-02 to 2015-07 | 29 | $130M | Other | 316% | gone |
| I | Intelsat S.A | 17.4× | 2016-02 to 2018-09 | 31 | $185M | Other | 2% | gone |
| PTGX | Protagonist Therapeutics Inc | 17.2× | 2022-11 to 2026-07 | 44 | $389M | Approval or trial success | — | listed |
| LUNR | Intuitive Machines Inc. | 17.2× | 2023-12 to 2026-05 | 29 | $215M | Demand shift | 29% | listed |
| ARQT | Arcutis Biotherapeutics Inc | 16.7× | 2023-11 to 2025-11 | 24 | $174M | Approval or trial success | 89% | listed |
| REGN | Regeneron Pharmaceuticals Inc | 16.6× | 2011-01 to 2015-10 | 57 | $2,698M | Approval or trial success | 119% | listed |
| SESN | Sesen Bio Inc | 16.5× | 2016-02 to 2016-08 | 6 | $116M | Other | 0% | gone |
| BNAI | Brand Engagement Network Inc | 16.3× | 2025-12 to 2026-03 | 3 | $104M | Speculative frenzy | 29% | listed |
| CWEI | Clayton Williams Energy Inc | 16.3× | 2016-03 to 2017-01 | 10 | $109M | Commodity price | 91% | gone |
| TTMI | TTM Technologies Inc | 16.3× | 2023-10 to 2026-06 | 32 | $1,193M | Demand shift | 70% | listed |
| YPF | YPF Sociedad Anonima | 16.3× | 2022-06 to 2026-05 | 47 | $1,282M | Turnaround | 97% | listed |
| CSIQ | Canadian Solar Inc | 16.2× | 2012-10 to 2014-02 | 16 | $112M | Turnaround | 32% | listed |
| AMSC | American Superconductor Corporation | 16.1× | 2022-12 to 2025-09 | 33 | $108M | Turnaround | 51% | listed |
| AMBA | Ambarella Inc | 16.1× | 2012-10 to 2015-07 | 33 | $188M | Demand shift | 59% | listed |
| CDXS | Codexis Inc | 15.7× | 2013-12 to 2018-11 | 59 | $53M | Turnaround | 7% | listed |
| LNG | Cheniere Energy Inc | 15.7× | 2011-09 to 2015-02 | 41 | $426M | Demand shift | 351% | listed |
| FLEX | Flex Ltd | 15.6× | 2022-06 to 2026-06 | 48 | $6,622M | Demand shift | 73% | listed |
| QURE | Uniqure NV | 15.4× | 2024-04 to 2025-10 | 18 | $211M | Approval or trial success | 58% | listed |
| TSRO | Tesaro Inc | 15.2× | 2012-08 to 2017-02 | 54 | $336M | Approval or trial success | 40% | gone |
| ERAS | Erasca Inc | 15.1× | 2025-06 to 2026-07 | 13 | $360M | Approval or trial success | — | listed |
| JKS | JinkoSolar Holding Company Limited | 14.8× | 2012-07 to 2014-02 | 19 | $198M | Turnaround | 59% | listed |
| ZLTQ | Zeltiq Aesthetics Inc | 14.8× | 2013-03 to 2017-04 | 49 | $137M | Demand shift | — | gone |
| RCPT | Receptos Inc | 14.6× | 2013-08 to 2015-08 | 24 | $290M | Approval or trial success | — | gone |
| NGL | NGL Energy Partners LP | 14.6× | 2022-11 to 2026-05 | 42 | $153M | Turnaround | 91% | listed |
| CC | Chemours Co | 14.6× | 2016-01 to 2017-10 | 21 | $713M | Turnaround | 42% | listed |
| CORT | Corcept Therapeutics Incorporated | 14.5× | 2013-09 to 2018-01 | 52 | $159M | Turnaround | 414% | listed |
| OMER | Omeros Corporation | 14.4× | 2023-10 to 2025-12 | 26 | $75M | Approval or trial success | 57% | listed |
| CIEN | Ciena Corp | 14.4× | 2022-09 to 2026-05 | 44 | $5,989M | Demand shift | 67% | listed |
| HW | Headwaters Inc | 14.3× | 2011-09 to 2015-10 | 49 | $88M | Turnaround | 118% | gone |
| REAL | TheRealReal Inc | 14.1× | 2023-04 to 2025-12 | 32 | $111M | Turnaround | 71% | listed |
| APEI | American Public Education Inc | 13.9× | 2023-10 to 2026-04 | 30 | $74M | Turnaround | 82% | listed |
| NVTS | Navitas Semiconductor Corp | 13.8× | 2025-04 to 2026-05 | 13 | $354M | Demand shift | 41% | listed |
| AGL | agilon health Inc | 13.6× | 2026-03 to 2026-06 | 3 | $3,282M | Turnaround | 91% | listed |
| COHR | Coherent Inc | 13.3× | 2023-10 to 2026-06 | 32 | $4,452M | Demand shift | 72% | listed |
| NBIX | Neurocrine Biosciences Inc | 13.2× | 2013-12 to 2018-08 | 56 | $629M | Approval or trial success | 143% | listed |
| AIP | Arteris Inc | 13.1× | 2023-04 to 2026-06 | 38 | $132M | Demand shift | 62% | listed |
| CNTA | Centessa Pharmaceuticals PLC ADR | 13.1× | 2022-12 to 2026-06 | 42 | $293M | Takeover | — | gone |
| BCRX | BioCryst Pharmaceuticals Inc | 13.0× | 2013-03 to 2015-07 | 28 | $61M | Approval or trial success | 60% | listed |
| ATRO | Astronics Corporation | 13.0× | 2022-09 to 2026-06 | 45 | $251M | Demand shift | 86% | listed |
| MXL | MaxLinear Inc | 12.8× | 2025-04 to 2026-06 | 14 | $863M | Demand shift | 56% | listed |
| BOOM | Dmc Global Inc | 12.7× | 2016-02 to 2019-04 | 38 | $78M | Commodity price | 9% | listed |
| LGCYO | Legacy Reserves LP | 12.7× | 2016-02 to 2018-06 | 28 | $101M | Commodity price | 72% | gone |
| RGEN | Repligen Corporation | 12.7× | 2011-09 to 2015-06 | 45 | $100M | Demand shift | 320% | listed |
| BBAR | BBVA Banco Frances SA ADR | 12.6× | 2022-06 to 2025-01 | 31 | $1,464M | Other | 89% | listed |
| CENX | Century Aluminum Company | 12.5× | 2022-09 to 2026-05 | 44 | $482M | Commodity price | 70% | listed |
| RDW | Redwire Corp | 12.4× | 2022-12 to 2026-05 | 41 | $126M | Demand shift | 35% | listed |
| ANRO | Alto Neuroscience, Inc. | 12.4× | 2025-03 to 2026-07 | 16 | $58M | Approval or trial success | — | listed |
| JBSS | John B Sanfilippo & Son Inc | 12.3× | 2011-12 to 2016-12 | 60 | $61M | Turnaround | 152% | listed |
| CLCD | CoLucid Pharmaceuticals Inc | 12.3× | 2015-10 to 2017-02 | 16 | $57M | Takeover | — | gone |
| BBIO | BridgeBio Pharma Inc | 12.3× | 2022-05 to 2026-07 | 50 | $1,009M | Approval or trial success | — | listed |
| LRCX | Lam Research Corp | 12.3× | 2022-09 to 2026-06 | 45 | $50,138M | Demand shift | 70% | listed |
| CDE | Coeur Mining Inc | 12.2× | 2023-09 to 2026-02 | 29 | $784M | Commodity price | 56% | listed |
| INSY | INSYS Therapeutics Inc | 12.2× | 2013-05 to 2015-07 | 26 | $236M | Other | 1% | gone |
| INSM | Insmed Inc | 12.2× | 2023-03 to 2025-11 | 32 | $2,326M | Approval or trial success | 51% | listed |
| VTYX | Ventyx Biosciences Inc | 12.2× | 2025-03 to 2026-03 | 12 | $82M | Approval or trial success | — | gone |
| CBM | Cambrex Corporation | 12.2× | 2011-07 to 2015-11 | 52 | $130M | Demand shift | 112% | gone |
| WVE | Wave Life Sciences Ltd | 12.1× | 2022-05 to 2025-12 | 43 | $86M | Approval or trial success | 34% | listed |
| KGC | Kinross Gold Corporation | 11.9× | 2022-08 to 2026-02 | 42 | $4,081M | Commodity price | 65% | listed |
| UVE | Universal Insurance Holdings Inc | 11.9× | 2011-11 to 2015-10 | 47 | $138M | Other | 187% | listed |
| BMA | Banco Macro SA B ADR | 11.8× | 2022-06 to 2026-01 | 43 | $7,161M | Other | 91% | listed |
| CNST | Constellation Pharmaceuticals Inc | 11.8× | 2018-12 to 2019-12 | 12 | $103M | Approval or trial success | 72% | gone |
| NAGE | Niagen Bioscience, Inc. | 11.7× | 2022-09 to 2025-06 | 33 | $84M | Turnaround | 22% | listed |
| SWBI | Smith & Wesson Brands Inc | 11.7× | 2011-09 to 2016-07 | 58 | $163M | Demand shift | 79% | listed |
| SMTC | Semtech Corporation | 11.6× | 2023-10 to 2026-06 | 32 | $896M | Demand shift | 78% | listed |
| OLMA | Olema Pharmaceuticals Inc | 11.6× | 2022-12 to 2025-11 | 35 | $99M | Approval or trial success | 41% | listed |
| HA | Hawaiian Holdings Inc | 11.5× | 2011-09 to 2016-09 | 60 | $214M | Turnaround | 38% | gone |
| SNTS | Santarus Inc | 11.5× | 2011-09 to 2013-11 | 26 | $169M | Takeover | 99% | gone |
| MESO | Mesoblast Ltd | 11.4× | 2024-01 to 2025-01 | 12 | $1,433M | Approval or trial success | 76% | listed |
| KERX | Keryx Biopharmaceuticals Inc | 11.4× | 2012-04 to 2014-08 | 28 | $113M | Approval or trial success | 18% | gone |
| GRRR | Gorilla Technology Group Inc. | 11.4× | 2024-07 to 2025-02 | 7 | $200M | Demand shift | 40% | listed |
| AAL | American Airlines Group | 11.4× | 2011-11 to 2014-12 | 37 | $1,582M | Turnaround | 28% | listed |
| PRIM | Primoris Services Corporation | 11.4× | 2022-09 to 2026-04 | 43 | $865M | Demand shift | 48% | listed |
| HTHT | Huazhu Group Ltd | 11.3× | 2013-05 to 2018-05 | 60 | $3,905M | Demand shift | 107% | listed |
| BMEA | Biomea Fusion Inc | 11.3× | 2022-04 to 2023-05 | 13 | $87M | Approval or trial success | 4% | listed |
| TSEM | Tower Semiconductor Ltd | 11.3× | 2023-10 to 2026-06 | 32 | $2,531M | Demand shift | 90% | listed |
| ALAB | Astera Labs, Inc. | 11.2× | 2024-08 to 2026-06 | 22 | $6,746M | Demand shift | 60% | listed |
| PRM | Perimeter Solutions SA | 11.1× | 2023-10 to 2026-06 | 32 | $494M | Turnaround | 95% | listed |
| RVMD | Revolution Medicines Inc | 11.1× | 2022-05 to 2026-07 | 50 | $1,261M | Approval or trial success | — | listed |
| CLYM | Climb Bio Inc | 11.1× | 2025-05 to 2026-06 | 13 | $80M | Approval or trial success | 98% | listed |
How this study was calculated
Universe. Every U.S. common stock listed on a U.S. venue between January 2011 and July 2026: 18,174 currently traded and 32,371 since vanished, 50,545 in total. Funds, warrants, rights and preferred shares are excluded. Foreign companies with a U.S. listing are included, because an investor with U.S. access could buy them.
Hit definition. A stock qualifies as a ten-bagger if its split- and dividend-adjusted price rose at least elevenfold within a window of 60 calendar months or less — measured month-end to month-end so that single outlier days cannot distort the result. Each company counts once, with its strongest window rather than several overlapping ones.
Tradability. At the starting point the stock had to be listed on Nasdaq, NYSE or NYSE American, priced above one dollar, worth more than $50 million and turning over a median of more than $100,000 a day. Market value is derived from the price at the time and the share count reported in the nearest SEC filing — not from present-day figures.
Excluded period. Price windows touching the market phase from February 2020 to November 2021 are not included. The pandemic crash, zero-rate liquidity and the meme-stock wave produced advances there that neither the period before nor after explains. Any window covering the phase even partially was excluded, not just those falling entirely inside it. The observed period therefore spans 165 months — 13 years and 9 months — in two segments.
Data verification. Price series from special situations are error-prone: reverse splits, post-bankruptcy relistings and recycled tickers produce arithmetic advances that never happened. Every hit was therefore checked against the reported split history; titles with impossible closing prices were removed, as were companies that had filed nothing with the regulator for more than six months at the end of their window. Each remaining case was researched individually; eleven whose factor could not be confirmed against independent sources were taken off the list.
Control group. From the same universe we drew a stratified random sample of titles clearing the same hurdles but never reaching an elevenfold rise. The draw is reproducible via a fixed seed. Fundamentals from annual reports are available for 444 of these and for 107 of the hits; the figures are medians, not means.
Limitations. For 19 of the 126 hits no fundamentals could be obtained for the starting point; they are missing from the metric comparison, not from the hit list. For some cases the exchange at the starting point is evidenced by the regulator's current registration data rather than the annual report of the time. And the study covers U.S. venues only — other markets are not included.
Sources. Price data from a commercial fundamentals feed, financial figures and company announcements from original SEC filings (10-K, 10-Q, 8-K), triggers per case from named individual sources recorded in the data table. Data as of July 25, 2026.
What does not follow from this study
That the later ten-baggers were small and loss-making at the starting point does not mean small loss-making companies become ten-baggers at above-average rates. The opposite holds: out of tens of thousands of such companies, 126 made it. The study describes a property of the winners, not a probability for buyers.
This article is a historical study and not investment advice. It contains no buy or sell recommendation and no forecast. Anyone making investment decisions should assess their own situation and risks — with professional advice where appropriate.
Frequently Asked Questions
In this study it was 126 out of 50,545 U.S. common stocks — measured against the 44,211 titles with a usable price history, roughly three in a thousand. The calculation covers January 2011 to January 2020 and December 2021 to July 2026, each with a window of five years or less.
The pandemic crash, zero-rate liquidity and the meme-stock wave produced advances in that phase that say nothing about the periods before or after. Any price window touching the phase was excluded, not just those falling entirely inside it.
At the starting point they were small (median market value $215 million), valued more cheaply than the control group and mostly loss-making: only 25 percent were in the black. What they did not have was faster revenue growth.
Most often a structural demand shift (42 cases), such as the build-out of AI data centers, followed by drug approvals and trial results (36 cases) and turnarounds (22 cases). Takeovers and pure speculative frenzies are rare.
Of the 112 stocks with a price history after their peak, 16 trade higher today, 64 hold between half and the full level, 23 between ten and fifty percent and nine below ten percent. Fourteen were never traded again after their peak.
Yes. Of the 50,545 titles examined, 32,371 are no longer listed. That is what sets this study apart: counting only stocks you can buy today leaves out failed and acquired companies and produces a flattering picture.
No. The study describes what happened. That the winners were small and loss-making does not mean small loss-making companies frequently become winners — the overwhelming majority never did. This is not investment advice.


