Cash Flow Inflection Backtest: Acceleration Wins
When a company reports positive free cash flow on a sustained basis for the first time, it is a popular buy trigger — the balance sheet "turns". We ran thirteen and a half years of SEC data through that filter: 1,064 positions from 872 companies, one portfolio, three calculations. The sign flip itself does not carry — 9.61% a year against 15.02% for the S&P 500 with dividends. What does carry is the acceleration of an already-positive series. And waiting for more confirmation means buying later and missing the strongest phase of the recovery.
 Thomas Mücke
Founder & Publisher
Thomas Mücke
Founder & Publisher
The question: is the inflection a good entry — and does "fresh" matter?
A company that burned more cash than it earned for years reports two consecutive quarters of positive free cash flow for the first time. The balance sheet "turns". Is that moment a good long-term entry point? And is a fresh entry — buying right after the inflection — better than a late one, in a company that has already been cash-flow positive for a while?
We define the inflection strictly: trailing-twelve-month free cash flow was negative for at least four consecutive quarters and then positive for at least two consecutive quarters, each with a free cash flow margin of at least 1 percent — a threshold against pure rounding inflections. The buy happens on the monthly reference date on which that inflection was first filed (the SEC filed field of the second positive quarter), not from the end of that quarter. Anything else would be hindsight with information an investor did not have on the purchase date.
Data basis: 1,064 positions from 872 companies that actually entered the portfolio, across 163 monthly reference dates from January 2013 to July 2026. At the signal level the rule produced 18,440 signal rows across 968 companies, of which 3,389 rows carry a fresh inflection (896 distinct companies). The gap between 968 companies with a signal and 872 companies in the portfolio comes from the $1 minimum price and from missing prices at the entry month. All of it is drawn from a signal universe of 5,874 companies with a usable FCF series and a total pool of 6,692 companies with a usable cash-flow series from SEC EDGAR XBRL data.
The result in four numbers
Is the moment a company first reports sustained positive free cash flow again after a long dry spell a good long-term entry point? We tested that on 1,064 positions from 872 companies between January 2013 and July 2026, against the US stock market. Four numbers carry the result:
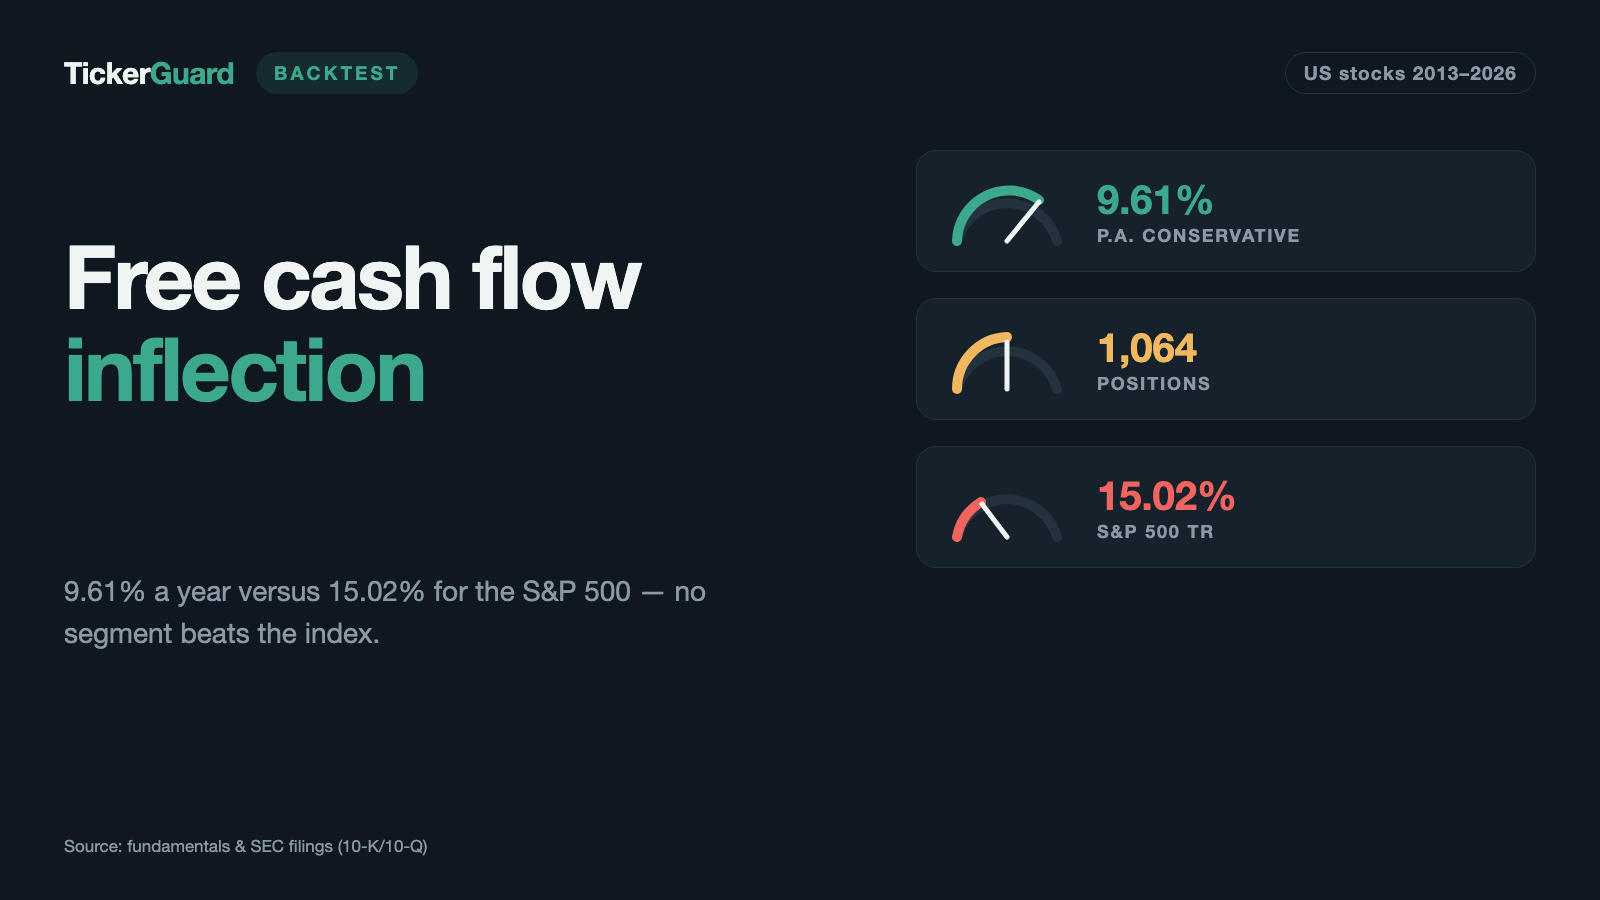
- 9.61% a year returned the FCF inflection in the headline count — a twelve-month hold, conservative calculation.
- 15.02% returned the S&P 500 with dividends over the same period — the inflection fell clearly short of it.
- 10.95% a year returned the "FCF accelerator" control arm — it measures the pickup of an already-positive series instead of the sign flip, and it beat the inflection, though it too stayed below the index.
- 15.68% a year returned the only variant that cleared the index: six instead of four cash-burn quarters before the inflection — but on just 595 instead of 1,064 positions, so on a thin basis.
Over the tested window from January 2013 to July 2026, the plain sign flip in free cash flow lagged the broad market average, the acceleration of an already-positive series showed the smaller shortfall, and only the six-quarter variant cleared the index, on a thin basis.
The result: the headline variant does not beat the market
The headline number in this study is conservative — it excludes positions with a month-over-month jump above 200 percent, because the price history does not always let us tell whether such a jump is real or a data error. The full count sits next to it, and the total-loss calculation stands as a third number: there a forced sale on delisting costs −100 percent instead of the last available price.
| Holding period | Positions | p.a. conservative | p.a. full | p.a. total-loss | Max drawdown | Hit rate |
|---|---|---|---|---|---|---|
| 3 months | 1,076 | 10.50% | 10.50% | 5.04% | −44.57% | 53.07% |
| 6 months | 1,074 | 13.37% | 13.37% | 7.37% | −33.95% | 53.91% |
| 12 months (headline) | 1,064 | 9.61% | 10.66% | 3.29% | −37.96% | 52.12% |
| as long as the inflection holds | 1,065 | 8.40% | 8.68% | 2.48% | −36.92% | 53.62% |
Even the best holding period — six months at 13.37% — stays below the S&P 500 Total Return of 15.02% per year (maximum drawdown −23.87%). And a fresh entry is the better one: at twelve months the "fresh" arm (946 positions) returns 9.21%, while the "already running" arm (118 positions) returns only 5.71%. At three and six months the gap is wider (10.23% against −1.49%, and 12.73% against 4.97%). Only under the "as long as the inflection holds" sell rule does the picture reverse — there on a very thin basis of 119 positions. Comparing against the all-positions figure (9.61%) would not settle this question: the "all positions" arm already contains the fresh entries.
The control arm beats the inflection: acceleration, not sign flip
Is the sign flip even the right signal for free cash flow — or does the acceleration of an already-positive series matter more? The "FCF accelerator" control arm tests exactly that: companies with continuously positive free cash flow, four quiet quarters growing under 15 percent, followed by at least two quarters growing at least 30 percent year-over-year. Same portfolio rules, same costs, same segments — only the signal changes.
| Signal | Positions | p.a. conservative | p.a. full | p.a. total-loss | Max drawdown | Hit rate |
|---|---|---|---|---|---|---|
| FCF inflection | 1,064 | 9.61% | 10.66% | 3.29% | −37.96% | 52.12% |
| FCF accelerator | 1,144 | 10.95% | 11.14% | 8.57% | −33.21% | 62.90% |
The accelerator leads in all three calculations — and the gap is widest in the total-loss calculation (8.57% against 3.29%). The reason: companies coming out of the red disappear from the ticker tape more often than companies that already make money and are simply growing faster. The core finding of this study: for free cash flow, acceleration is the more robust signal, not the sign flip. The accelerator still does not beat the index (10.95% against 15.02%), but it loses by a much narrower margin.
Sensitivity: more confirmation hurts, a longer history helps
Every variant turns exactly one dial relative to the headline variant — four cash-burn quarters, two confirmation quarters, a 1 percent minimum margin.
| Variant | Positions | p.a. conservative | p.a. full | p.a. total-loss | Hit rate |
|---|---|---|---|---|---|
| 1 confirmation quarter | 1,345 | 10.63% | 16.55% | 5.78% | 51.38% |
| Headline variant: 4 burn quarters, 2 confirmation quarters, margin ≥ 1% | 1,064 | 9.61% | 10.66% | 3.29% | 52.12% |
| 3 confirmation quarters | 897 | 6.67% | 9.86% | 0.75% | 51.12% |
| 6 burn quarters | 595 | 15.68% | 16.63% | 9.77% | 54.13% |
| 8 burn quarters | 385 | 14.11% | 15.56% | 8.77% | 54.05% |
| Margin ≥ 0% | 1,585 | 10.61% | 11.52% | 5.23% | 52.81% |
| Margin ≥ 3% | 585 | 9.16% | 10.02% | 1.78% | 52.05% |
Two patterns stand out. First: more confirmation hurts. A single confirmation quarter (10.63%) beats two (9.61%), and three confirmation quarters (6.67%) fall off clearly — waiting for more certainty means buying later and missing the strongest phase of the recovery. Second: a longer cash-burn history helps. Six consecutive negative quarters (15.68%) and eight quarters (14.11%) clearly beat the headline variant with four quarters — a company that held on longer before turning delivers the stronger inflection.
That table also holds the one exception in the conservative headline count: the six-quarter variant clears the S&P 500 benchmark of 15.02% at 15.68% — and not only at twelve months, but at three (18.09%) and six months (18.75%) as well. Only under the "as long as the inflection holds" sell rule does it fall short too, on the conservative count (14.58%). It is a finding, but a narrow one: it rests on 595 instead of 1,064 positions, and it has not been tested outside this backtest. The eight-quarter variant (14.11%) already falls back below.
Micro-caps lose — and the Covid suspicion does not hold
| Segment | Positions | p.a. conservative | p.a. full | Max drawdown |
|---|---|---|---|---|
| Revenue over $100 million | 834 | 10.88% | 11.68% | −37.55% |
| Revenue $10 to $100 million | 209 | 10.17% | 11.55% | −44.80% |
| Revenue under $10 million | 21 | −8.11% | −8.11% | −87.84% |
| Fresh entry | 946 | 9.21% | 10.31% | −38.05% |
| Late entry (inflection already running) | 118 | 5.71% | 5.71% | −60.39% |
| Outside 2020 to 2022 (Covid-free) | 780 | 8.55% | 8.98% | −34.74% |
The smallest revenue class again performs worst: 21 positions, a maximum drawdown of −87.84% and a negative annualized return — on a basis this thin the figure is an indication, not a robust result. The study rests on the larger companies; that is where the signal carries at all, even though it still does not clear the index.
An obvious suspicion was a cluster of fresh inflections during Covid, when many companies stopped capital spending and drew down inventory — both effects that can trigger a free-cash-flow sign flip without any operating improvement. The data shows the opposite: 203 companies with a fresh inflection in 2017 to 2019, 309 in 2020 to 2022 and 367 in 2023 to 2025 — a steady increase, not a Covid spike.
Family comparison: FCF inflection against revenue inflection
How does the FCF inflection compare to related backtests? Convention: twelve-month holding period, annualized return over January 2013 to July 2026, equal-weighted, 0.1 percent cost per side — the same convention as the Revenue Inflection backtest.
| Backtest | p.a. conservative (headline) | p.a. full |
|---|---|---|
| FCF inflection | 9.61% | 10.66% |
| FCF accelerator (control arm) | 10.95% | 11.14% |
| Revenue inflection (external reference, Revenue Inflection study) | 16.56% | 26.28% |
| S&P 500 Total Return | 15.02% | 15.02% |
| Universe, equal-weighted (trimmed) | 4.77% | 4.77% |
Two backtests from the same family are still missing: the earnings inflection and the cash-flow-statement inflection run as their own backtests but are not calculated here. A placeholder number would eventually get quoted somewhere — so they are deliberately shown as pending rather than filled in.
Overlap: 513 companies had a fresh revenue inflection, 896 had a fresh FCF inflection, and 135 had both (15.07% of the FCF-inflection companies). For 77 companies the FCF inflection came later than the revenue inflection, for 53 the revenue inflection came later, and for 5 both fell on the same month — median gap 6 months.
The paired comparison asks a different question: when a company shows both signals, what does waiting for the second one cost? The same company enters the portfolio once from its earlier and once from its later signal, each held for twelve months.
| Calculation | Pairs | From the earlier signal (median) | From the later signal (median) | Median of the per-company differences | Mean of the per-company differences |
|---|---|---|---|---|---|
| Conservative (headline) | 96 | +10.64% | −10.51% | +14.86 pp | +3.36 pp |
| Full | 99 | +10.40% | −8.73% | +13.41 pp | −2.10 pp |
In both calculations the median advantage of the earlier signal is large and stable — on the conservative count it wins in 59 of 96 pairs, on the full count in 60 of 99. The mean, however, flips negative in the full calculation — a single extreme outlier over a twelve-month hold can tip a mean. The finding therefore rests on the median: waiting for the second signal cost return in the majority of cases, not safety.
Of 135 companies with both signals, 5 dropped out because both signals fell in the same month. Of the remaining pairs, 15 stayed below the $1 minimum entry price and for 16 the twelve months ran past the end of the study period — leaving 99 pairs for the full calculation. The conservative headline number drops 3 further pairs with a price jump above 200 percent and therefore rests on 96 pairs. The same portfolio rules as in the main run apply: minimum price, costs, delisting and the jump threshold.
How we calculated it
The basis is SEC EDGAR XBRL data from 2013 onward. A 10-Q cash flow statement reports cumulative year-to-date figures — we difference those into individual quarters and build free cash flow (operating cash flow minus capital expenditure) over the trailing four quarters. The buy happens on the day the second confirming quarter was filed, not from the end of that quarter — strict point-in-time logic. Where the filing date was uncertain in the data pool, it is rounded backwards: for some quarters the date used is later than the actual one, never earlier. That costs return, it never grants any.
A quarter with operating cash flow but no reportable capital expenditure figure counts as "FCF unprovable" and is dropped from the calculation — it is never read as zero. Coverage of both figures runs at 78.32% across the full data pool: 182,866 of 233,485 quarters with operating cash flow also carry a capital expenditure figure for the same quarter. If either side is flagged as disputed, the quarter is not calculable; that affects 7,620 quarter pairs. That leaves 175,246 calculable FCF quarters, a computable rate of 75.06%.
10,146 individual cash-flow values are flagged as disputed — 2.43% of all 416,952 reported values, spread across 9,097 quarters — because a later SEC filing clearly contradicted the same quarter. They stay in the pool but not in the signal calculation.
A signal of the headline variant requires an unbroken chain: six consecutive TTM quarters with no missing capital expenditure figure; stricter variants need correspondingly more. Companies that report incompletely therefore never show up in the signal calculation at all — of 6,692 companies with a cash-flow series, 5,874 reach an FCF series. The gap therefore acts on the selection, not on the individual return.
Costs: 0.1 percent per side of a trade. Delisting: forced sale at the last available price, alongside a parallel total-loss calculation in which a delisting costs −100 percent. As a manual spot check, five companies were fully re-derived against their original quarterly and annual filings (10-Q and 10-K): 58 of 58 values matched exactly.
Source: fundamental data & SEC filings (10-K/10-Q).
What this study does not say
The conservative headline number excludes 3 positions with a month-over-month jump above 200 percent from the main calculation. On closer inspection at least one of them — 3D Systems in January 2021 — was a documented, genuine price move; the other two cannot be reliably resolved from the price history alone. The conservative number is therefore the lower bound, and the full number (10.66% instead of 9.61%) the honest upper bound of that uncertainty — the two should be read together.
This study also says nothing about the right time to sell — only fixed holding periods and "as long as the inflection holds" were tested. And it does not answer whether combining an FCF inflection with a revenue inflection outperforms either signal alone; that remains an open question for a separate backtest.
A backtest is not a forecast. This study is market research, not investment advice and not a buy recommendation. Taxes and trading spreads are not modelled.
Frequently Asked Questions
It measures what would have happened had you bought every company on the day it first reported positive free cash flow again after at least four consecutive negative quarters — at least two consecutive quarters, each with a margin of at least 1%. The data basis is 1,064 positions from 872 companies that actually entered the portfolio — out of 968 companies with a signal between January 2013 and July 2026.
No — with one exception. The headline run returns 9.61% per year (conservative) or 10.66% (full count); the S&P 500 with dividends returned 15.02% per year over the same period. No segment clears the index. Among the rule variants exactly one does: requiring six instead of four cash-burn quarters returns 15.68% — on only 595 positions.
Yes, clearly. At a 12-month hold the fresh arm (946 positions) returns 9.21%, while the late arm — companies whose inflection is already some way back (118 positions) — returns only 5.71%. At three and six months the gap is even wider. Only under the "as long as the inflection holds" rule does the picture reverse, and there on a very thin basis.
The inflection measures the sign flip from negative to positive. The accelerator instead measures a company that already has continuously positive free cash flow whose growth suddenly picks up — at least 30% against the prior year after quieter quarters. The accelerator does better, at 10.95%, than the inflection at 9.61%, mainly because its companies drop off the ticker tape less often.
Because for 3 positions with a price jump above 200% in a single month the price history does not reliably tell us whether the jump is real or a data error. The conservative calculation excludes those positions and gives the lower, more careful bound; the full calculation sits next to it as the honest upper bound.
135 companies showed both a fresh FCF inflection and a fresh revenue inflection. In the paired comparison the EARLIER of the two signals was the better one in 59 of 96 cases — median +10.64% against −10.51% for the later signal. Waiting for the second signal cost return in the majority of cases.
Five companies were fully re-derived against their original quarterly and annual filings (10-Q and 10-K; 58 of 58 values exact), three sample positions were hand-calculated to four decimal places, the delisting logic was checked against an independent date column, and both benchmarks reproduce the reference values of the revenue inflection backtest to two decimal places.


