Earnings Inflection Backtest: The Fresh Inflection Does Not Beat the Market — 6.76% Against 15.02% per Year
A company whose earnings per share suddenly jump at least 30 percent after four quiet quarters — is that a buy signal? For revenue, the answer was yes. For earnings we tested the same rule across thirteen and a half years and 34,940 signals in the main variant, with delisted stocks left in the portfolio, with the filing date rather than the quarter end as the cut-off, and with no ceiling on the growth band, because earnings jumps scatter far more widely than revenue jumps. This time the answer is no: the fresh earnings inflection stays clearly behind the S&P 500 including dividends at 6.76% per year against 15.02% — even after raising the threshold, capping the growth band, and stripping out the Covid base effect. Its sibling signal, the revenue inflection, beat the market. And it arrived, in the median, four months after the earnings inflection.
 Thomas Mücke
Founder & Publisher
Thomas Mücke
Founder & Publisher
The question: is the inflection in EARNINGS the better signal than the inflection in revenue?
The Revenue Inflection Backtest found that a company whose revenue suddenly jumps 30 to 70 percent after four quiet quarters was, with caveats, a better buy in hindsight than one that had already been growing hard for years. The obvious follow-up: does the same hold for EARNINGS per share? An earnings jump is the more dramatic headline, and it is what many investors look at first.
We carried the same core rule over to diluted earnings per share from continuing operations — with one deliberate difference: revenue had a growth band with a ceiling (30 to 70 percent), because triple-digit growth is no longer a beginning. Earnings has no ceiling. The reason is arithmetic: a year-over-year earnings comparison scatters far more widely than a revenue comparison, because the denominator — the year-ago profit — is often very small. A 70 percent cap would not have filtered out the outliers, it would have cut the cohort in half. We still show what a cap would buy as a sensitivity further down.
- Acceleration. The most recent two or more consecutive quarters each grow at least 30 percent against their year-ago quarter.
- A quiet run before it. The four quarters immediately preceding the first accelerating quarter each grew by less than 15 percent.
- Edge cases. A year-over-year comparison only counts when both the base quarter AND the signal quarter show positive earnings and the signal quarter's net margin is at least 2 percent — otherwise that quarter counts as neither quiet nor accelerating. This is the small-base guard: without it, a company moving from a one-cent profit to two cents would register as a "doubling".
A company that meets the acceleration test but cannot document the quiet run across four quarters (usually a recent listing) is classed as K-jung (history too short). A company that was already growing before the acceleration is classed as L-alt — an established earnings grower. Only a company meeting both cleanly is the fresh inflection (K). A separate second segment, the loss-to-profit turnaround, measures on its own whether a jump out of at least four consecutive loss quarters into at least two profit quarters pays off — a year-over-year comparison is undefined there by definition, so it stays separate.
The result in four numbers
A company whose earnings per share suddenly jump at least 30 percent after four quiet quarters — is that a buy signal, the way it was for revenue? We tested this on US stocks over 2013 to 2026.
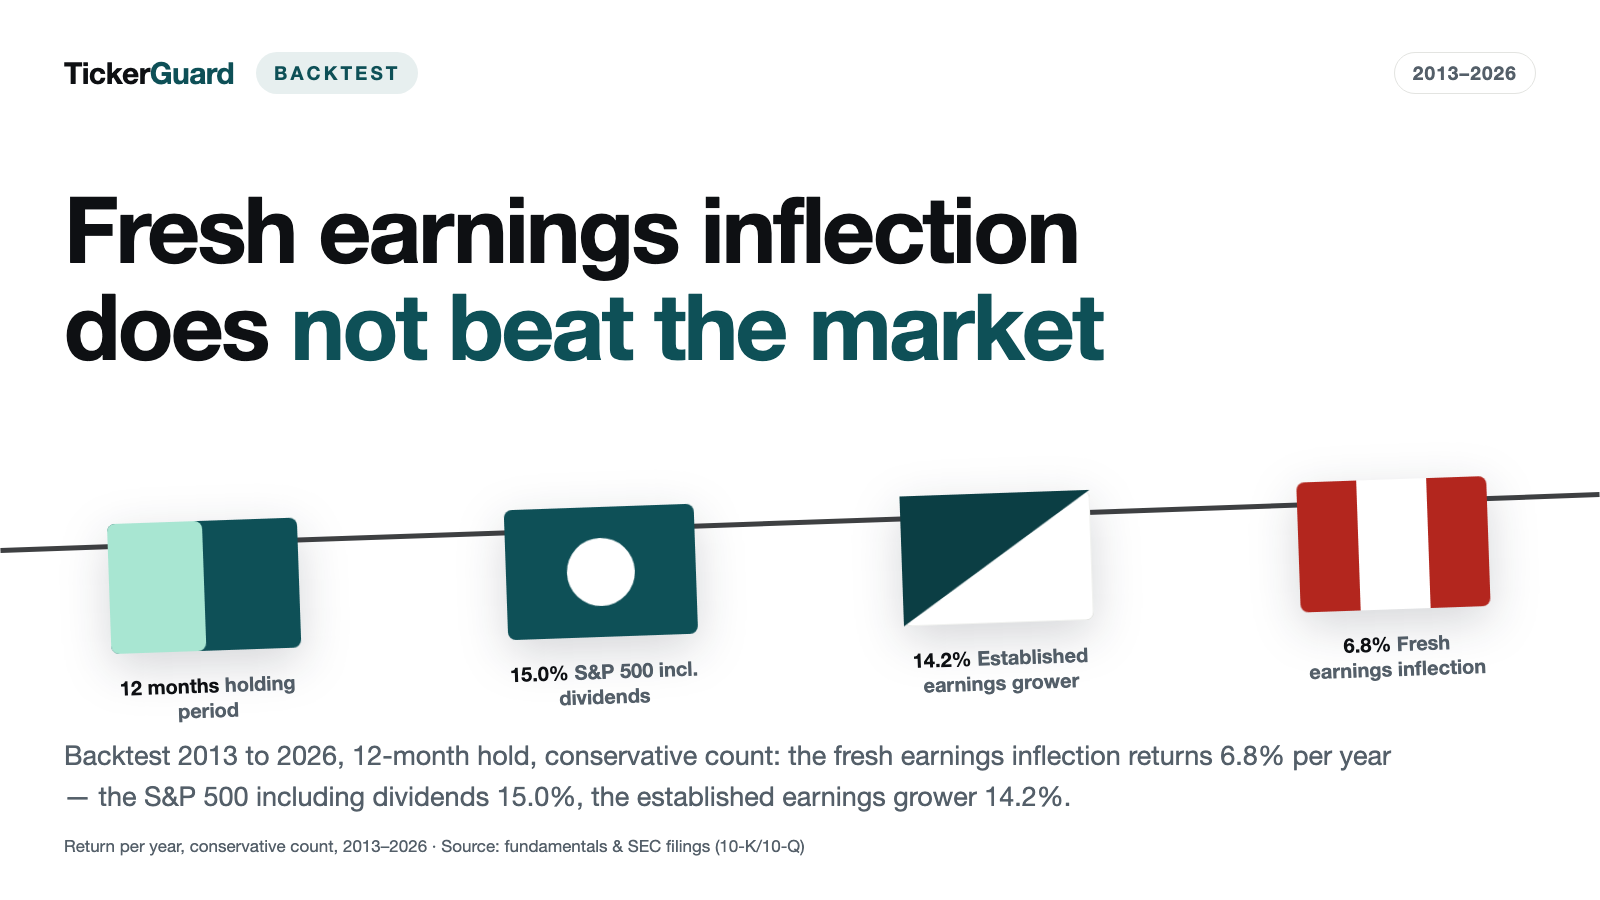
- 6.76% per year is what the fresh earnings inflection returned, on the conservative count (258 positions, twelve-month hold).
- 15.02% is what the S&P 500 Total Return returned over the same period — the signal stayed clearly behind it.
- 16.56% is what the revenue inflection returned, the sibling signal under an identical convention (277 positions) — it beat the market. The earnings inflection arrived 4 months earlier in the median, but paid off worse.
- 10.86% is what the best counter-test returned, a 30-to-70 percent growth cap (only 74 positions) — it improved the result but still stayed below the market.
In the tested window, a sudden acceleration in earnings per share — unlike the one in revenue — was not a viable buy signal.
The result: the fresh earnings inflection does NOT beat the market
Every headline figure in this study is the conservative one — computed excluding positions with a monthly jump above 200 percent suspected of being unrecorded reverse splits (more on this in the data-error section below). At a twelve-month hold, grown organically:
| Arm | Positions | Return p.a. conservative | Return p.a. full | Max drawdown (conservative) |
|---|---|---|---|---|
| fresh earnings inflection, organic | 258 | 6.76% | 6.76% | −27.46% |
| history too short, organic | 1,387 | 11.20% | 15.35% | −38.79% |
| established earnings grower, organic | 903 | 14.24% | 15.75% | −31.87% |
| all purchases in the backtest | 4,240 | 12.09% | 13.81% | −31.56% |
| S&P 500 Total Return | — | 15.02% (identical in both counts) | −23.87% | |
| Universe, equal-weighted (trimmed mean) | — | 4.77% (identical in both counts) | −53.23% | |
| Universe, median stock | — | −5.45% (identical in both counts) | −60.68% | |
None of the three freshness classes reliably beats the index. The fresh inflection trails the most, the established earnings grower comes closest without surpassing it. For comparison: for revenue, the same setup was reversed — the fresh inflection there beat both the established grower and the market. For earnings the ranking of the three classes is flipped: the established earnings grower sits on top, "history too short" behind it, the fresh inflection last. And none of the three reach the S&P 500's level.
Across every holding period: the same picture
So this is not an artefact of picking twelve months, here are all four holding periods — with the median number of stocks held per month and the count of months holding two or fewer, to show where a portfolio gets thin.
| Hold | Arm | Positions | Stocks/month (median) | Months with ≤ 2 | Return p.a. |
|---|---|---|---|---|---|
| 3 months | fresh earnings inflection, organic | 258 | 4 | 35 | 5.13% |
| 3 months | established earnings grower, organic | 1,017 | 18 | 0 | 18.32% |
| 6 months | fresh earnings inflection, organic | 258 | 7 | 3 | 8.48% |
| 6 months | established earnings grower, organic | 1,017 | 36 | 0 | 16.67% |
| 12 months | fresh earnings inflection, organic | 258 | 15 | 0 | 6.76% |
| 12 months | established earnings grower, organic | 903 | 64 | 0 | 14.24% |
| as long as growth holds | fresh earnings inflection, organic | 258 | 10 | 0 | 8.54% |
| as long as growth holds | established earnings grower, organic | 963 | 41.5 | 0 | 17.19% |
At a three-month hold, the fresh inflection holds two or fewer stocks in 35 of 156 invested months — a portfolio that measures individual companies more than a strategy. Only from twelve months on does the arm hold at least three stocks throughout. Across no holding period does the fresh inflection exceed 8.54%.
The established earnings grower leads at every holding period, and it is the arm that beats the S&P 500 most often: 18.32% against 15.02% at three months, 16.67% at six months and 17.19% on an open-ended hold. At twelve months, this study's main mode, it falls just short at 14.24%. The only other arm to clear the index is the "history too short" class on an open-ended hold, and only barely (15.14%). The fresh inflection — the signal actually under test — never manages it at any holding period. The established grower's edge is a side finding, not a buy rule: that class describes companies that were already growing before the acceleration — the exact opposite of what this backtest examines. No portfolio was tested on that class, and the class exists here as a comparison group, not as a strategy.
Second segment: does the loss-to-profit turnaround pay off?
Its own cohort, its own rule: at least four consecutive loss quarters, then at least two consecutive quarters of newly positive earnings. These numbers are never combined with the main segment — a year-over-year comparison would be undefined here, since the year-ago quarter is a loss by definition. For the same reason the fourth holding condition differs here: the position is held for as long as the latest reported quarter shows positive earnings, not for as long as a growth margin holds.
| Hold | Arm | Positions | Stocks/month (median) | Return p.a. | Max drawdown |
|---|---|---|---|---|---|
| 3 months | all turnarounds | 972 | 17 | 5.27% | −57.31% |
| 3 months | turnarounds, organic | 588 | 11 | 13.62% | −42.13% |
| 6 months | all turnarounds | 972 | 34 | 5.95% | −44.49% |
| 6 months | turnarounds, organic | 588 | 22 | 14.92% | −31.71% |
| 12 months | all turnarounds | 971 | 67 | 10.02% | −42.00% |
| 12 months | turnarounds, organic | 588 | 42.5 | 14.43% | −34.04% |
| as long as profits hold | all turnarounds | 966 | 78 | 10.99% | −38.56% |
| as long as profits hold | turnarounds, organic | 586 | 48 | 14.67% | −31.93% |
Grown organically, the turnaround comes close to the market at a twelve-month hold (14.43% against 15.02% for the S&P 500) — effectively level with the established earnings grower (14.24%), and like it without beating the index. Its maximum drawdown of 34.04% to 42.00% sits markedly deeper than the index's 23.87%. Across all turnarounds together, including inorganic and organically-unclear ones, the picture collapses: only 10.02% per year at twelve months. One documented example from the hand-check: Optical Cable (OCC), entered December 2014 after four loss quarters followed by two profit quarters — the position lost 36.36% over twelve months.
Earnings against revenue: who arrives first, who pays better?
This is the real point of this study. Under an identical convention — twelve-month hold, return per year, period January 2013 to July 2026, arm K and organic, conservative count — the revenue inflection is clearly ahead:
| Backtest | Positions | Return p.a. conservative | Return p.a. full |
|---|---|---|---|
| Earnings inflection (this study) | 258 | 6.76% | 6.76% |
| Revenue inflection (prior study) | 277 | 16.56% | 26.28% |
| S&P 500 Total Return | — | 15.02% | |
The revenue inflection beats the market (16.56% against 15.02%), the earnings inflection falls clearly short of it (6.76%). And yet the earnings inflection frequently arrives first in time: 2,129 companies had an earnings inflection, 2,157 a revenue inflection and 1,050 both — that is 49.32% of the earnings-inflection companies. The median gap between the two sides' first signal months is 4.0 months in favour of earnings: earnings leads. Broken down by company: 565 led with earnings, 414 led with revenue, 71 on the same month.
This is a finding, not a trading rule: a portfolio built from companies with both signals was NOT constructed or tested here — that would be its own study with its own rule and its own verification. What this study shows is the sequence and its price: watching earnings gets you there earlier, but it pays off worse. The revenue inflection remains the signal that carries.
Sensitivities: what makes the rule robust — and what does not
Each variant turns exactly one dial against the main variant, everything else held equal. Twelve-month hold, fresh inflection, organic, conservative count:
| Variant | What was turned | Positions | Return p.a. |
|---|---|---|---|
g2_30_r15_m2 (main) | threshold 30%, quiet run under 15%, margin ≥ 2% | 258 | 6.76% |
g2_25_r15_m2 | threshold lowered to 25% | 320 | 7.86% |
g2_50_r15_m2 | threshold raised to 50% | 124 | 3.24% |
g2_80_r15_m2 | threshold raised to 80% | 59 | 0.22% |
g2_30_70_r15_m2 | growth cap 30–70% introduced | 74 | 10.86% |
g3_30_r15_m2 | three instead of two accelerating quarters required | 151 | 9.64% |
g2_30_r10_m2 | quiet-run threshold tightened to 10% | 207 | 6.45% |
g2_30_r20_m2 | quiet-run threshold loosened to 20% | 332 | 6.88% |
g2_30_r15_m0 | margin rule removed (0% instead of 2%) | 388 | 8.43% |
g2_30_r15_m5 | margin rule tightened (5% instead of 2%) | 144 | 7.49% |
Higher growth thresholds consistently make the result worse: from 6.76% at a 30 percent minimum to 3.24% at 50 percent and 0.22% at 80 percent — the tighter the definition of "acceleration", the weaker the return, not stronger. A 30-to-70 percent growth cap (as used for revenue) helps: 10.86% instead of 6.76%, on just 74 positions — but that still stays below the market's 15.02%. Waiting for three instead of two accelerating quarters also improves the result (9.64%, 151 positions) — unlike the revenue inflection, where later confirmation drove the return to nearly zero. The quiet-run threshold and the margin rule barely move the picture. None of the ten variants come close to the S&P 500.
Robustness without the Covid base effect
An earnings inflection measures the year-ago quarter. A company that had to shut down in spring 2020 booked, one year later, an arithmetic multiple without gaining a single new customer — and the collapse beforehand supplies the quiet-run condition for free. This effect is stronger for earnings than for revenue, because fixed costs can push the denominator toward zero. We therefore excluded every entry between April 2020 and December 2022. This counter-test is the only table in the study on the full count: the run holds no conservative variant for it, and we do not label it as one.
| Hold | fresh inflection, organic | established grower, organic | all purchases | positions dropped |
|---|---|---|---|---|
| 3 months | 4.37% | 16.59% | 13.90% | 1,186 of 4,587 |
| 6 months | 6.49% | 19.78% | 13.27% | 1,186 of 4,583 |
| 12 months | 5.89% | 16.18% | 13.84% | 1,090 of 4,240 |
| as long as growth holds | 4.38% | 17.41% | 14.36% | 1,169 of 4,519 |
The finding does not flip: at a twelve-month hold the fresh inflection drops from 6.76% to 5.89% (177 instead of 258 positions) — it stays below the market with or without the Covid base effect. The turnaround segment holds up at its core too: without the Covid span, at twelve months organic returns 14.13% (429 of the 588 positions remain), close to the headline run.
How many signals are there in the first place?
The number of signals swings sharply with the market environment — 2021 and 2022 are the highest-signal years of the main variant, partly favoured by the same Covid base effect.
| Year | Companies | Signals | fresh inflection (K) | history too short (K-jung) | already growing (L-alt) |
|---|---|---|---|---|---|
| 2013 | 407 | 1,937 | 152 | 1,247 | 538 |
| 2014 | 422 | 2,017 | 163 | 1,299 | 555 |
| 2015 | 430 | 2,197 | 251 | 1,323 | 623 |
| 2016 | 387 | 1,910 | 198 | 1,152 | 560 |
| 2017 | 461 | 2,288 | 216 | 1,368 | 704 |
| 2018 | 685 | 3,502 | 220 | 2,108 | 1,174 |
| 2019 | 573 | 2,422 | 123 | 1,524 | 775 |
| 2020 | 447 | 2,087 | 166 | 1,314 | 607 |
| 2021 | 754 | 4,157 | 621 | 2,103 | 1,433 |
| 2022 | 740 | 3,824 | 396 | 2,337 | 1,091 |
| 2023 | 533 | 2,479 | 250 | 1,436 | 793 |
| 2024 | 476 | 2,370 | 286 | 1,387 | 697 |
| 2025 | 464 | 2,289 | 178 | 1,401 | 710 |
| 2026 (partial, through July) | 386 | 1,461 | 108 | 835 | 518 |
Across all 14 years (2013 through partial 2026), the main variant carries 34,940 signal rows; across all eleven computed variants together the figure is 282,400. 2,882 companies produced a signal at all. The K arm remains the smallest of the three freshness classes throughout — a pattern picked up again in the "What this study does not say" section.
The data error weighing on the comparison figures — and why the conservative number leads
Checking individual positions by hand turned up several with a monthly return above 200 percent — a value that almost always has the same cause: a reverse split that was never carried into the adjusted price. Three cases are directly verifiable in the price series:
- BVH: raw price jumps from 2.75 in November 2015 to 84.75 in December 2015, with the ratio between adjusted and raw price essentially unchanged — a reverse split that never made it into the record.
- NCS: raw price jumps from 5.71 in June 2019 to 64.00 in July 2019, adjusted price stays equal to the raw price — the same failure mode.
- TASR: the adjustment factor collapses between December 2015 and January 2016 while the RAW price falls — not a price jump at all, but a reused ticker symbol.
| Segment | Positions affected | Share |
|---|---|---|
| Main variant (earnings inflection) | 6 of 4,240 | 0.14% |
| Loss-to-profit turnaround | 4 of 971 | 0.41% |
One thing first, so the figures are read correctly: the headline figure of this study is not affected. None of the six positions sits in the arm "fresh earnings inflection, organic" — it counts 258 positions on both counts and returns 6.76% either way. Five of the six fall into the "history too short" class, one into "already growing". What is weighed down are the comparison figures, not the finding.
Small in count, large in effect they are nonetheless: in the arm "all purchases" these six positions cost 1.72 percentage points per year (13.81% on the full count against 12.09% conservative). We do not quietly remove them, because a monthly jump above 200 percent can also be real — a takeover bid, an approval. That is why the conservative figure leads everywhere in this study and the full count sits alongside it, never the other way round.
How we calculated this
- Base metric. Diluted earnings per share from continuing operations. Tag cascade: IncomeLossFromContinuingOperationsPerDilutedShare, EarningsPerShareDiluted, EarningsPerShareBasicAndDiluted, falling back to quarterly net income divided by the weighted diluted share count.
- Source. SEC EDGAR XBRL, the public mandatory filings of the US securities regulator. Point-in-time via the filing date (the "filed" field); on restatements, the first reported value counts.
- The cut-off date is the whole point. Calculations use only quarters that were filed as of the given month end — never from the quarter end. A backtest that uses a figure from its quarter-end date buys weeks too early.
- Q4 rule. The fourth quarter is derived at the net-income level from the annual difference, and only then divided by the share count — a "full-year EPS minus Q1 through Q3" would be wrong under any capital raise, because earnings per share is not additive. 13.59% of quarters are derived this way, because the regulator does not require the fourth quarter to be filed separately.
- Small-base guard. A year-over-year comparison only counts with positive earnings in both the base and signal quarter and a net margin of at least 2 percent in the signal quarter. 20.11% of quarters have no revenue and therefore no margin — they drop out of every variant with a margin rule, never silently counted as "margin high enough".
- Portfolio. Equal-weighted, monthly rebalancing, 0.1 percent cost per side, minimum price $1 on the entry date (measured on the raw price, computed on the adjusted one). Purchases happen on an episode's first signal; a running position is not topped up.
- Delisted stocks are included and stay in the portfolio. If a price series ends mid-period, the position is force-sold at the last price — for the main variant on a twelve-month hold, that affects 2.22% of the 4,240 positions (94 forced sales). That is why this backtest says anything at all.
- Period. January 2013 to July 2026, 163 months. The start in 2013 reflects when machine-readable filing requirements took hold (around 2009) plus the twelve-quarter lookback of this signal's longest window.
- Data base. 6,079 of 6,180 companies with a revenue series also have an earnings series (98.37%) — only that overlap can even be checked against the margin rule.
- Cross-check. The monthly series re-aggregated in the report deviate from the ones stored in the portfolio run by 0 percentage points.
Sources. Quarterly earnings and filing dates come from the public mandatory filings of the US securities regulator (annual reports 10-K and quarterly reports 10-Q, machine-readable via EDGAR). Price series and the S&P 500 Total Return benchmark come from our own holdings, carried over unchanged from the Revenue Inflection Backtest. No network calls during the run.
What this study does not say
- The core arm is thin and top-heavy. Of the 4,240 positions in the main variant on a twelve-month hold, only 473 carry the K class in total (organic, inorganic and unknown combined), of which 436 fall in the above-$100M revenue bracket. The K-organic arm holds a median of 15 stocks per month.
- K is rare because the edge-case rules are strict. If one of the four quiet quarters drops out under the positivity or margin rule, the quiet run can no longer be documented — the company lands in K-jung rather than K. That is why K-jung, with 20,834 signal rows, is six times the size of K's 3,328. Revenue barely had this problem, because revenue is rarely negative.
- 17.93% of signals in the main variant have unknown organic status. "Unknown" is never counted as "organic".
- 13.59% of quarters are derived arithmetically (see methodology) and 20.11% have no margin and drop out of every variant with a margin rule.
- Taxes and trading spreads are absent. Only 0.1 percent cost per side is modelled, nothing else.
- Only monthly jumps above 200 percent were checked. Smaller reverse splits not carried into the adjusted price may still sit inside the conservative figure.
- A backtest is not a forecast. This study is market research, not investment advice and not a buy recommendation.
What we did (not) build from this
No live scanner comes out of this backtest. The fresh earnings inflection stays below or, at best, near the market across the main variant, higher thresholds, a growth cap, stricter confirmation and even without the Covid base effect — unlike the revenue inflection, there is no combination that robustly beats the S&P 500. The real finding of this study is therefore not a new buy rule but a clarification: the EARNINGS inflection on its own is not a viable buy signal. The signal that carries remains the REVENUE inflection — even though the earnings inflection arrives four months earlier in the median.
Readers looking for a growth signal that carried in the backtest will find it in the Revenue Inflection Backtest Study and in the live scanner of the same name.
Frequently Asked Questions
A buy rule in two parts, applied to diluted earnings per share from continuing operations. First, acceleration: the most recent two or more consecutive quarters each grow at least 30 percent against their year-ago quarter. Second, the quiet run before it: the four quarters immediately preceding the first accelerating quarter each grew by less than 15 percent. A year-over-year comparison only counts when both the base quarter AND the signal quarter show positive earnings and the signal quarter's net margin is at least 2 percent — otherwise that quarter counts as neither quiet nor accelerating. Purchases happen at month end, equal-weighted, with 0.1 percent costs per side, and are held for 3, 6 or 12 months depending on the variant, or — in the fourth variant — for as long as the latest reported quarter still sits at least 20 percent above its year-ago quarter, capped at 120 months. A separate second segment, the loss-to-profit turnaround, measures on its own whether a jump out of at least four consecutive loss quarters into at least two profit quarters pays off; there the fourth holding condition works differently — the position is held for as long as the latest reported quarter shows positive earnings, because a growth comparison against a loss quarter would be undefined.
Because a small denominator makes year-over-year comparisons scatter extremely. For revenue, triple-digit growth almost always signals a new, still-undiscovered story; for earnings, the same number can arise simply because a company starts from a very low year-ago profit — a ceiling would not filter out the outliers, it would cut the cohort in half. The counter-test still shows what a ceiling would buy: with a 30-to-70 percent band (variant g2_30_70_r15_m2), the return rises from 6.76% to 10.86% per year on just 74 positions instead of 258 — better, but still below the S&P 500's 15.02%.
No. On the conservative count, the fresh, organically grown earnings inflection returns 6.76% per year (258 positions, twelve-month hold) against 15.02% for the S&P 500 Total Return — and that is the HEADLINE figure of this study (the count excludes positions with a monthly jump above 200 percent suspected of being unrecorded reverse splits). Across all purchases in the main variant combined (4,240 positions), the figure is 12.09% — also below the index. The comparison class of established earnings growers, which were already growing organically before the acceleration, does better: it beats the index at three of the four holding periods (18.32% at three months, 16.67% at six, 17.19% on an open-ended hold) and falls just short only at twelve months, at 14.24%. That is the counterpart of the tested signal, not a verified buy rule.
It is its own segment with its own rule — at least four consecutive loss quarters, then at least two consecutive quarters of newly positive earnings — and it is never combined with the main segment, because a year-over-year comparison is impossible here (the year-ago quarter is a loss by definition). Grown organically it returns 14.43% per year (588 positions, twelve months); across all turnarounds together, including the organically-unclear and inorganic ones, only 10.02% (971 positions) at a maximum drawdown of 42.00% — markedly deeper than the main segment.
The revenue inflection is the signal that carries. Under an identical convention (twelve-month hold, organic, conservative count), the revenue inflection returned 16.56% per year (277 positions) and beat the S&P 500 (15.02%); the earnings inflection stayed clearly behind it at 6.76% (258 positions). And yet the earnings inflection more often arrives first in time: 2,129 companies had an earnings inflection, 2,157 a revenue inflection and 1,050 both — that is 49.32% of the earnings-inflection companies. In the median the earnings inflection led the revenue inflection by 4 months (565 companies led with earnings, 414 led with revenue, 71 on the same month). It arrives earlier — and still pays off worse. A portfolio built from companies with both signals was not tested here; that would be its own study with its own rule.
Because the result does not carry. The fresh earnings inflection stays below or, at best, near the S&P 500 across the main variant, higher growth thresholds, a growth cap, three instead of two confirming quarters, and even with the Covid base effect stripped out — unlike the revenue inflection, there is no robust combination that reliably beats the market. Readers looking for a growth signal that carried in the backtest will find it in the Revenue Inflection Backtest Study.


