Cash-Flow Inflection Backtest: The Fresh Inflection Beats the Field — But Not the Index (13.86% Against 15.02% per Year)
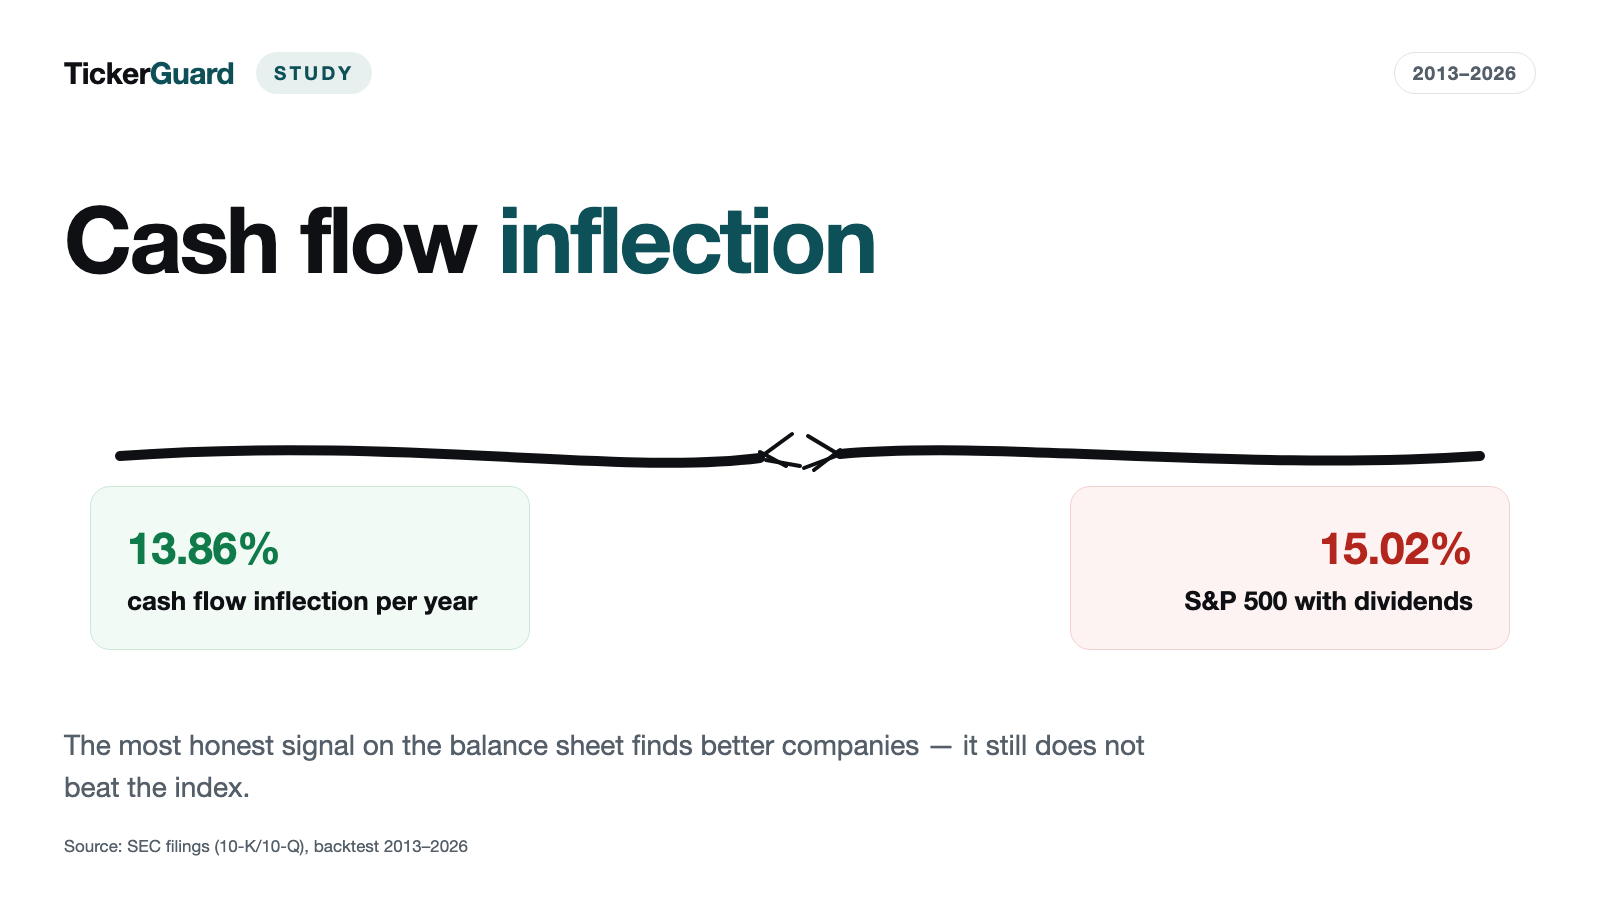
Operating cash flow is often called the most honest number in a filing — cash that actually shows up, not a profit figure that can also be a product of accounting discretion. So we asked the same question we already asked of revenue and of earnings: are companies at the start of a fresh cash-flow story the better long-term buys than established cash-flow growers? Across thirteen and a half years and 1,906 positions in the main variant, the answer is: the fresh inflection finds above-average companies — it clearly beats its own universe and clearly beats established growers. It does not beat the S&P 500 including dividends on the twelve-month headline hold: 13.86% against 15.02% a year. The most honest signal in the family turns out to be no better a buy signal than the index — only an earlier one than the revenue inflection, which it leads by a median of three months.
 Thomas Mücke
Founder & Publisher
Thomas Mücke
Founder & Publisher
The question: is the most honest signal also the better one?
A profit figure can be shaped within limits — depreciation, provisions, one-off items. Operating cash flow is considered the harder currency: money that actually lands in the account. Having already asked the same question of revenue and of earnings, the obvious third question was: are companies at the start of a fresh cash-flow story the better long-term buys than established cash-flow growers — and is the signal, because it is supposedly more honest, also the better one?
The rule this time has three parts:
- Acceleration. The most recent two or more consecutive quarters carry a trailing-twelve-month operating cash flow at least 30 percent above the year-ago figure. Unlike the revenue inflection rule, there is no ceiling here — operating cash flow naturally swings hard enough that a fixed band would have excluded genuine signals. Banded variants run as a sensitivity check.
- A quiet run before it. The four quarters immediately preceding the first accelerating quarter each grew by less than 15 percent.
- Margin gate. The cash-flow margin (trailing cash flow divided by trailing revenue) must additionally be at least 2 percent. Without this gate, a jump from $10,000 to $40,000 would count the same as one from $10 million to $40 million. When the margin is unknown, the signal falls out of the segment — an unknown value satisfies no threshold.
A company meeting the acceleration and margin conditions with all four quiet quarters on record counts as K (fresh inflection). If the history is too short to document the quiet run, it counts as K-young; if at least one prior quarter already grew past the quiet-run limit, it counts as L-old (established grower). Nothing is filtered out — every class is reported, none is dropped.
The result in four numbers
Is operating cash flow, because it is harder to shape than earnings, also the better buy signal once it suddenly accelerates? We tested it on US stocks from 2013 to 2026. Four numbers carry the result:
- 13.86% per year is what the fresh cash-flow inflection returned (arm K, twelve-month hold, 1,906 positions, conservative count) — more than the equal-weighted market as a whole (4.77%) and more than established cash-flow growers (11.51%).
- 15.02% is what the S&P 500 including dividends returned over the same months — 1.16 points ahead of the signal, at a bigger drawdown to boot (−36.41% against −23.87%).
- 3 months is the median lead the cash-flow inflection held over the revenue inflection at the same company (796 against 664 cases, 73 tied, among 1,533 companies with both signals) — the lead did not translate into a higher return: revenue returned 15.05%, more than cash flow.
- 16.56% is what the revenue inflection's published headline figure reached (arm K|org, additionally restricted to organic growth) — cash flow trailed this sharper benchmark too.
In the tested window, the fresh cash-flow inflection identified above-average companies but trailed both the S&P 500 and the revenue inflection.
The result: ahead of the field, behind the index
The headline hold in this study is twelve months — at three and six months the K arm measures a higher return, but on a thinner monthly position count (34 and 66 names in the median, against 132 at twelve months). On the conservative count, i.e. excluding positions with a monthly jump above 200 percent:
| Arm | Positions | Return p.a. conservative | Largest drawdown |
|---|---|---|---|
| Fresh inflection (K) | 1,906 | 13.86% | −36.41% |
| History too short (K-young) | 1,401 | 8.03% | −44.02% |
| Established grower (L-old) | 2,844 | 11.51% | −36.73% |
| All purchases in the backtest | 6,151 | 12.08% | −37.91% |
| S&P 500 Total Return | — | 15.02% | −23.87% |
| Universe, equal-weighted (trimmed mean) | — | 4.77% | −53.23% |
| Universe, median stock | — | −5.45% | −60.68% |
Two statements, and they do not contradict each other: the fresh inflection is the best choice within the rule — it sits 2.35 points ahead of the established grower, 5.83 points ahead of the recent-listing group, and 9.09 points ahead of the universe average. And the fresh inflection does not beat the market — it trails the S&P 500 including dividends by 1.16 percentage points, at a bigger drawdown to boot (−36.41% against −23.87%). Anyone taking a buy rule from this study away would find one that identifies above-average companies — not one that beats the simplest alternative purchase.
All four hold periods at a glance
| Hold period | Positions | Stocks/month (median) | Months with ≤ 2 | Return p.a. | Largest drawdown |
|---|---|---|---|---|---|
| 3 months | 1,918 | 34 | 0 | 15.80% | −34.74% |
| 6 months | 1,915 | 66 | 0 | 16.01% | −32.84% |
| 12 months (headline) | 1,906 | 132 | 0 | 13.86% | −36.41% |
| as long as growth stays ≥ 20% | 1,912 | 110 | 0 | 15.03% | −36.27% |
Over the twelve-month headline hold, arm K stays behind the S&P 500 (13.86% against 15.02%). At three and six months and in the "as long as growth holds" variant, arm K nominally measures more than the index (15.80%, 16.01% and 15.03%) — at three and six months, however, on the much thinner position base shown in the table, and the "as long as growth holds" edge is a single hundredth of a point, statistically meaningless. Twelve months remains the headline hold of this study: it is the most broadly populated hold — and over it, the fresh inflection does not beat the index.
The turnaround: its own chapter, not a buy signal
A second, independent signal does not ask about acceleration but about a turnaround out of negative territory: the trailing cash flow turns positive for at least two quarters after at least four consecutive loss-making quarters. This signal has neither a margin gate nor a freshness class and is never combined with the main segment — different cohort, different sell rule (held as long as the trailing sum stays non-negative).
| Hold period | Positions | Stocks/month (median) | Return p.a. | Largest drawdown |
|---|---|---|---|---|
| 3 months | 1,773 | 31 | 10.99% | −47.68% |
| 6 months | 1,769 | 61 | 12.03% | −42.46% |
| 12 months | 1,750 | 117.5 | 8.21% | −42.48% |
| as long as the trailing sum stays non-negative | 1,758 | 221.5 | 11.39% | −33.75% |
At a twelve-month hold, the bare turnaround out of negative territory returns only 8.21% a year — 5.65 points below the fresh inflection in the main segment and 6.81 points below the S&P 500. Climbing out of deeply negative numbers is, on its own, not a buy signal. By company size the turnaround also splits apart:
| Revenue base | Positions | Return p.a. | Largest drawdown |
|---|---|---|---|
| above $100M | 1,056 | 10.33% | −46.44% |
| $10M to $100M | 460 | −0.22% | −57.64% |
| below $10M | 115 | 9.39% | −65.42% |
| unknown (only possible in the turnaround segment) | 119 | 5.79% | −54.89% |
Cash flow against revenue against earnings: earlier, not better
Three backtests, the same question, the same convention (twelve-month hold, return per year, January 2013 to July 2026, conservative count, "fresh inflection" arm):
| Backtest | Arm | Positions | Return p.a. |
|---|---|---|---|
| Revenue Inflection | K|org (published headline) | 274 | 16.56% |
| Revenue Inflection | K (like-for-like) | 502 | 15.05% |
| Cash-Flow Inflection (this study) | K | 1,906 | 13.86% |
| Earnings Inflection | K|org (published headline) | 258 | 6.76% |
| S&P 500 Total Return | — | — | 15.02% |
The revenue inflection study names arm "K|org" (additionally restricted to organic growth) as its published headline — this backtest collects no organic-growth flag and could not form that arm at all. The fair comparison is therefore the plain arm K on both sides: 15.05% for revenue against 13.86% for cash flow, a gap of 1.19 percentage points. Against the revenue study's published headline figure (16.56%), the gap is 2.70 points. Against the earnings inflection, the cash-flow inflection leads by 7.10 points. Family order: revenue ahead of cash flow ahead of earnings.
Timing is where it gets interesting. Of 3,026 companies with a cash-flow inflection, 1,533 (50.66%) also had a revenue inflection — that is 71.07% of all 2,157 companies with a revenue inflection. Among these 1,533 shared companies, the cash-flow inflection arrives a median of three months before the revenue inflection: cash flow led at 796 companies, revenue led at 664, and 73 tied on the same month. The most honest signal really does lead the revenue inflection — the lead just does not translate into a higher return. An earlier alarm is not automatically a better one.
Robustness: what the rule survives
Early versus late — unlike revenue
The revenue inflection study showed that entering on the third accelerating quarter cost nearly the entire excess return. On cash flow, that is not the case:
| Run | Positions | Return p.a. |
|---|---|---|
| Main variant (early and late entries combined) | 1,906 | 13.86% |
| early entries only (up to the second accelerating quarter) | 1,796 | 13.80% |
| late entries only (from the third accelerating quarter) | 1,495 | 14.04% |
The gap between early and late is just 0.24 percentage points — and late is marginally ahead. Waiting for more confirmation on cash flow costs nothing meaningful; the sharp "act now or miss it" lesson from the revenue inflection does not carry over to cash flow.
Trailing sum versus single quarter
Operating cash flow swings hard from quarter to quarter, which is why the main variant runs on the trailing-twelve-month sum. Run on the single quarter instead:
| Basis | Positions | Return p.a. |
|---|---|---|
| Trailing sum (main variant) | 1,906 | 13.86% |
| Single quarter | 666 | 13.71% |
Smoothing changes the return almost not at all (0.15 percentage points) but nearly triples the hit count (1,906 against 666 positions) — the trailing sum mainly buys signals, without changing their quality.
Threshold variants: the rule does not hinge on fine-tuning
| Variant | What changed | Positions | Return p.a. |
|---|---|---|---|
k2_ge30_r15_m2 (main) | quiet-run limit 15%, margin gate 2%, two quarters, no ceiling | 1,906 | 13.86% |
k2_ge30_r10_m2 | quiet-run limit tightened to 10% | 1,578 | 14.12% |
k2_ge30_r20_m2 | quiet-run limit loosened to 20% | 2,305 | 13.35% |
k2_30_70_r15_m2 | 30–70% ceiling introduced (as in the revenue study) | 558 | 11.92% |
k2_25_80_r15_m2 | 25–80% ceiling introduced | 1,040 | 11.43% |
k3_ge30_r15_m2 | three accelerating quarters required instead of two | 1,495 | 14.04% |
k2_ge30_r15_m0 | margin gate removed (0% instead of 2%) | 1,923 | 13.81% |
k2_ge30_r15_m5 | margin gate tightened (5% instead of 2%) | 1,825 | 13.31% |
eq2_ge30_r15_m2 | single quarter instead of the trailing sum | 666 | 13.71% |
Across all eight dials, the return stays within a range of 11.43% to 14.12% — flat enough to say: the result rests on the core idea, not on an arbitrary fine-tuning. As soon as a ceiling is introduced (as on the revenue inflection), however, the return drops noticeably to 11.4–11.9% — a sign that the missing ceiling on cash flow is not an oversight but itself contributes to the return.
Without the Covid base effect
A company that drew down inventory, halted capital spending and stretched payables in spring 2020 booked a cash-flow jump without a single additional sale — and the drop beforehand supplies the quiet-run condition for free. Excluding all entries between April 2020 and December 2022:
| Arm | Positions | Return p.a. | Largest drawdown |
|---|---|---|---|
| Fresh inflection (K) | 1,481 | 13.46% | −36.41% |
| Established grower (L-old) | 2,178 | 11.88% | −36.73% |
| All purchases in the backtest | 4,823 | 12.11% | −37.91% |
| Turnaround segment (separate cohort) | 1,383 | 11.56% | −37.10% |
| Purchases dropped in the main segment: 1,328 of 6,166 | |||
The finding holds: 13.46% instead of 13.86%, a difference of 0.40 percentage points. The cash-flow edge is therefore not primarily a Covid artifact.
Why the conservative figure is the headline number
Of 1,716,220 position-months in the full dataset, 383 (0.0223%) show a monthly return above 200%. The two largest outliers are demonstrably broken price quotes, not real price moves: CMRF (cik 1498547) computes a +178,440% jump in December 2023, CDFT (cik 1473971) a +42,650% jump in March 2014. Because the portfolio is equal-weighted, the CMRF position alone lifts the "all purchases" arm's monthly return in December 2023 to +341.94% across 537 held names.
| Arm | Full count | Conservative (headline) | Difference |
|---|---|---|---|
| Fresh inflection (K) | 14.37% | 13.86% | −0.51 points |
| History too short (K-young) | 18.66% | 8.03% | −10.63 points |
| Established grower (L-old) | 33.92% | 11.51% | −22.41 points |
| All purchases in the backtest | 32.46% | 12.08% | −20.38 points |
In the "all purchases" arm at a twelve-month hold, these few positions lift the annual return from 12.08% to 32.46% — a twenty-point gap that rests almost entirely on two broken price series. The K arm itself is barely affected: 13.86% on the conservative count against 14.37% on the full count, a difference of just 0.51 points — the outliers sit mostly in L-old and K-young. That is exactly why the conservative count is the headline number throughout this study, with the full count standing alongside it, never in its place.
How we calculated this
- Universe and period. US stocks, January 2013 to July 2026, 163 months.
- Cut-off date. Calculations use only quarters that had been filed with the SEC as of the given month-end — never quarters used from their period-end date. The filing date sometimes lags well behind the paper filing date (dimensioned tags, a switch to the continuing-operations variant); this only makes the backtest more conservative, buying later, never earlier.
- Delisted stocks are included and stay in the portfolio. If a price series ends mid-period, the position is force-sold at the last available price (0.1% cost per side, $1 minimum price on the raw quote, calculated on the adjusted price). A parallel worst-case calculation runs throughout, in which a forced sale costs −100%.
- Operating cash flow is a cumulative SEC figure. The SEC requires it as a year-to-date sum, not a discrete quarter. A quarterly figure is therefore almost always computed as the difference between two reported cumulative values — true for 73.28% of the quarters used (only 15.02% for the revenue inflection). Any filing error in either cumulative value flows through to the computed quarter, arithmetically, not as reported.
- 217 companies without a complete trailing sum. A fiscal year built from 12-12-12-16 weeks (among others PepsiCo, Domino's Pizza, AutoZone and roughly fifty more) never has a quarter inside the 70-to-100-day window and therefore never forms a complete trailing sum — such companies fall out of the signal set.
- 640 companies without a revenue series. Without a revenue series the cash-flow margin is unknown, and an unknown value satisfies no threshold. These companies can never receive an inflection signal, only a turnaround.
- No monotonicity check. Unlike revenue, the trailing cash-flow sum is allowed to fall if a single quarter burns cash — that is not a data inconsistency, it is real business. An independent sample of 290 quarters checked against the original 10-Qs found 0 cases where this let a later-restated value into the dataset.
- Aggregation check. The monthly series re-aggregated in the report deviate from the ones stored by the portfolio run by 0.000000000 percentage points.
Sources. Quarterly operating cash-flow figures and filing dates from the US Securities and Exchange Commission's public filings (annual reports on Form 10-K and quarterly reports on Form 10-Q, machine-readable via EDGAR/XBRL). Monthly prices, quarterly revenue figures (the denominator of the cash-flow margin and the basis of the size classes) and the S&P 500 Total Return benchmark come from our own dataset, carried over unchanged from the earlier backtests in this series. No network calls during the run.
What this study does not say
- The main arm K is solidly populated at 132 names in the median per month — thinner at three- and six-month holds.
- 73.28% of cash-flow quarters are computed from two cumulative values, not reported as discrete quarters. A filing error in either value flows through in full.
- 217 companies with 16-week fiscal quarters and 640 companies without a revenue series can never receive an inflection signal. Both groups are excluded from the signal set, not folded in on a best-effort basis.
- The timing of the cash-flow inflection correlates with the revenue inflection but does not replace it. Only 50.66% of cash-flow inflections even have a revenue inflection at the same company.
- Taxes and trading spreads are not modeled. The only cost applied is 0.1% per side.
- Only monthly jumps above 200% were checked. Smaller price errors may still sit inside the conservative figure.
- A backtest is not a forecast. This study is market research, not investment advice and not a buy recommendation.
Why this study did not become a live scanner
The revenue inflection backtest turned into a live scanner because that signal held a narrow but real edge over the index. For the cash-flow inflection we deliberately built none: the fresh inflection finds above-average companies but misses the S&P 500 by 1.16 percentage points on the twelve-month headline hold, at a markedly larger drawdown. Shipping a scanner around a signal that does not beat the simplest alternative purchase would be a distraction, not a tool. This study stays what a backtest is meant to be: an honest answer, even when that answer is "not good enough."
Frequently Asked Questions
A buy rule in three parts: the most recent two or more quarters carry a trailing-twelve-month operating cash flow at least 30 percent above the year-ago figure (no ceiling), the four quarters before that each grew by less than 15 percent, and the cash-flow margin must be at least 2 percent. Purchases happen at month end, equal-weighted, with 0.1 percent costs per side, held for 3, 6 or 12 months or for as long as growth stays at least 20 percent.
Operating cash flow naturally swings harder than revenue — tax dates, inventory cycles, payment terms can double it in the short run without the business changing at all. A fixed ceiling would have arbitrarily excluded genuine signals here. The sensitivity check confirms this: as soon as a ceiling is introduced, the return drops noticeably (to 11.4–11.9%) — the missing ceiling is not an oversight, it contributes to the return.
Because 383 of 1,716,220 position-months (0.0223%) show a monthly return above 200% — and two of them are demonstrably broken price quotes (CMRF December 2023, CDFT March 2014). They lift the "all purchases" arm's annual return from 12.08% to 32.46%. The K arm is barely affected (13.86% against 14.37%), but the distortion elsewhere is too large to ignore.
Not over the headline hold. At a twelve-month hold, the fresh cash-flow inflection returns 13.86% a year on the conservative count, against 15.02% for the S&P 500 including dividends — a 1.16-point gap, at a larger drawdown (−36.41% against −23.87%). The signal finds better companies than the market average, but not ones that beat the simplest alternative purchase.
Yes, but it does not help the return. Among the 1,533 companies with both signals, the cash-flow inflection arrived a median of three months before the revenue inflection (796 against 664 cases, 73 tied). Even so, the revenue inflection leads in the return ranking (15.05% to 16.56% against 13.86% for cash flow) — an earlier alarm is not a better one here.
Not on its own. Companies whose trailing cash flow turns positive for the first time after four loss-making quarters return only 8.21% a year at a twelve-month hold — well below both the fresh inflection in the main segment (13.86%) and the S&P 500 (15.02%). Climbing out of the red is not enough by itself.
Because the signal does not beat the index over the headline hold. Unlike the revenue inflection, which kept a narrow edge over the S&P 500, the cash-flow inflection misses the market by 1.16 percentage points at a bigger drawdown. We do not ship a scanner around a signal that trails the simplest alternative purchase.


