Accruals Backtest: Sloan's Paper-Profit Signal Has Been Gone Since 2013
Richard Sloan showed in 1996 that profits made of accounting entries hold up worse than profits made of real cash flow — and that a portfolio long the lowest accruals and short the highest earned 10.4 percent of abnormal return in the following year, positive in 28 of 30 years. We recomputed the question for US stocks from 2000 to 2026, with delisted companies left in the cross-section and with no regard for whether we like the answer. We do not: across the full cross-section the classic measure no longer carries, and in the second half of the window it inverts. What remains is a quality gauge, not a return machine — and a practical test that honestly ends at zero.
 Thomas Mücke
Founder & Publisher
Thomas Mücke
Founder & Publisher
The question: what is a profit made of?
Net income is not a sum of money. It consists of two very different parts: cash that actually moved, and accounting entries — invoices issued but not yet paid, inventory built up, development costs capitalised, provisions estimated. The second part is called accruals. It is neither forbidden nor even suspicious; without it there would be no accounting at all. But it is softer than cash.
In 1996 Richard Sloan asked an uncomfortable question about it: if a profit consists mostly of accounting entries — does it last as long as a profit that came in through the operating business? And if not, does the market notice?
His answer, across 40,679 firm-years on NYSE and AMEX between 1962 and 1991, was no twice over. The accrual component of earnings held up measurably worse than the cash component — a persistence of 0.765 against 0.855 — and the market priced both parts almost identically. Buying the companies with the lowest accruals and shorting those with the highest earned 10.4 percent of abnormal return in the following year, positive in 28 of 30 years. More than 40 percent of that return — measured across the years 1973 to 1991 — landed in the handful of trading days around the next four quarterly reports — where the truth came out.
It is one of the most cited papers in capital-market research. That is precisely why we recomputed it: a signal that worked for thirty years and then became famous is the best conceivable test of whether fame eats a signal.
The result in four numbers
Do profits made mostly of accounting entries rather than real cash flow really hold up worse? We recomputed Richard Sloan's 1996 accrual anomaly on US stocks from 2000 to 2026. Four numbers carry the result:
- −1.07 pp is the spread between the lowest- and highest-accrual group across the full cross-section over the entire window — and it points the wrong way.
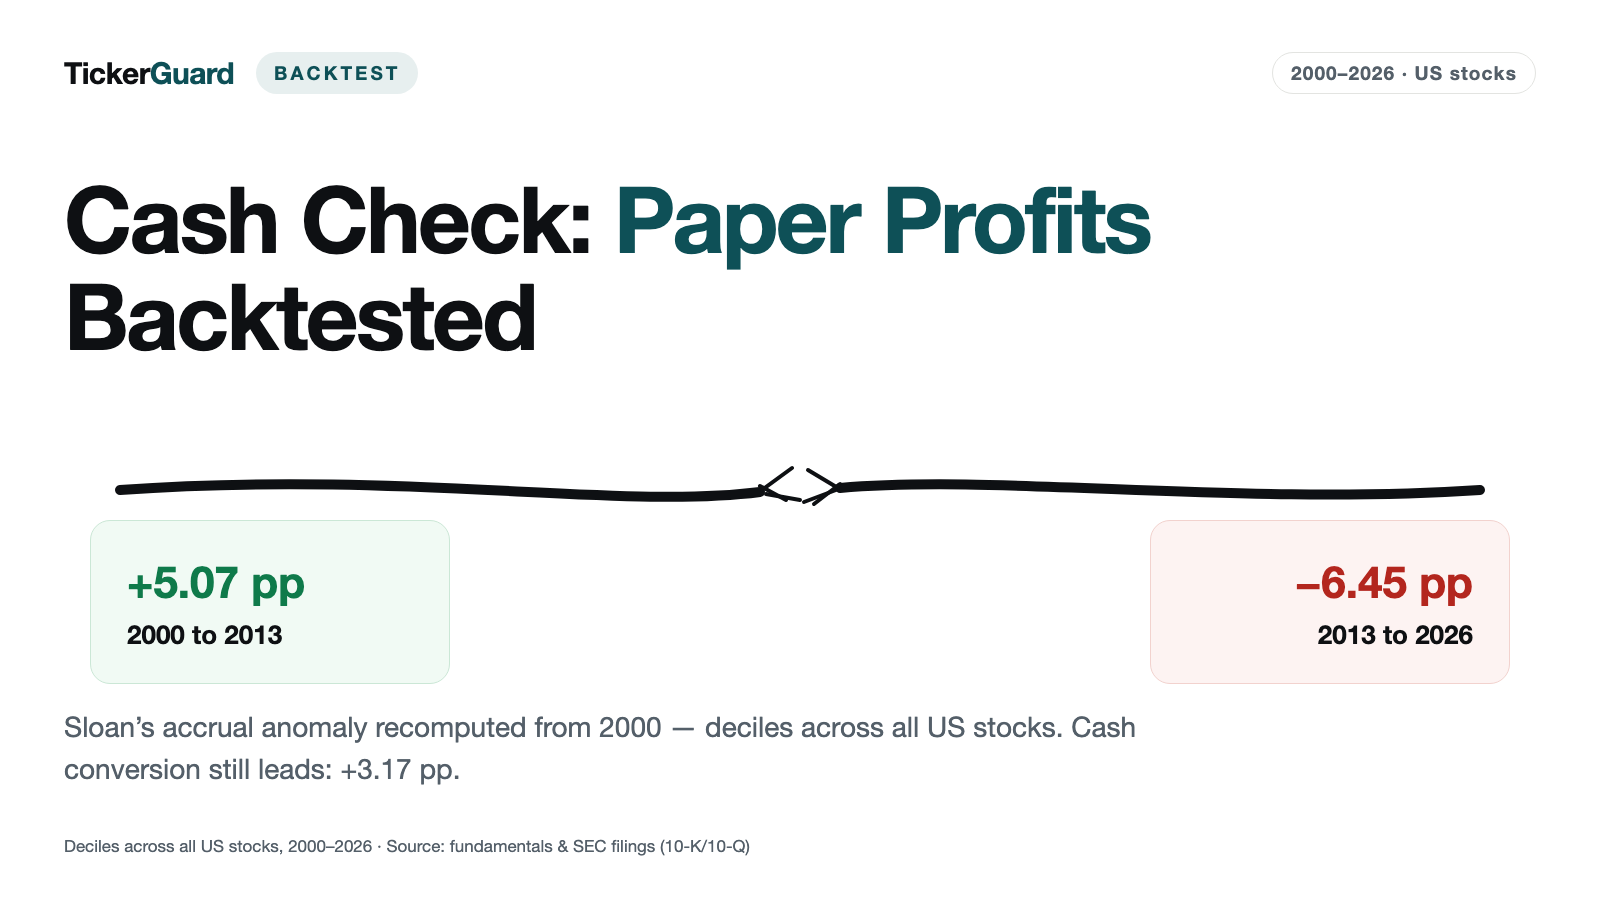
- +5.07 pp was that same spread from June 2000 to June 2013: up to then the classic measure behaved exactly as advertised.
- −6.45 pp is the spread from June 2013 to June 2026 — the anomaly is not weaker since it became famous, it is gone.
- +3.17 pp is what the simpler cash-conversion measure delivered across the whole period instead, positive in both halves.
Over the tested window the classic accrual measure no longer carried overall, while the simpler cash conversion kept separating the field throughout.
The result: across the full cross-section the measure no longer carries
Every year at the end of June we sort all measurable US stocks by their accrual value into ten equal groups, buy each group equal-weighted and hold for twelve months. Group 1 holds the lowest accruals — the better profits, according to Sloan — and group 10 the highest. If the anomaly is alive, group 1 has to lead and the series has to fall away cleanly.
| Group | full cross-section | companies above $100M revenue only | share above $100M in the full cross-section |
|---|---|---|---|
| 1 | 8.88% | 15.02% | 48.53% |
| 2 | 12.07% | 14.11% | 72.10% |
| 3 | 12.82% | 13.47% | 79.99% |
| 4 | 12.91% | 12.54% | 82.51% |
| 5 | 12.46% | 11.99% | 84.61% |
| 6 | 12.44% | 13.04% | 82.63% |
| 7 | 11.14% | 12.19% | 74.69% |
| 8 | 10.20% | 10.27% | 61.00% |
| 9 | 10.19% | 11.10% | 59.88% |
| 10 | 9.95% | 11.34% | 53.10% |
| group 1 minus group 10 | −1.07 pp | +3.68 pp | — |
| rank correlation of the staircase | 0.32 | 0.89 | — |
It does not. Across the full cross-section group 1 comes in at 8.88% per year and group 10 at 9.95% — a spread of −1.07 percentage points, pointing the wrong way. The highest return of the whole series sits not at an edge but in the middle, at group 4.
Restrict the cross-section to companies with at least $100M in revenue and the picture flips back: 15.02% against 11.34%, a spread of 3.68 percentage points, and the staircase runs almost monotonically at a rank correlation of 0.89. The last column of the table explains why. In the lowest-accrual group only 48.53% of members reach $100M in revenue at all; in the middle of the distribution it is 84.61%. Extreme accrual values arise where the denominator is small — the edge groups of the full cross-section are filled with micro caps whose figures carry more noise than signal.
For context: the S&P 500 including dividends returned 8.50% per year in the same window, the equal-weighted universe 10.20%. So across the full cross-section the lowest-accrual group beats the index but not the equal-weighted average — and that average is the yardstick an equal-weighted selection method has to be measured against.
| Series | return p.a. | June 2000 to June 2013 | June 2013 to June 2026 | largest drawdown |
|---|---|---|---|---|
| S&P 500 Total Return | 8.50% | 2.71% | 14.61% | 50.95% |
| Universe, equal-weighted | 10.20% | 12.29% | 8.15% | 53.27% |
| S&P 500 price index (excluding dividends) | 6.51% | — | — | — |
| Nasdaq 100 price index (excluding dividends) | 8.35% | — | — | — |
The real finding: the anomaly has been gone since it became famous
An average over 26 years can hide two opposing halves. We therefore split the window down the middle — June 2000 to June 2013 and June 2013 to June 2026 — and ran the same calculation twice.
| Measure | Stretch | Group 1 | Group 10 | Spread | Rank correlation |
|---|---|---|---|---|---|
| Accruals, full cross-section | June 2000 to June 2013 | 19.33% | 14.26% | +5.07 pp | 0.87 |
| Accruals, full cross-section | June 2013 to June 2026 | −0.65% | 5.81% | −6.45 pp | −0.03 |
| Accruals, above $100M revenue | June 2000 to June 2013 | 20.25% | 13.30% | +6.95 pp | 0.88 |
| Accruals, above $100M revenue | June 2013 to June 2026 | 10.02% | 9.42% | +0.60 pp | 0.22 |
| Cash conversion, full cross-section | June 2000 to June 2013 | 16.02% | 13.26% | +2.76 pp | 0.73 |
| Cash conversion, full cross-section | June 2013 to June 2026 | 11.13% | 7.57% | +3.56 pp | 0.60 |
The result is the core of this study. In the first half the classic accrual measure behaves exactly as advertised: a spread of +5.07 percentage points at a rank correlation of 0.87, a clean staircase. In the second half it is not only the spread that has vanished but the ordering itself: −6.45 percentage points at a rank correlation of −0.03. That is no longer a weakened signal; that is no signal.
The tidier cross-section above $100M in revenue shows the same arc, only milder: from +6.95 to +0.60 percentage points, with the rank correlation falling from 0.88 to 0.22. So the break is not caused by the micro caps. It sits in time.
This matches the academic literature, and strikingly closely. Green, Hand and Soliman reported in Management Science in 2011 that the hedge returns of the accrual strategy in the US were
"on average, no longer reliably positive"
In 2014 Mohanram measured a decline from 18.2% to 7.2% per year for a related measure — the change in net operating assets — between the decades 1991–2000 and 2001–2010, dating the break to around 2003 — in parallel with the arrival of analyst cash-flow forecasts, which made public precisely the information the signal lived on. And McLean and Pontiff showed in the Journal of Finance in 2016 that published capital-market signals lose an average of roughly 58 percent of their return after publication.
Our measurement is therefore not an outlier but an independent confirmation on a different data set, a different period, and with a different construction of the same measure.
What remains: cash conversion still separates the field
Sloan's measure is not the only one. The older and simpler one is called cash conversion: operating cash flow divided by net income. It answers the same question in plain language — how much of every dollar of profit actually came in as money? Sloan himself quotes Leopold Bernstein on it:
"the higher the ratio of CFO to net income, the higher the quality of that income"
Because the ratio becomes useless with a negative denominator, we compute it only for companies with positive net income; that group is smaller and on average healthier than the full cross-section.
| Group | full cross-section | companies above $100M revenue only | share above $100M in the full cross-section |
|---|---|---|---|
| 1 | 13.55% | 13.74% | 82.36% |
| 2 | 13.33% | 13.29% | 86.87% |
| 3 | 13.34% | 13.70% | 88.04% |
| 4 | 12.22% | 11.67% | 87.08% |
| 5 | 11.51% | 12.24% | 85.59% |
| 6 | 11.67% | 11.06% | 83.74% |
| 7 | 12.31% | 11.66% | 83.36% |
| 8 | 12.02% | 11.76% | 77.32% |
| 9 | 9.48% | 10.74% | 66.90% |
| 10 | 10.38% | 11.65% | 56.74% |
| group 1 minus group 10 | +3.17 pp | +2.09 pp | — |
| rank correlation of the staircase | 0.83 | 0.82 | — |
Here the signal holds. Across the whole period the spread is 3.17 percentage points at a rank correlation of 0.83 — and unlike the accrual measure it is positive in both halves: +2.76 percentage points up to 2013, +3.56 after. The one part of Sloan's finding that survived the passage of time in our data is the simplest one.
The table also shows why the conversion measure is more robust: even in its weakest group 56.74% of members reach $100M in revenue, and in the group with the highest cash coverage 82.36%. Requiring a positive profit throws out the most extreme micro-cap cases from the start.
The practical test: as a buy filter it delivers zero
A finding in the cross-section is not yet an investment decision. The practically interesting question is: does an already working recipe get better if you skip paper-profit companies at the point of purchase? We tested that on our best existing recipe — the seven-point rule from the growth backtest, once in its base form (E7) and once in the version with a stop (SB15). The rule of the test is deliberately simple: skip the purchase if the stock sits in the worst accrual third in the month of the buy. Purchases only, never sales — an open position is left alone.
| Run | return p.a. | largest drawdown | purchases | fewer purchases | candidates rejected | hit rate |
|---|---|---|---|---|---|---|
| base version, no block | 14.38% | 53.08% | 7,942 | — | — | 56.64% |
| base version, with accrual block | 14.29% | 51.63% | 5,322 | 2,620 | 27,800 | 56.22% |
| with stop, no block | 15.58% | 51.50% | 9,579 | — | — | 47.49% |
| with stop, with block | 15.53% | 51.02% | 6,449 | 3,130 | 28,191 | 46.14% |
The result is a clear nothing. The return falls from 14.38% to 14.29% per year, and in the version with a stop from 15.58% to 15.53%. In exchange, 2,620 and 3,130 purchases respectively disappear — a third of the trading. The largest drawdown becomes 1.45 percentage points milder (51.63% instead of 53.08%), and 0.48 points in the second version. A third fewer purchases, practically the same return and a barely measurable calmer ride — that is not a filter, that is an effort.
Two reading notes on the table. The column "candidates rejected" counts stock-months, not prevented purchases: a blocked stock is rejected afresh every month it stays in the worst third. The real effect sits in the column "fewer purchases". And the block bites almost without gaps — only 0.11% of the candidates examined had no accrual value at all and therefore passed unfiltered.
The obvious explanation: a good growth recipe already filters on criteria that correlate with earnings quality. What the accrual block additionally removes, the recipe would in many cases not have bought anyway — and what it does additionally prevent costs roughly as much return as it saves.
Counter-test: what if every delisting were a total loss?
The main run exits a disappeared stock at its last known price. That is the friendly assumption. The unfriendly one is: every delisting ends at zero. The truth lies in between — a delisting is sometimes a takeover at a premium and sometimes a bankruptcy. Both extremes show how much the result hangs on it.
| Measure | Assumption | Group 1 | Group 10 | Spread | Rank correlation |
|---|---|---|---|---|---|
| Accruals | last known price | 8.88% | 9.95% | −1.07 pp | 0.32 |
| Accruals | total loss | 4.92% | 4.97% | −0.05 pp | 0.25 |
| Cash conversion | last known price | 13.55% | 10.38% | +3.17 pp | 0.83 |
| Cash conversion | total loss | 9.70% | 3.46% | +6.24 pp | 0.75 |
For the accrual measure the already negative spread dissolves into nothing (−0.05 percentage points). For the conversion measure, by contrast, it grows from 3.17 to 6.24 percentage points: the groups with the worst ratio of cash flow to profit lose the most under the hard assumption — group 9 gives up 7.63 percentage points, group 10 gives up 6.92. That fits the substance — companies whose profit is not backed by money disappear from the exchange more often. The study's message is not reversed by this, it is sharpened.
Where the cash check sits in our backtest family
This study is the fourth part of a series around the question of which revenue and profit characteristics carried a stock in hindsight. The best known part is the revenue inflection backtest, and comparing the headline numbers is tempting. It is only conditionally admissible, though, so here it comes with a warning sign:
| Backtest | Window | Return p.a. | Benchmark over the same window (S&P 500 TR) | Role |
|---|---|---|---|---|
| Revenue inflection, fresh signal (organic, 12 months) | 2013 to 2026 | 26.28% (conservative 16.56%) | 15.02% | selection recipe |
| Cash check, best accrual group (above $100M revenue) | 2000 to 2026 | 15.02% | 8.50% | quality building block |
| Cash check, best conversion group (full cross-section) | 2000 to 2026 | 13.55% | 8.50% | quality building block |
The two calculations run over different windows. The revenue inflection measures 2013 to 2026, the cash check 2000 to 2026 — and almost the entire return gap sits in that difference: the S&P 500 including dividends returned 15.02% per year in the shorter window and only 8.50% in the longer one. Putting the 26.28% of the revenue inflection next to the 15.02% of the best accrual group compares market phases far more than it compares signals. That 15.02% appears twice in the table is a coincidence of rounding: once as the index over the short window, once as the best accrual group over the long one.
The roles within the family differ anyway. The revenue inflection is a selection recipe: it says what one might buy. The cash check is a quality building block: it says how to judge a profit already in front of you. This study therefore deliberately produces no live screener — a signal that inverts in the second sub-period and delivers zero as a buy filter does not belong in a list that proposes purchase candidates.
How we calculated
- Universe and period. US stocks, formed at the end of June from 2000 to 2025, returns measured from June 2000 to June 2026. Depending on the measure, the cross-section covers between 1,106 and 6,129 companies per year; for the full accrual measure it is 1,793 to 6,129.
- The accrual measure. Net income minus operating cash flow, divided by average total assets from the current and the preceding fiscal year. Deriving it from the cash flow statement follows Hribar and Collins (2002), who showed that the detour via balance-sheet changes produces systematic measurement error around acquisitions, divestitures and currency translation. Sloan himself worked from the balance sheet, because the cash flow statement was only mandatory in the last four of his thirty years.
- A deliberate deviation from Sloan. Sloan's "earnings" is income from continuing operations, not net income. We use net income, because it is defined identically for every company and every year in our data. The two differ by special items; our figures are therefore not comparable to his digit for digit.
- The conversion measure. Operating cash flow divided by net income, only for companies with positive net income. With a negative denominator the ratio is meaningless, not merely ugly.
- Portfolio. Ten equal groups, equal-weighted, twelve months holding period, 0.1 percent costs per order, $100,000 of starting capital per group. Disappeared stocks stay in the portfolio until their last price.
- Freshness of the figures. A set of accounts counts only if it was at most 18 months old at the formation date and already available on that date. Minimum total assets $1M, to exclude empty shells.
- Robustness variant. The same calculation restricted to companies above $100M in revenue — the threshold above which revenue figures become dependable in our other backtests.
Sources. Annual accounts and filing dates from the mandatory public filings with the US securities regulator (10-K and 10-Q, machine-readable via EDGAR). Monthly prices and the S&P 500 Total Return benchmark from our own data. The academic literature cited: Sloan, R. G. (1996), "Do Stock Prices Fully Reflect Information in Accruals and Cash Flows about Future Earnings?", The Accounting Review 71(3), 289–315; Hribar, P. / Collins, D. W. (2002), "Errors in Estimating Accruals", Journal of Accounting Research 40(1), 105–134; Lev, B. / Nissim, D. (2006), "The Persistence of the Accruals Anomaly", Contemporary Accounting Research 23(1); Green, J. / Hand, J. R. M. / Soliman, M. T. (2011), "Going, Going, Gone? The Apparent Demise of the Accruals Anomaly", Management Science 57(5), 797–816; Mohanram, P. (2014), "Analysts' Cash Flow Forecasts and the Decline of the Accruals Anomaly", Contemporary Accounting Research 31(4), 1143–1170; McLean, R. D. / Pontiff, J. (2016), "Does Academic Research Destroy Stock Return Predictability?", Journal of Finance 71(1).
How complete the data is
Of 185,030 firm-years examined, 151,634 were measurable — 81.95 percent. The rest fell out for traceable reasons:
| Reason | Firm-years | Share |
|---|---|---|
| accounts older than 18 months | 4,459 | 2.41% |
| net income missing | 8,614 | 4.66% |
| operating cash flow missing | 4,074 | 2.20% |
| total assets missing | 1,927 | 1.04% |
| operating cash flow exactly zero | 257 | 0.14% |
| net income exactly zero | 116 | 0.06% |
| prior-year accounts missing | 11,290 | 6.10% |
| total assets below $1M | 2,659 | 1.44% |
| measurable | 151,634 | 81.95% |
More important than the reasons is how they distribute over time. Of the stock-years with prices, 93.52% are measurable among companies still listed today, but only 38.34% among those that have disappeared. The cross-section therefore favours survivors, and the result flatters rather than punishes. That applies to every group equally and so reverses no ranking — but it limits how seriously the absolute returns can be taken.
What this study does not say
- It is not a replication of Sloan. Different period, different universe, different construction, different earnings figure. Wherever our numbers deviate from his, both remain possible: a real change, or a difference in setup.
- The formation date is a convention, not a measurement. Sloan forms at the end of April, we at the end of June. The date determines how old the figures used are on average.
- Only 61.4% of periods carry a real filing date. For the rest we assume the fiscal year end plus 90 days. Where the filing actually came later, the backtest works with a number that did not yet exist on the cut-off date.
- Monthly grid. Purchases and sales always fall on a month end. A real portfolio would have traded at different prices.
- The equal-weighted universe is the stricter yardstick, not the fairer one. It runs without costs and reweights monthly, while the group portfolios pay 0.1 percent twice a year and sit through twelve months — roughly two tenths of a point per year in favour of the comparison series.
- Currency. Around 94 percent of the data is denominated in US dollars. The $100M revenue threshold and the minimum total assets act on the reported amount, without conversion.
- All figures are in-sample. Thresholds, formation date and the staleness limit were not confirmed on a separate period.
- A backtest is not a forecast. This study is market research, not investment advice and not a recommendation to buy.
What we take from it
Three sentences. First: the most famous version of this signal — accruals across the full US cross-section — stopped working in our window from 2013 onwards, and that is not a measurement glitch but a process described repeatedly in the literature. Second: the plain question "how much of the profit arrived as money?" still separates the field, in both halves of the period, and so remains a sensible thing to ask of any single set of accounts. Third: laid on top of an already good recipe as a buy filter, it delivers nothing — we measured it and we publish the result, even though it is not one.
That is exactly what we run these backtests for. A signal that does not carry is a result; showing only the hits is advertising, not research.
Frequently Asked Questions
The part of profit that never arrived as money. Profit comes from two sources: real cash flow and accounting entries — invoices issued but unpaid, inventory built up, costs capitalised. We measure them as net income minus operating cash flow, divided by average total assets. A high value means the profit is on paper, not in the bank.
He studied 40,679 firm-years on NYSE and AMEX from 1962 to 1991. The accrual component of earnings held up worse than the cash component (persistence 0.765 against 0.855), yet the market priced both almost identically. A portfolio long the lowest accruals and short the highest earned 10.4 percent of abnormal return in the following year — positive in 28 of 30 years.
For three reasons. First the period: we start in 2000, Sloan ends in 1991 — and the anomaly became famous in between. Second the cross-section: Sloan had NYSE and AMEX, we have the whole US market including very small companies. Third the method: we build accruals from the cash flow statement, as Hribar and Collins recommended in 2002, while Sloan derived them from balance-sheet changes.
As a simple excess-return machine across the full US cross-section: yes, in our window from 2013 onwards. As a quality gauge: no. Cash conversion separates the field in both halves of the period (+2.76 and +3.56 percentage points), and the literature describes the same arc — Green, Hand and Soliman (2011), Mohanram (2014), and McLean and Pontiff (2016), who measure an average loss of roughly 58 percent of a published signal's return after publication.
Because extreme accrual values arise where the denominator is small. In the lowest-accrual group only 48.53% of members reach $100M in revenue; in the middle of the distribution it is 84.61%. The edge groups are therefore filled with micro caps whose figures carry more noise than signal. Restricted to companies above $100M in revenue, the rank correlation of the staircase is 0.89 instead of 0.32.
Little as a standalone recipe, more as a question to ask. Applied to our best existing recipe, the accrual block is ineffective: 14.29% instead of 14.38% per year with 2,620 fewer purchases. Anyone using the cash check should use it as a warning light on a single company — a profit without matching cash flow needs an explanation — not as a selection criterion for a whole portfolio.
They flatter rather than punish. Of the stock-years with prices, 93.52% are measurable among companies still listed today, but only 38.34% among those that have disappeared. The cross-section therefore favours survivors. In addition, only 61.4% of periods carry a real filing date; for the rest we assume the fiscal year end plus 90 days.


