Growth Gems Backtested: 13.17% a Year Since 2000 — and Why the Strictest Rule Loses
Our Growth Gems stock scanner awards one point per criterion met, ten in total. We retested that score rule across the entire US market from January 2000 through July 2026 — survivorship-free across 22,871 stocks, 16,472 of which no longer trade. The portfolio buying at nine points and above returned 13.17% a year, the strictest portfolio produced the worst result of all, and one finding matters more than any single threshold: the score sorts.
 Thomas Mücke
Founder & Publisher
Thomas Mücke
Founder & Publisher
Our Growth Gems stock scanner scores every US company from zero to ten points, one point for each of ten criteria met, covering how fast a company grows, whether that growth is honestly earned, and how well it is backed by the balance sheet. We wanted to know whether that score rule actually holds up as an investing rule rather than just a screening tool, so we turned it into three separate portfolios and ran them, month by month, across the entire US stock market since the year 2000.
The headline result: the portfolio that buys once a company reaches 9 out of 10 points and sells as soon as the score drops below that mark returned 13.17% a year from January 2000 through July 2026, turning a starting stake of $100,000 into $2,652,359. Over the same span, the S&P 500 returned 6.55% a year. What that comparison does and does not prove is what the rest of this study works through.
The universe behind the test is 22,871 US stocks, and 16,472 of them — 72.02% — are delisted today: bankruptcies, takeovers, and quiet exits from the exchange. All of them stay in the sample for as long as they actually traded and reported numbers, which makes the test survivorship-free. Counting only the stocks that happen to still be listed today would flatter the past. The test runs from January 2000 through July 2026, 319 month-end dates, roughly 26.5 years, starting with $100,000 and charging trading costs of 0.1% of order volume on every buy and every sell. Trades execute at the closing price of the month in which the signal appears, and all prices are dividend-adjusted.
Every number in this study is read directly from fundamental data and SEC filings — annual reports (10-K) and quarterly reports (10-Q) — combined with the historical price series of our own research base.
The result in four numbers
Does the score from our Growth Gems scanner hold up as a buy rule, or is it just a tidy way to rank stocks? We tested it across three portfolios with different buy thresholds against the market — plus a check against an added AI quality filter. Four numbers carry the result:
- 13.17% a year is what Portfolio A (buying from 9 out of 10 points) returned from January 2000 through July 2026 — turning $100,000 into roughly $2.65 million.
- 6.55% a year is what the S&P 500 returned over the same span, with the Nasdaq 100 at 8.12% — though both benchmarks are price indices without dividends while the portfolios trade dividend-adjusted prices, which tilts the comparison slightly in the portfolios' favour.
- 6.79% a year is all the strictest rule managed: Portfolio B buys only at a full score and sat entirely in cash in 100 of the 319 months, holding just 1.33 positions on average.
- 14.59% a year is what the unfiltered baseline of the 200-stock AI-review sample returned — an added AI quality filter did not improve on that (excluding red verdicts: 14.28%; green verdicts only: 14.49%).
Within the tested window, the score sorted results: the portfolios buying from 8 or 9 points out of 10 finished ahead of both benchmark indices, while neither the strictest possible threshold nor an added AI filter improved the outcome.
What the scanner checks: ten criteria, one score
The ten checks behind the Growth Gems score fall into three groups, and every one of them is worth exactly one point.
Speed, and the quality of that speed. A company earns a point if revenue grew by more than 15% a year over the last three years, if more than 10% revenue growth is expected for the coming year, if revenue growth plus free-cash-flow margin add up to at least 40 — a shorthand known as the "Rule of 40" — and if the gross margin sits at 40% or higher without meaningful erosion. These four checks ask a single question from four angles: is the company actually growing fast, and is that growth profitable enough to be worth having?
Is the growth honestly earned? Fast growth can be bought in ways that hurt shareholders later, so three checks look for the usual shortcuts. A point requires that the share count grows by less than 3% a year, so growth is not funded by printing ever more stock; that goodwill from acquisitions does not grow faster than revenue, so the company grew rather than shopped its way to the top line; and that operating cash flow covers the profits of the last three years, so the reported profit is backed by actual cash rather than by accounting choices.
Backing. The last three checks ask what happens if growth slows. A point goes to companies with net debt below twice EBITDA, so a rough patch does not turn into a debt problem; to a return on capital employed of 15% or more, or one that has risen compared with two years ago; and to companies where insiders hold at least 10% of the shares or have been net buyers — a sign that the people who know the business best have their own money in it.
One rule applies to all ten: if the figures needed for a criterion are missing, it counts as neither passed nor failed, and a score is only assigned once at least seven of the ten criteria can actually be judged. A company with too many gaps in its filings simply gets no score at all — and without a score, it is never bought.
The three portfolios
We turned the score into three separate portfolios that differ in nothing but where the buy-and-sell line is drawn.
Portfolio A buys from 9 out of 10 points and sells as soon as the score drops below 9. Portfolio B is the strictest: it buys only when a company reaches the full 10 out of 10 and sells the moment even a single point is lost. Portfolio C buys from 8 out of 10 points — the same threshold our live Growth Gems scanner uses today — and sells as soon as the score drops below 8.
Every other rule is identical across the three: same universe, same starting capital, same order costs, same trading at the month-end close. The only variable is how strict the entry has to be, which lets us ask a clean question — does a stricter score threshold actually buy you a better result? The headline table below gives the first answer.
| Measure | Portfolio A | Portfolio B | Portfolio C | S&P 500 | Nasdaq 100 |
|---|---|---|---|---|---|
| Rule | Buy from 9 out of 10 points | Buy only at 10 out of 10 points | Buy from 8 out of 10 points | Price index, no dividends | Price index, no dividends |
| From $100,000 to | $2,652,358.74 | $570,464.94 | $2,311,684.10 | $537,105.75 | $791,983.28 |
| Return p.a. | 13.17% | 6.79% | 12.58% | 6.55% | 8.12% |
| Worst drawdown | −52.13% | −41.1% | −46.18% | −52.56% | −81.07% |
| Win rate per trade | 58.92% | 53.45% | 56.58% | — | — |
| Buys and sells | 1,954 | 117 | 7,277 | — | — |
| Completed round trips | 947 | 58 | 3,517 | — | — |
| Median holding period | 12 months | 7 months | 12 months | — | — |
| Turnover per year | 1.03 | 1.11 | 0.80 | — | — |
| Exits through delisting | 15 | 1 | 83 | — | — |
Portfolio A returned 13.17% a year, turning $100,000 into $2,652,358.74 over the 26.5 years, at a worst drawdown of −52.13%. Portfolio C, one point looser on the buy side, is close behind at 12.58% a year and $2,311,684.10, with a milder drawdown of −46.18%. Portfolio B, the strictest of the three, trails badly at 6.79% a year and $570,464.94 — though its drawdown of −41.10% is also the smallest of the three, since a portfolio that is rarely invested cannot fall as far as one that always is.
Both benchmarks trail Portfolio A and Portfolio C on return: the S&P 500 managed 6.55% a year, the Nasdaq 100 8.12% — though the Nasdaq 100 also carried by far the roughest ride, an −81.07% drawdown during the dot-com bust that dwarfs anything the three portfolios went through. One caveat belongs here, not in a footnote at the end: both benchmarks are price indices without dividends, while the portfolios trade dividend-adjusted prices. That tilts the comparison slightly in the portfolios' favour, and it is worth saying plainly rather than leaving it implied.
The trade statistics round out the picture. Portfolio A turns its capital over roughly once a year (turnover 1.03) with a median holding period of 12 months — the same holding period as Portfolio C, while Portfolio B's rare positions are held a median of 7 months. A win rate of 58.92% for Portfolio A sounds solid until you read it the other way round: four trades in ten still end in the red. That is not a flaw in the presentation, it is what a 13% annual return actually looks like up close.
Portfolio B: why perfection ends up empty
The strictest rule delivers the worst result, and it is worth sitting with that sentence for a moment: more points required, worse outcome. The reason is not that Portfolio B picked bad stocks — it is that it barely picked any. Across the full 319 months it held 1.33 positions on average and sat entirely in cash in 100 of those months, 31.35% of the whole test. In seven calendar years — 2000 through 2005, then again in 2025 — it held no position at all. Its busiest year was 2023, with an average of just 4.8 positions. Across more than 26 years that adds up to 117 orders and 58 completed round trips: not a portfolio in any meaningful sense, but a handful of individual bets.
Perfection is not a portfolio. Demanding a flawless score on all ten criteria filters out almost everything, including plenty of companies that would have scored 9 out of 10 and delivered fine returns inside Portfolio A. With so few trades, Portfolio B's 6.79% a year rests on a small number of individual stocks rather than on a rule tested at any real scale — a cautionary tale about over-tightening a filter, not a verdict on the score itself.
Year by year
A 26.5-year average return flattens a much bumpier ride underneath it. The table below breaks all three portfolios and both indices down year by year, from January 2000 through July 2026 — note that the final row, 2026, covers only January through July and is not a full year's return.
| Year | Portfolio A | Portfolio B | Portfolio C | S&P 500 | Nasdaq 100 |
|---|---|---|---|---|---|
| 2000 | +28.9% | 0.0% | +2.21% | −5.32% | −34.41% |
| 2001 | −24.74% | 0.0% | +2.03% | −13.04% | −32.65% |
| 2002 | −2.4% | 0.0% | −5.6% | −23.37% | −37.58% |
| 2003 | +101.52% | 0.0% | +73.29% | +26.38% | +49.12% |
| 2004 | +73.35% | 0.0% | +36.13% | +8.99% | +10.44% |
| 2005 | −4.09% | 0.0% | +9.98% | +3.0% | +1.49% |
| 2006 | +5.71% | +2.97% | +16.23% | +13.62% | +6.79% |
| 2007 | +11.75% | +6.64% | +18.59% | +3.53% | +18.67% |
| 2008 | −41.38% | −0.77% | −35.4% | −38.49% | −41.89% |
| 2009 | +45.0% | +26.62% | +45.22% | +23.45% | +53.54% |
| 2010 | +34.5% | −9.4% | +22.57% | +12.78% | +19.22% |
| 2011 | −16.16% | −22.1% | −7.91% | 0.0% | +2.7% |
| 2012 | +7.02% | +2.38% | +11.79% | +13.41% | +16.82% |
| 2013 | +58.31% | +36.13% | +40.83% | +29.6% | +34.99% |
| 2014 | +6.13% | +15.57% | +0.28% | +11.39% | +17.94% |
| 2015 | +2.17% | −7.22% | +2.23% | −0.73% | +8.43% |
| 2016 | +23.86% | +17.41% | +23.31% | +9.54% | +5.89% |
| 2017 | +47.54% | +8.57% | +35.56% | +19.42% | +31.52% |
| 2018 | −2.7% | +25.73% | −14.43% | −6.24% | −1.04% |
| 2019 | +25.27% | +36.25% | +24.2% | +28.88% | +37.96% |
| 2020 | +31.75% | +27.62% | +14.29% | +16.26% | +47.58% |
| 2021 | +14.22% | +12.02% | +27.24% | +26.89% | +26.63% |
| 2022 | −12.79% | +17.1% | −19.76% | −19.44% | −32.97% |
| 2023 | +20.0% | +20.01% | +19.54% | +24.23% | +53.81% |
| 2024 | +17.47% | −2.01% | +17.7% | +23.31% | +24.88% |
| 2025 | +5.95% | −1.45% | +16.81% | +16.39% | +20.17% |
| 2026 (through July) | −7.95% | −7.49% | +12.78% | +9.41% | +11.98% |
The early years make the case for a survivorship-free test. In 2000, while the dot-com bubble was already bursting, Portfolio A gained 28.9% against a −5.32% S&P 500 and a −34.41% Nasdaq 100. In 2002, the worst year of the bust, Portfolio A lost just 2.4% while the S&P 500 fell 23.37% and the Nasdaq 100 37.58%. 2001 sits in between and is more honest about the limits of a growth score during a growth bust: Portfolio A lost 24.74%, worse than the S&P 500's −13.04%, though still well ahead of the Nasdaq 100's −32.65% — a growth-tilted portfolio does not escape a growth crash unscathed, it just tends to come out of one less battered.
2008 and 2022 are the two years in which every strategy in this study shows some form of drawdown. In 2008, Portfolio A fell 41.38% and Portfolio C 35.4%, close to the S&P 500's −38.49% and a touch better than the Nasdaq 100's −41.89%. 2022 tells a more interesting story: Portfolio A lost only 12.79% against a −19.44% S&P 500 and a −32.97% Nasdaq 100 — one of the clearest years in which the score's demand for balance-sheet backing paid off during a rate-driven sell-off in unprofitable growth stocks.
In several of the more recent years, though, the Nasdaq 100 outran both portfolios by a wide margin — 2023 (53.81% against 20.0% for Portfolio A and 19.54% for Portfolio C), 2024 (24.88% against 17.47% and 17.7%) and 2025 (20.17% against just 5.95% for Portfolio A). A handful of mega-cap technology stocks can carry an index further than a broader, rules-based growth portfolio in years like these. Portfolio B, for its part, shows a flat 0.0% in every year from 2000 through 2005 — not a data gap, but the direct consequence of holding no position at all, itself a result of the insider criterion only becoming measurable from 2006 onward (more on that in Limits of the method).
How many stocks could be judged at all
None of the returns above mean anything without knowing how many stocks were actually eligible to produce them. The table below is the honest counterpart to the 22,871-stock universe: a stock without usable filings gets no score, and without a score it is never bought, no matter how promising its story looks.
| Year | Stocks with a price | with filings | with a score | Share with a score |
|---|---|---|---|---|
| 2000 | 8,138 | 3,670 | 1,810 | 22.2% |
| 2001 | 7,586 | 3,898 | 1,971 | 26.0% |
| 2002 | 7,058 | 4,078 | 2,155 | 30.5% |
| 2003 | 7,064 | 4,264 | 2,410 | 34.1% |
| 2004 | 7,144 | 4,436 | 2,817 | 39.4% |
| 2005 | 7,198 | 4,661 | 3,044 | 42.3% |
| 2006 | 7,209 | 4,877 | 3,355 | 46.5% |
| 2007 | 7,289 | 5,107 | 3,554 | 48.8% |
| 2008 | 7,084 | 5,320 | 3,722 | 52.5% |
| 2009 | 6,896 | 5,428 | 3,830 | 55.5% |
| 2010 | 6,998 | 5,674 | 3,986 | 57.0% |
| 2011 | 6,964 | 6,032 | 4,088 | 58.7% |
| 2012 | 6,988 | 6,396 | 4,361 | 62.4% |
| 2013 | 7,077 | 6,687 | 4,559 | 64.4% |
| 2014 | 7,432 | 7,067 | 4,822 | 64.9% |
| 2015 | 7,603 | 7,238 | 5,106 | 67.2% |
| 2016 | 7,763 | 7,374 | 5,302 | 68.3% |
| 2017 | 7,806 | 7,518 | 5,481 | 70.2% |
| 2018 | 7,783 | 7,652 | 5,660 | 72.7% |
| 2019 | 7,582 | 8,169 | 5,710 | 75.3% |
| 2020 | 8,249 | 9,042 | 5,688 | 69.0% |
| 2021 | 10,010 | 9,208 | 5,934 | 59.3% |
| 2022 | 9,060 | 8,260 | 6,026 | 66.5% |
| 2023 | 8,227 | 7,492 | 6,048 | 73.5% |
| 2024 | 7,477 | 6,765 | 5,960 | 79.7% |
| 2025 | 7,171 | 6,154 | 5,864 | 81.8% |
| 2026 (through July) | 6,835 | 507 | 5,488 | 80.3% |
In the earliest years, only a fraction of the stocks with a price series carry a score at all: in 2000, just 1,810 of 8,138 stocks with a price — 22% — had a score, because SEC filings were far from universally machine-readable that early and coverage built up only gradually. By the mid-2020s that picture has reversed: coverage climbs past three-quarters and reaches 81.8% in 2025 and 80.3% in 2026. The practical consequence is that the earliest years of this backtest rest on a considerably narrower slice of the market than the later ones, and any comparison across decades should keep that in mind.
One number needs an explanation rather than raising a false alarm: the count of stocks "with filings" drops sharply in 2026, from 6,154 the year before to just 507. That is a reporting-date effect, not a loss of data — the current financial year has simply not been filed everywhere yet by the July 2026 cut-off used in this study. Where a fresh annual report was not yet available, the score for 2026 rests on the most recently published filing rather than on a missing one.
Does the score sort at all?
The three portfolios above each answer a question about a single threshold. They do not answer a more basic one: does the score actually carry information at all, or would any of the ten thresholds have worked more or less the same? To find out, we built ten entirely separate portfolios, one per score level. Each one buys a stock the moment it reaches exactly that score — no more, no less — and sells as soon as the score leaves that level again, whether it moves up or down. Level 10 is simply the ten-point portfolio under another name: "exactly 10" and "at least 10" describe the same rule, since nothing can score higher.
All ten ladder portfolios run over the same 26.5-year reference period with the same $100,000 starting capital as the rest of this study. The table below lines them up side by side.
| Score | Final value | Return p.a. | Worst drawdown | Buys | Win rate |
|---|---|---|---|---|---|
| Exactly 1 point | $879,777.31 | 8.6% | −65.1% | 2,562 | 47.3% |
| Exactly 2 points | $1,957,021.75 | 11.9% | −54.2% | 9,242 | 52.2% |
| Exactly 3 points | $2,082,993.49 | 12.1% | −54.4% | 17,515 | 54.8% |
| Exactly 4 points | $2,105,801.23 | 12.2% | −54.6% | 21,900 | 56.3% |
| Exactly 5 points | $2,198,545.26 | 12.4% | −51.3% | 20,257 | 57.3% |
| Exactly 6 points | $2,430,062.71 | 12.8% | −51.6% | 14,218 | 57.6% |
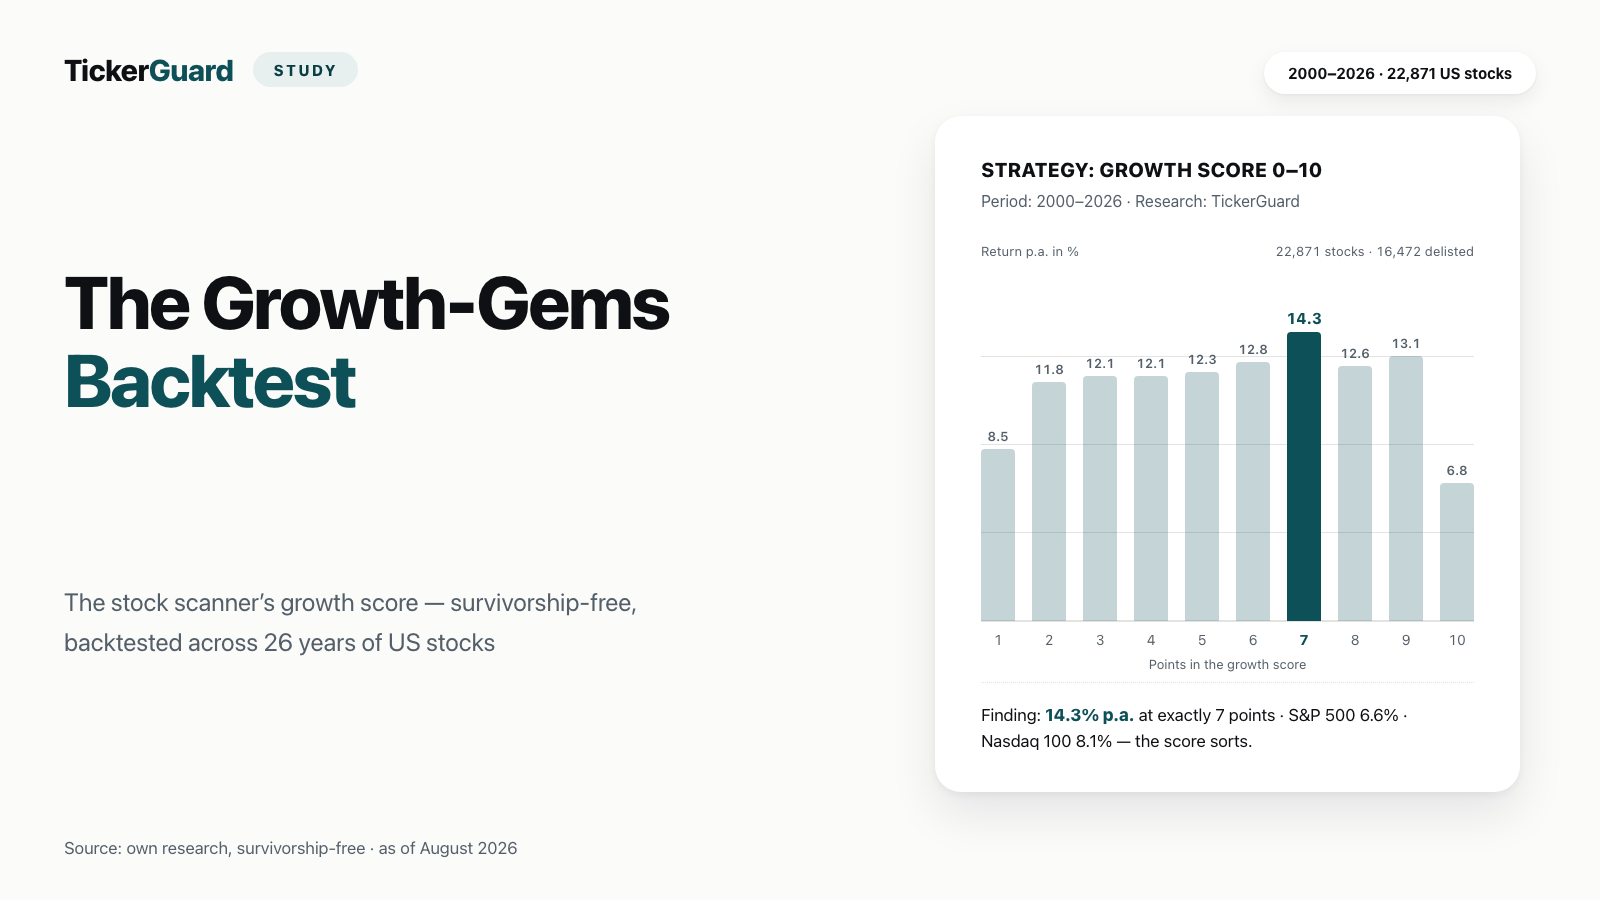
| Exactly 7 points | $3,520,682.70 | 14.4% | −53.1% | 7,942 | 56.4% |
| Exactly 8 points | $2,367,242.00 | 12.7% | −43.9% | 3,623 | 55.5% |
| Exactly 9 points | $2,620,458.26 | 13.1% | −52.8% | 1,022 | 58.2% |
| Exactly 10 points | $570,464.94 | 6.8% | −41.1% | 59 | 53.4% |
Read from left to right, the ladder answers the question cleanly: return and win rate rise with the score almost without interruption. A single point buys 8.6% a year with a 47.3% win rate; by seven points that has climbed to 14.4% a year with a win rate of 56.4%. That rising line, not any individual level, is the real finding of this chapter — the score sorts. A company scoring 7 is a demonstrably better bet, on average and over 26 years, than one scoring 3.
Exactly 7 points turns out to be the strongest single level in the entire study at 14.4% a year — stronger than any of the three threshold-based portfolios from the first chapter, including Portfolio A's 13.17%. Exactly 10 points, by contrast, falls out of line at just 6.8%, echoing Portfolio B's result for the same reason: with only 59 buys across 26.5 years, usually a single position and often none at all, there simply are not enough candidates to draw a conclusion from. That is not a mark against the score — it is a sample-size problem, and the ladder makes that easy to see rather than easy to miss.
Two caveats belong directly next to this table, not after it. First, breadth: the middle levels, 3 through 5, hold 700 to 900 stocks at a time. A portfolio that size is not really a portfolio any more — it is closer to an index replica, and its returns say more about where the broad market went than about any selection skill in the score. Second, dividends, worth repeating here because this chapter puts percentages directly against the S&P 500 and Nasdaq 100: the ladder portfolios trade dividend-adjusted prices, the benchmarks do not, so every comparison in this section tilts a little in the portfolios' favour.
What does the exit change?
Every portfolio so far has answered a question about the buy side. This chapter fixes the buy rule and asks what the sell side is worth on its own. All 25 rows tested here buy exactly like the strongest level of the ladder — at exactly 7 points — so that any difference between rows can only come from how and when the position is closed. The reference row is E7: sell as soon as the score leaves exactly 7, the same portfolio from the previous chapter, returning 14.4% a year at a −53.1% drawdown.
The 25 exit rules fall into three groups: stops without a re-entry ban, score-based variants and profit-taking rules, and stops combined with a six-month re-entry ban. The table below lists all three, with the E7 reference set in bold at the top for comparison.
| Sell rule | Final value | Return p.a. | Worst drawdown | Buys | Sells triggered by the score | Win rate |
|---|---|---|---|---|---|---|
| Reference E7 — sell as soon as the score leaves exactly 7 | $3,520,682.70 | 14.4% | −53.1% | 7,942 | — | 56.4% |
| Stops without a re-entry ban | ||||||
| S05 — Fixed stop, −5% from entry | $3,299,812.61 | 14.1% | −53.3% | 18,118 | 7,461 | 34.5% |
| S10 — Fixed stop, −10% from entry | $3,369,050.43 | 14.2% | −53.2% | 14,755 | 7,461 | 41.0% |
| S15 — Fixed stop, −15% from entry | $3,501,776.37 | 14.4% | −53.2% | 12,784 | 7,461 | 45.6% |
| S20 — Fixed stop, −20% from entry | $3,554,149.73 | 14.4% | −53.2% | 11,451 | 7,461 | 49.2% |
| S25 — Fixed stop, −25% from entry | $3,552,090.39 | 14.4% | −53.2% | 10,582 | 7,461 | 51.4% |
| S30 — Fixed stop, −30% from entry | $3,580,151.72 | 14.5% | −53.0% | 9,899 | 7,461 | 53.1% |
| S35 — Fixed stop, −35% from entry | $3,564,103.49 | 14.4% | −53.2% | 9,459 | 7,461 | 53.9% |
| S40 — Fixed stop, −40% from entry | $3,591,750.96 | 14.5% | −53.4% | 9,100 | 7,461 | 54.5% |
| S45 — Fixed stop, −45% from entry | $3,717,628.15 | 14.6% | −53.0% | 8,821 | 7,461 | 54.9% |
| S50 — Fixed stop, −50% from entry | $3,672,641.72 | 14.6% | −52.8% | 8,608 | 7,461 | 55.5% |
| Score variants and profit taking | ||||||
| I1 — Sell only on downgrades — a move up to 8, 9 or 10 keeps the position | $3,377,427.56 | 14.2% | −49.6% | 7,185 | — | 56.9% |
| I2 — Hysteresis: sell only at 5 points or below | $3,077,754.25 | 13.8% | −50.4% | 6,205 | — | 57.1% |
| I3 — Trailing stop, −20%; the score no longer sells | $3,376,339.91 | 14.2% | −49.0% | 13,032 | — | 40.1% |
| I4 — Trailing stop, −30%; the score no longer sells | $3,478,153.32 | 14.3% | −49.4% | 9,478 | — | 40.5% |
| I5 — Minimum holding period of 12 months before the score rule applies | $2,706,138.28 | 13.3% | −59.3% | 7,475 | — | 58.4% |
| I6 — Take profit at a double; upgrades are held | $3,861,837.18 | 14.8% | −50.5% | 7,948 | — | 57.9% |
| I7 — Take profit at +50%; upgrades are held | $3,873,271.84 | 14.8% | −49.9% | 9,222 | — | 60.4% |
| I8 — Take profit at a triple; upgrades are held | $3,875,564.10 | 14.8% | −49.8% | 7,435 | — | 57.2% |
| K1 — Take profit at a double plus a fixed −45% stop | $3,870,002.49 | 14.8% | −50.3% | 9,072 | — | 55.5% |
| Stops with a six-month re-entry ban | ||||||
| SB15 — Fixed stop, −15%, with a six-month re-entry ban | $4,633,681.16 | 15.6% | −51.5% | 9,579 | — | 47.3% |
| SB30 — Fixed stop, −30%, with a six-month re-entry ban | $3,641,122.67 | 14.5% | −52.9% | 8,578 | — | 53.7% |
| SB45 — Fixed stop, −45%, with a six-month re-entry ban | $3,698,610.37 | 14.6% | −53.5% | 8,162 | — | 55.7% |
| TB20 — Trailing stop, −20%, with a six-month re-entry ban | $4,358,476.29 | 15.3% | −47.4% | 8,665 | — | 42.0% |
| TB30 — Trailing stop, −30%, with a six-month re-entry ban | $4,291,118.86 | 15.2% | −48.5% | 7,220 | — | 42.8% |
| KB1 — Take profit at a triple plus a −30% stop with a six-month ban | $4,051,065.68 | 15.0% | −49.5% | 8,207 | — | 53.0% |
The single hardest finding in this chapter is also the most counterintuitive: a stop-loss without a re-entry ban measures nothing but round-trip costs. The evidence is exact rather than approximate — across all ten stop widths tested, from −5% to −50%, the number of sells triggered by the score alone stays fixed at precisely 7,461. What that number is hiding: a stock that gets stopped out is, in the overwhelming majority of cases, still sitting on exactly seven points. The buy rule fires again in the same month, and the portfolio simply buys it straight back. The stop does not protect the portfolio from anything — it produces an extra round trip and an extra order cost, visible directly in the numbers: the tightest stop, S05, drags the win rate down to 34.5% and pushes the buy count up from E7's 7,942 to 18,118, purely from stopping out and immediately re-buying the same names.
I5, a rule that imposes a minimum holding period of 12 months before the score is even allowed to sell, is by a clear margin the worst row in the table: 13.3% a year at a −59.3% drawdown, both worse than the E7 reference. Delaying an exit that the score has already called for does not protect the position — it keeps money in names the rule itself has flagged as weaker, and the portfolio pays for that delay twice, once in return and once in drawdown.
The three profit-taking rules — I6 (take profit at a double), I7 (take profit at +50%) and I8 (take profit at a triple), all of which keep holding through score upgrades — land within a tenth of a point of each other, at roughly 14.7% to 14.8% a year. That the exact profit target barely matters is itself the encouraging part: the improvement over the E7 reference comes from the underlying principle — hold the upgrades, take the gains when they arrive — rather than from having guessed the one correct multiple.
The clearest result in the whole matrix, though, needs the re-entry ban to show up at all. Add a six-month ban on buying a stock back after a stop, and stops beat the reference for the first time in this study: SB15, a fixed stop at −15% with the ban, reaches 15.6% a year; TB20, a trailing stop at −20% with the same ban, reaches 15.3% at a drawdown of just −47.4% — the mildest of any row in this table, against E7's 14.4% at −53.1%. The ban is what turns an exit into an actual exit instead of a brief pause before the same purchase.
One caveat belongs directly after these numbers: with 25 different sell rules measured against the same reference, some row was always going to come out on top even if none of them made a real difference. What survives that scrutiny is the direction — that a re-entry ban changes the outcome and a stop without one does not — rather than the second decimal place of any single row.
The recipe tested here — buy at exactly 7 of 10 points, sell with a 15% stop-loss or as soon as the score leaves 7, a six-month re-entry lock after a stop-loss sale — now runs as its own, daily-updated scanner: Growth Gems: 7-Point Recipe. The results list only reflects the buy side of the recipe, showing which stocks currently score exactly 7 points. The stop-loss and re-entry lock are rules for your own portfolio that the scanner does not apply automatically.
The AI-rating cross-check
After we published this study, one question stayed open: does the score alone tell the whole story, or would an extra look inside the actual annual report add something on top of it? To find out, we took 200 randomly frozen stocks from the exact-7 buys of the recipe tested in this study and had an AI model judge each stock, year by year, blind on nothing but its most recent annual report — green for a company with no visible problem, yellow for a problem judged either temporary or structural, red for a serious warning sign. That produced 566 verdicts in total: 338 green, 202 yellow, 26 red.
On the same 200 stocks we ran three portfolios: one with no filter at all as the baseline, one that refuses to buy whenever the AI verdict is red, and one that buys only on a green verdict. The table below shows the result.
| Measure | No filter (baseline) | Excluding red verdicts | Green verdicts only |
|---|---|---|---|
| Rule | no filter | does not buy on a red AI verdict | buys only on a green AI verdict |
| From $100,000 to | $3,691,533.32 | $3,435,944.09 | $3,609,981.42 |
| Return p.a. | 14.59% | 14.28% | 14.49% |
| Worst drawdown | −62.84% | −71.3% | −57.93% |
| Buys | 426 | 411 | 262 |
| Blocked buys | — | 172 | 1,687 |
The finding is clear, even though it runs against our own expectation: the AI filter did not improve the recipe. The unfiltered baseline returned 14.59% a year, edging out both filtered variants. "Excluding red verdicts" landed at 14.28% a year and, worse, carried a sharply deeper worst drawdown of −71.3% against the baseline's −62.84% — the very variant meant to screen out red flags would have lost more at its worst point than the unfiltered version ever did. "Green verdicts only" came closest to the baseline at 14.49% a year and also showed the mildest drawdown of the three at −57.93% — but that is not evidence of better stock-picking. A large share of it is simply idle cash: 1,687 buy signals were blocked — a blocked signal counts again at every monthly rebalance, which is why the number far exceeds the baseline’s 426 actual buys — so the portfolio spent a substantial part of the period sitting in cash rather than invested.
A second test went after a plausible-sounding thesis: is a fundamentally good company with a temporary problem actually the better buy than one with no problem at all — on the theory that the market overreacts to the problem and the recovery is still ahead? To test that, we built 421 buy pairs from the green, yellow and red verdicts and sorted them by the nature of the problem found: none, temporary, or structural. A single yellow pair without a named problem was left aside and does not change the picture.
The thesis does not survive the test. Buys with a problem judged temporary returned 5.99% on average with a 51.9% win rate (106 buys) — clearly behind the problem-free buys at 28.78% on average and a 62.3% win rate (257 buys). Even buys with a problem judged structural, at 22.95% on average and a 54.4% win rate (57 buys), beat the supposedly milder temporary problems. The two standout red subgroups — structural at 65.1% on average (10 buys) and temporary at 13.42% (4 buys) — rest on too few cases to be more than an anecdote.
Three caveats belong here. The 200 stocks are a sample of the exact-7 buys, not a full measurement of every buy the recipe ever made. The verdicts come from a blind protocol based only on the most recent annual report — a residual risk remains that the model still recognized the company from its own training. And 29.5% of the verdicts rest on a substitute basis built from the financial statements rather than the report itself, because no loadable report was available.
Data quality: two companies under one ticker
One data problem gets a section of its own rather than a footnote, because left unaddressed it could quietly inflate every result in this study. Under some delisted ticker symbols, two entirely different companies sit inside a single, unbroken price series. The mechanism is simple: an exchange reissues a ticker after the original company delists, and the new company's price history gets glued directly onto the old one's with nothing marking the seam. Looked at in hindsight, a stock like that can appear to have gained a hundredfold in a single month — a move that never actually happened to any real shareholder.
We built a quality gate that blocks any such series from being bought at all, in every portfolio in this study. Of 22,629 stocks checked that have a usable price series, 2,587 — 11.43% — are blocked. Narrowed down to the 2,421 stocks that ever reached Portfolio C's buy threshold of 8 points, 228, or 9.42%, are affected. The gate catches three distinct patterns: 1,185 cases of a hard price jump, a factor of 8 or more within a single month; 1,231 cases of a permanently lifted price level, where after a jump of factor 3 or more the median price of the following six months sits more than 2.5 times above the median of the six months before; and 171 cases where the series itself starts implausibly.
The most important sentence in this section is about direction: the gate blocks upward jumps only. A comparable drop downward is left in the data untouched, because in the overwhelming majority of cases it is a genuine collapse — a real bankruptcy, a real loss of value that actually happened to holders of the stock. Filtering those out as well would not have made this study more accurate. It would have made it look better than it was, by quietly deleting the losses a stock-picking rule is also supposed to be tested against.
Limits of the method
No backtest is free of assumptions, and being clear about them is part of the result, not an afterthought to it. Here are all ten, in full, none of them softened.
- Criterion 2 is a proxy. Analyst estimates from any point in the past do not exist as a usable time series, so this study substitutes the revenue growth a company actually achieved in its most recent financial year — a rear-view mirror standing in for a forecast that cannot be reconstructed after the fact.
- The insider criterion only exists from 2006 onward, because machine-readable SEC insider data does not reach further back. Before 2006, at most 9 of the 10 points are reachable at all: Portfolio B, which requires a perfect 10, is effectively only measurable from 2007, and Portfolio A, which requires 9, measures more strictly before 2006 than after it, since every one of the nine judgeable criteria then has to be met.
- Filing gaps hit failing companies hardest. A company with no usable financial statement gets no score, and a company with no score is never bought — and companies heading toward bankruptcy are disproportionately likely to stop reporting cleanly before the end. That biases the result somewhat too favourably.
- Trades execute at the month-end closing price of the signal month. In reality, days to weeks pass between a filing becoming public and an order actually being filled.
- The benchmarks are price indices without dividends, while every portfolio in this study trades dividend-adjusted prices — a difference that favours the portfolios in every direct comparison.
- Only order costs are modelled — 0.1% of order volume on every buy and every sell. Taxes, the bid-ask spread and the market impact of placing the orders themselves are not included.
- Two companies can share one ticker's price series (see Data quality above), and the quality gate built to catch that problem blocks upward jumps only.
- A rare data error distorts revenue figures. In 584 of 185,030 filing periods examined — 0.32% — an annual revenue figure appears to collapse in the raw data and then spring back the following year, a reporting artifact rather than a real business event. Roughly 1.5% of the scored months are estimated to be affected. The distortion runs in one direction, upward, and hits the K1 sell variant hardest, so its result should be read with some caution.
- Stops and profit-taking rules act on month-end closing prices only — the mildest possible way to measure them, since a real stop in a live account would trigger intra-month, more often and typically at a worse price than the one used here. The re-entry ban, too, is tested in exactly one length: six months. Whether a shorter or longer ban would work better is not something this study measures or claims.
- Twenty-five sell variants invite multiple-testing luck. Test that many rules against the same reference and one of them will come out ahead even without any real underlying effect. What is defensible is the direction of the finding — a re-entry ban helps, a bare stop does not — not the precise ranking or size of any individual row.
What does not follow from this study
What this study shows is how three fixed, mechanical rules would have behaved on a broad, survivorship-free universe of US stocks over roughly 26.5 years. It does not show what to buy today. A score of 9 or higher on a company right now tells you that the same rule, applied historically, produced a 13.17% average annual return across hundreds of different companies over more than two and a half decades — it says nothing about what that one company will do next.
The gap between those two statements matters most in the chapters on the score ladder and the sell-rule matrix. That the score sorts, on average, across thousands of data points does not mean any individual stock sitting at exactly 7 points today is a good investment; that a six-month re-entry ban improved the historical result does not mean it will do so again by the same margin, or at all, the next time markets behave differently than they did between 2000 and 2026. Past results, whether from a real portfolio or from a simulation like this one, are no reliable indicator of future returns.
This is a historical study, not investment advice. It contains no buy or sell recommendation, no price target and no forecast for any company, listed or delisted. Anyone making an investment decision should assess their own situation and risks, with professional advice where that is appropriate.
Two more studies from the same series work the same way: we ran a well-known value-investing formula through an identical kind of test in our Magic Formula backtest study, and rebuilt a classic deep-value screen from scratch in our Graham net-net backtest study. The Growth Gems score itself keeps running as a live, continuously updated screen in our stock scanner, and the full collection of studies like this one lives in Research.
Frequently Asked Questions
Ten criteria, one point for each one met: three-year revenue growth, expected revenue growth, share-count dilution, the "Rule of 40", gross margin, goodwill from acquisitions, net debt, cash-flow coverage of profits, return on capital employed and insider ownership. If the figures for a criterion are missing, it counts as neither passed nor failed; a score is only assigned once at least seven of the ten criteria can be judged.
The portfolio buying from nine out of ten points returned 13.17% a year from January 2000 through July 2026, the portfolio buying from eight points 12.58%. The S&P 500 returned 6.55% and the Nasdaq 100 8.12% over the same span. Both benchmarks are price indices without dividends, while the portfolios use dividend-adjusted prices — the comparison therefore tilts slightly in the portfolios' favour.
Because it is usually empty. The portfolio that buys only at ten out of ten points held 1.33 positions on average and sat entirely in cash in 100 of the 319 months. With 117 orders in more than 26 years, its 6.79% a year rests on a handful of individual stocks — too thin a basis for a reliable rule.
We ran ten separate portfolios, each buying at exactly one score level. Return and win rate rise with the score almost without interruption — from 8.6% a year at one point to 14.4% at seven. That is the real finding: the score sorts. The level of exactly ten points falls out of line at 6.8% simply because there are too few candidates.
Not without a re-entry ban. Across all ten stop widths tested, the number of sells triggered by the score stays at exactly 7,461: the stopped-out stock still sits on its seven points, the buy rule fires again in the same month, and the portfolio buys it straight back. Only with a six-month re-entry ban do stops beat the reference — a fixed stop at minus 15% reaches 15.6% a year.
Under some delisted tickers, two different companies sit in a single continuous price series because the ticker was reissued after the delisting. A quality gate blocks such series from every purchase: 2,587 of 22,629 stocks checked (11.43%). It blocks only upward jumps — the same jump downwards stays in, because it is usually a genuine collapse.
No. The study describes how fixed rules would have behaved over roughly 26.5 years on a broad historical universe — not what to buy today. It contains no buy or sell recommendation, no price target and no forecast. Past results are no reliable indicator of future returns.
No. As a cross-check, we had an AI model judge 200 randomly frozen stocks from the exact-7 buys, stock by stock and year by year, blind on the most recent annual report (green/yellow/red, 566 verdicts). The unfiltered baseline returned 14.59% a year; a filter excluding red verdicts returned 14.28% (with an even sharper −71.3% drawdown); a filter allowing only green verdicts returned 14.49%. The plausible-sounding thesis that a company with a temporary problem is the better buy did not hold up either: those buys returned just 5.99% on average against 28.78% for problem-free buys. Source: fundamental data.


