Southern Missouri Bancorp: 130 Straight Dividends — and Loans With Rate Concessions Bigger Than a Quarter’s Profit
The clockwork trap: Southern Missouri Bancorp, the holding company of Southern Bank in Poplar Bluff, declared its 130th consecutive quarterly dividend in October 2026 and, at $71.8 million, earned more in fiscal 2026 than in any of the five fiscal years presented. Yet in the quarter ended September 30, 2026, the bank cut the interest rate for business borrowers in financial difficulty on loans totaling $21.1 million — according to the quarterly report primarily a single commercial loan whose exact size the bank does not disclose. That line item is larger than the quarter’s net income of $19.1 million. Behind it is a direction: nonperforming loans have quadrupled since June 2024, from $6.7 million to $26.7 million; beneath them sit $51.1 million in concessions and $105.7 million in loans of concern — against $601.1 million in equity. In November 2026, leadership of the finance function also changed. The lesson travels: with any dividend streak, read the lists beneath the headline. Not investment advice — just a look inside the movement of a bank that has paid on time for 130 quarters.
 Thomas Mücke
Founder & Publisher
As of Today
As of: November 13, 2026
- Closing price
- 70.95 $ +0.01%
- Market Capitalisation
- 0.8 $B
- P/E
- 10.5
- Growth Score
- 8/10
- AAQS
- 7/10
This analysis has a cut-off date. The Stock Guard tells you when something material changes in the numbers. Reserve your free spot
Chart
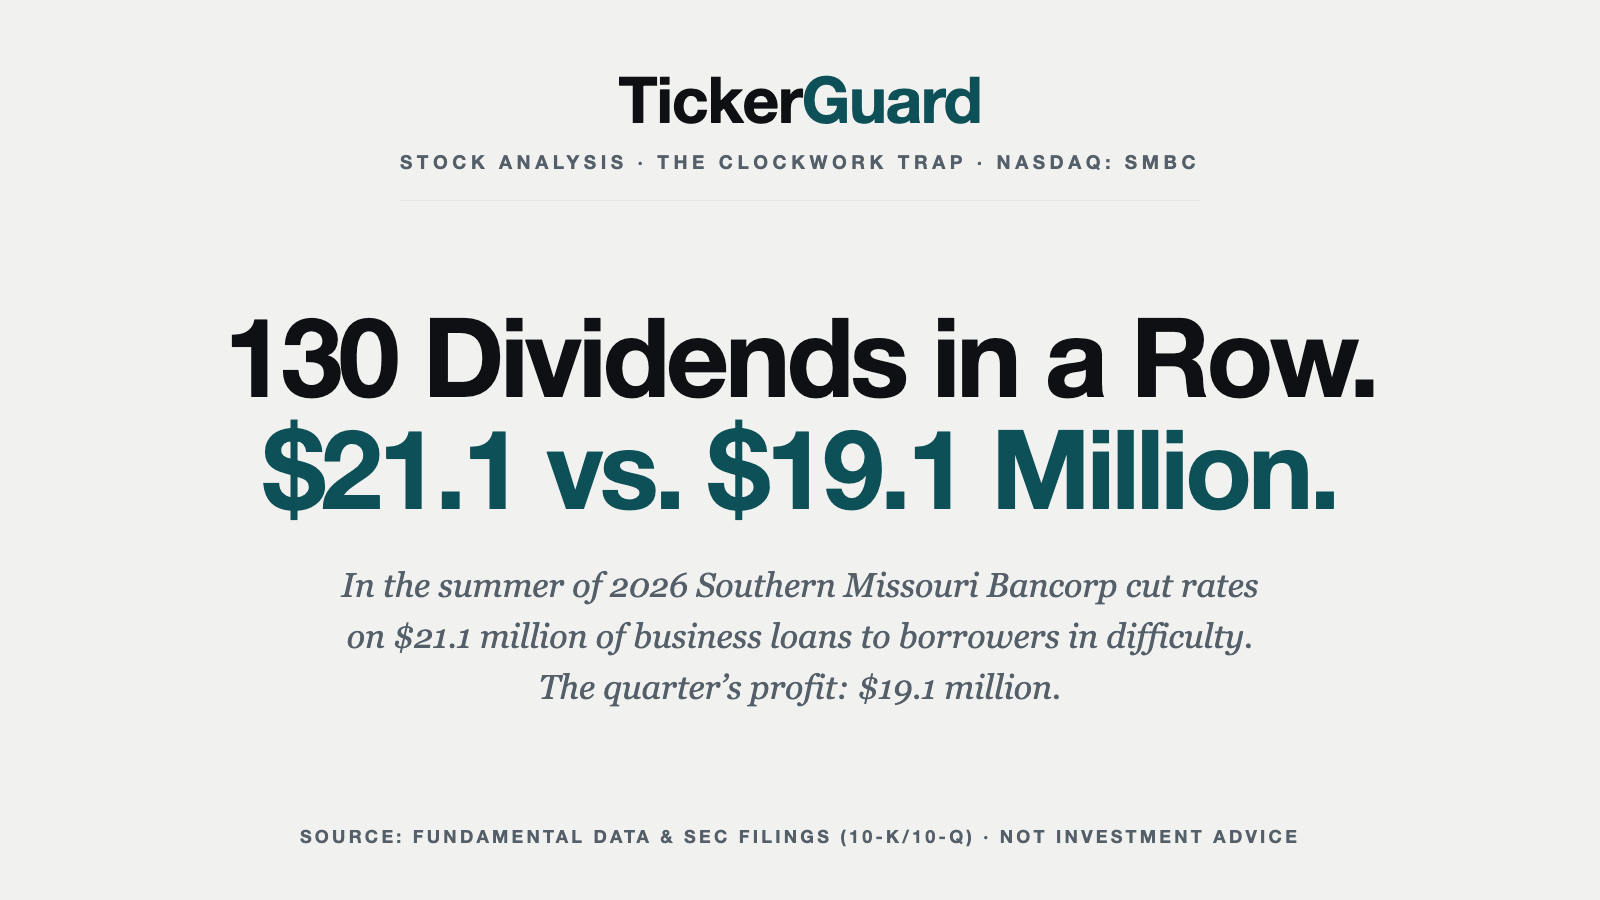
Interactive price chart (TradingView).
52-week range: 53.00 $ to 79.30 $ · Last price: 70.95 $ (As of: November 13, 2026)
Note: pure fact-based analysis, not investment advice and not a solicitation to buy or sell. All figures without guarantee.
There is an investor trap that feels like common sense: the clockwork trap. It works like this: a company does the same thing 130 times in a row, on time and without fuss — and at some point you stop opening the case. Whatever has ticked for this long will keep ticking. Southern Missouri Bancorp (Nasdaq: SMBC) is exactly that kind of company: a regional bank from Poplar Bluff in southeastern Missouri whose board declared its 130th consecutive quarterly dividend on October 20, 2026. More than 32 years without a single gap. Add the highest annual profit of the last five fiscal years. A stock can hardly look more boring, or more reassuring. Open the case, and right on top lie commercial loans totaling $21.1 million whose interest rate the bank cut in the summer of 2026 because the borrowers are in financial difficulty — according to the quarterly report primarily a single loan whose exact size the bank does not disclose. That line item is larger than the profit of the same quarter ($19.1 million); the loans are still being paid.
Why should a rural bank from Missouri interest you? Because it is a case study: with any dividend streak, the telling numbers sit in the lists beneath the headline.
So let’s make a deal: we look at the whole movement together. We read what the bank itself reported to the U.S. securities regulator, the SEC — the annual report (10-K) for fiscal 2026, the quarterly report (10-Q) for September 30, 2026, and the current reports (8-K) of recent weeks. Management is personally liable for false statements in an SEC filing. And this one tells two stories at once: of a bank that earns more than it has in years, and of a loan book in which the problem cases have been growing faster than the profit for two years. In the end, you decide.
What Southern Missouri Bancorp actually does — a rural bank with 63 branches
Southern Missouri Bancorp is a bank holding company — a parent that essentially owns one thing: Southern Bank. According to the annual report, the bank was chartered in 1887 as a mutual savings and loan association in the state of Missouri and has carried the name Southern Bank since 2009. On June 30, 2026, it operated its Poplar Bluff headquarters plus 63 full-service branches, two limited-service branches and three loan production offices — most of them in Missouri, with further locations in Arkansas, Illinois and Kansas. It employs 739 people.
The business model is the oldest in finance: the bank collects savings and lends them out at a higher rate. The annual report puts it plainly — revenues are derived “principally from interest earned on loans and investment securities.” The key metric for that is the net interest margin. In everyday terms: of every $100 the bank has lent or invested, $3.70 a year is left after it has paid its savers (quarter ended September 30, 2026). Out of that it has to cover branches, staff and loan losses.
What matters is whom this bank lends to. On September 30, 2026, it carried $4.46 billion in loans. A quarter of that is classic home mortgages for families ($1.12 billion). The rest is business with entrepreneurs and farmers: rented-out commercial real estate ($921 million), owner-occupied commercial real estate ($469 million), apartment buildings ($454 million), construction and land loans ($314 million), commercial and industrial loans ($564 million) — and $548 million to farmers, split between farmland financing ($306 million) and operating loans for seed, fertilizer and machinery ($242 million). The bank itself describes its core territory as rural, shaped by rice, soybeans, cotton, corn and livestock.
The bank has grown mainly through deals: the annual report lists six whole-bank acquisitions since 2017, the largest in January 2023 with Citizens Bancshares ($985.7 million in total assets). That names the central tension of this analysis, and it runs through every chapter: the earnings engine runs smoothly and pays on time — but the cracks in the loan book are getting wider, and they sit exactly where the bank makes its money: commercial real estate, business customers and farmers.
Company history for investors
-
1887
Founded as a savings and loan
According to the annual report, the bank was chartered in 1887 as a mutual savings and loan in Missouri. For shareholders: deep local roots — which say nothing about today’s credit quality.
-
1993
Holding company for the conversion to a stock bank
On December 30, 1993, the holding company is incorporated to convert the bank from a mutual into a stock institution. For shareholders: the starting point of the dividend streak.
-
2023
Acquisition of Citizens Bancshares
In January 2023 a bank with $985.7 million in assets is added, the largest deal. For shareholders: a jump in size — and $17.1 million in credit provisions in the same fiscal year.
-
2025
Problem loans more than triple
On June 30, 2025, nonperforming loans stand at $23.0 million, after $6.7 million a year earlier. For shareholders: the point from which the loan book deserves more attention.
-
2026
Highest profit of the five years and buyback program
Fiscal 2026: $71.8 million in profit, a buyback program for up to 550,000 shares since January. For shareholders: more earnings per share, as long as credit costs cooperate.
-
2026
130th dividend and a change in finance
In October the bank declares its 130th consecutive quarterly dividend ($0.27, raised in July 2026); effective November 7 the finance function changes hands. For shareholders: continuity in the payout.
How the stock landed on our desk
Southern Missouri Bancorp landed on our desk through the quarterly report itself: on November 6, 2026, the bank filed its 10-Q for the first quarter of fiscal 2027, covering July through September 2026. The headline numbers had been out since the earnings release of October 21, 2026, and they are strong: net income of $19.1 million after $15.7 million in the year-ago quarter, and earnings per share of $1.73 after $1.38 — an increase of 25.4 percent.
A word on the calendar, because it is easy to trip over: this bank’s fiscal year ends on June 30. “Fiscal 2026” therefore means July 2025 through June 2026, and the “first quarter of fiscal 2027” is the summer of 2026.
The stock closed at $70.95 on November 13, 2026; over the preceding twelve months it traded between $52.72 and $79.86 (intraday low and high; source: fundamental data, as of November 14, 2026). That works out to a price-to-earnings ratio (P/E) of about 10.5 — in plain terms, you pay a little over ten years of profit for the stock. For a company whose earnings are up by a quarter, that looks cheap. This is exactly where the clockwork trap snaps shut. Because a bank is not a clockwork; it is a promise — that the billions it has lent out will come back. So remember this from the start: at a bank, today’s profit sits in the income statement — tomorrow’s loss sits in the loan book.
The numbers over the years — honestly appraised
First, what genuinely impresses — and there is plenty. Southern Missouri Bancorp earned $71.8 million in fiscal 2026, 22.6 percent more than the year before ($58.6 million) and more than in any of the five fiscal years the annual report presents. Per share that was $6.43 after $5.18. Net interest income — the difference between interest earned and interest paid — climbed from $154.6 million to $172.8 million. And, remarkably for a bank, operating expenses stayed essentially flat at $102.1 million. More revenue on the same cost base: that is what strong years are made of.
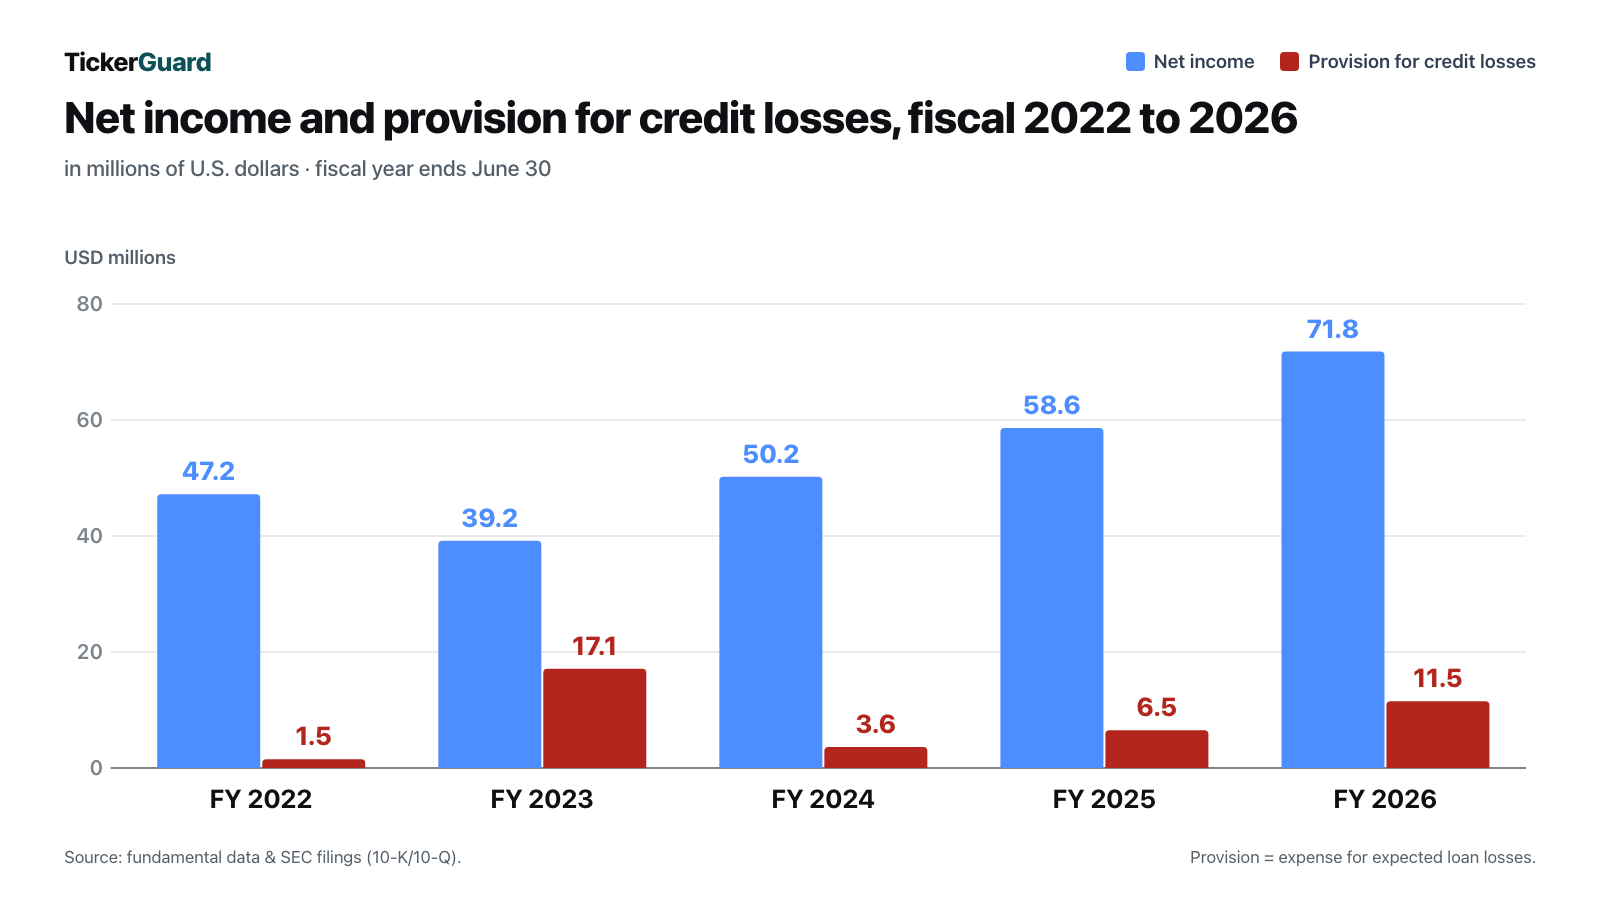
In numbers: net income for fiscal 2022 through 2026 was $47.2 million, $39.2 million, $50.2 million, $58.6 million and $71.8 million; the provision for credit losses — the expense for expected loan losses — was $1.5 million, $17.1 million, $3.6 million, $6.5 million and $11.5 million. The five-year series in the annual report also shows where the lift comes from. The net interest margin stood at 3.72 percent in fiscal 2022, fell to 3.27 percent by 2024 — when banks suddenly had to pay their savers a lot more — and recovered via 3.40 percent to 3.62 percent in fiscal 2026. In the quarter ended September 30, 2026, it was 3.70 percent. The quarterly report names the driver: the cost of interest-bearing liabilities fell 19 basis points (0.19 percentage points) from the year-ago quarter, while the yield on loans and investments slipped only four. Return on equity — how much profit the bank earns on every $100 of equity — rose from 10.39 percent (2023) to 12.66 percent (2026). For a regional bank, anything above 10 percent is decent; above 12 percent is good.
Two one-time items belong in the picture. First: in the final quarter of fiscal 2026 (April through June 2026), a tax benefit from tax credit investments lowered the tax bill by $1.7 million, according to the earnings release; it did not recur in the following quarter. That is why earnings per share of $1.73 in the latest quarter sit below the $1.83 of the quarter before, even though pre-tax business was better. Second: in the year-ago quarter, $572,000 in consulting fees for renegotiating a major vendor contract had weighed on profit — which makes the year-over-year comparison look a touch too friendly. Neither changes the picture, but both belong in the math.
The balance sheet has cushions, too. Equity stood at $601.1 million on September 30, 2026, or 11.3 percent of total assets. The total capital ratio — capital relative to risk-weighted loans and investments — was 14.04 percent for the consolidated company; the bank itself came in at 13.60 percent, and regulators classify an institution as “well capitalized” from 10 percent. The dividend, meanwhile, is modest: $1.00 per share in fiscal 2026, just under 16 percent of earnings. Since July 2026 (the 129th dividend, declared on July 21, 2026, payable August 31, 2026) it has been $0.27 instead of $0.25 per quarter. A bank that pays out only about a sixth of its profit can keep such a streak going for a long time. Remember the image: the dividend is not the stress test here — the loan book is.
What the filings say — the uncomfortable truths
Uncomfortable truth no. 1: since the mid-2024 low, nonperforming loans have quadrupled
Now for the look inside the case. A bank keeps a list of loans on which it no longer expects to receive interest and principal as agreed — and on which it therefore stops booking interest as income. These are the nonperforming loans. At Southern Missouri Bancorp, $6.7 million sat on that list on June 30, 2024 (June 30, 2022: $4.1 million; June 30, 2023: $7.7 million). A year later it was $23.0 million, on June 30, 2026, $27.7 million, and on September 30, 2026, still $26.7 million.
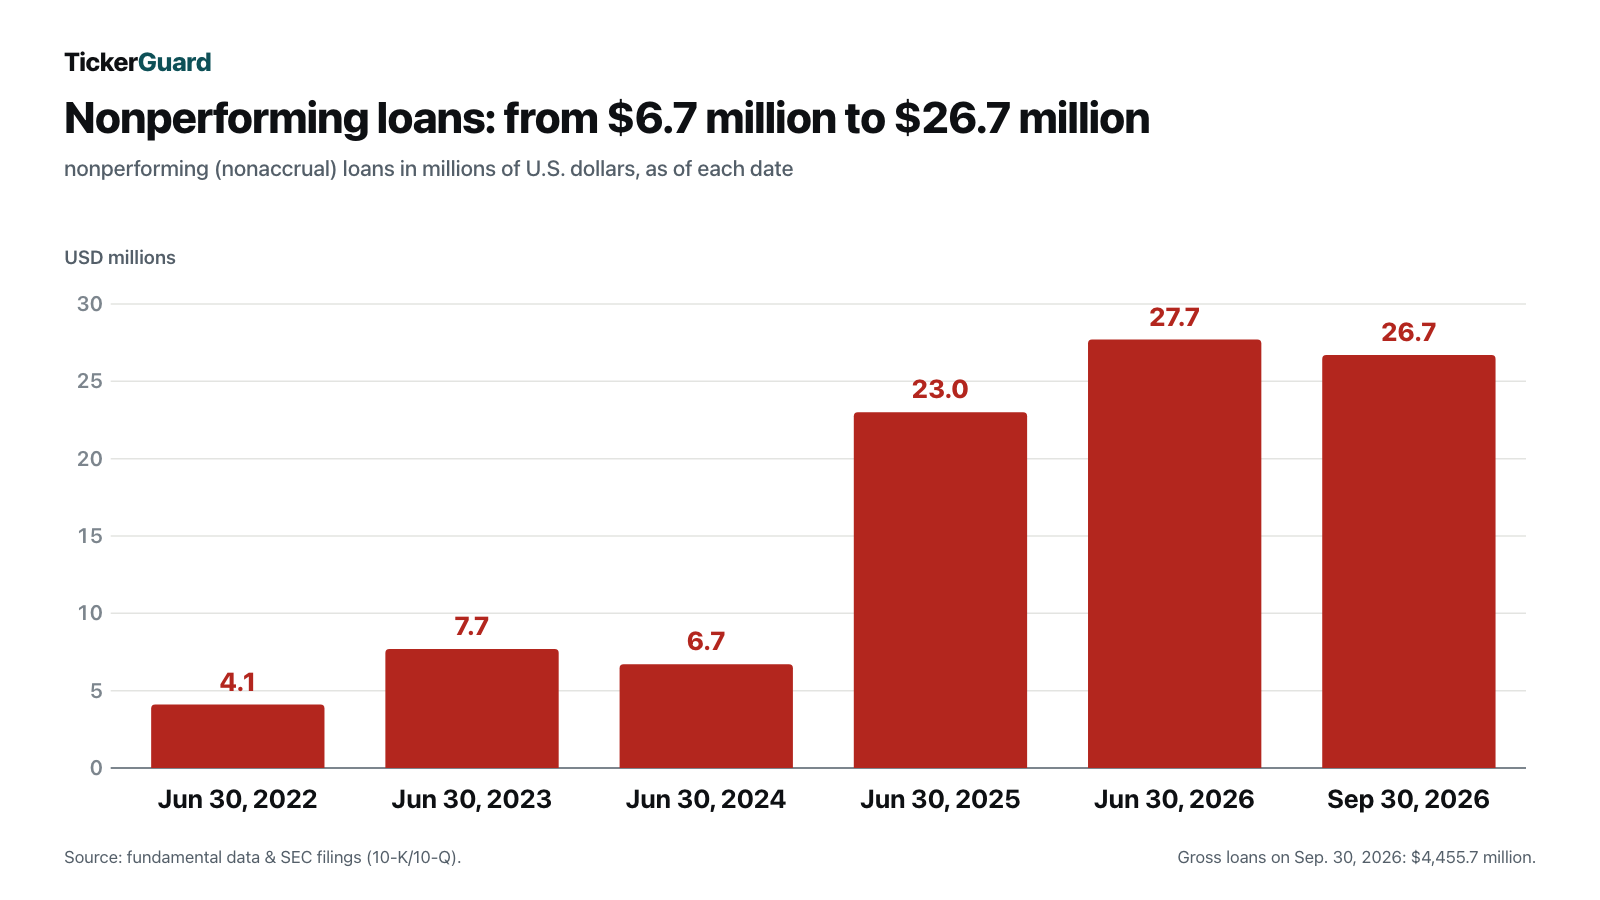
For context, and it matters: $26.7 million is 0.60 percent of all loans. The uncomfortable part is not the level but the direction — and where the cases come from. The annual report names the borrowers behind the latest increase:
“The year-over-year increase in nonaccrual loans was primarily attributable to three borrower relationships: one commercial relationship with a total loan balance of $6.5 million consisting of multiple related loans collateralized by commercial real estate and equipment; a second consisting of two related agricultural production loans totaling $2.2 million secured by crops and equipment; and the third, which was added during the quarter ended June 30, 2026, consisting of several related agricultural production loans totaling $5.9 million secured by crop insurance claims, restricted cash, crops, and equipment.”
— Southern Missouri Bancorp, Inc., SEC annual report 10-K for fiscal 2026, Item 1 “Asset Quality”

Loans secured by “crop insurance claims” — that suggests a crop loss has been reported and the bank is waiting for the insurance payout. Farming is the most conspicuous line: on September 30, 2026, the quarterly report shows $5.7 million of nonperforming loans in operating loans to farmers and $2.3 million in farmland — together just under 30 percent of the problem cases, although farm loans make up only 12.3 percent of the book. Actual write-offs are rising as well: in fiscal 2024 the bank charged off a net 0.05 percent of its loans, in 2025 it was 0.17 percent and in 2026 it was 0.18 percent. Against that stands a cushion: the allowance for credit losses — the pot the bank sets aside for expected losses — was $58.3 million on September 30, 2026, or 2.2 times the nonperforming loans. In mid-2024 that pot was still almost eight times the size of the problem cases (786 percent). So the buffer has not shrunk; the load it is meant to carry has grown.
Uncomfortable truth no. 2: $51 million in concessions, $106 million in loans of concern — the lists beneath the list
Nonperforming loans are only the top drawer. Below it sit loans that are still being paid, but where the bank has already helped out or has its doubts. The first of those drawers is called “modifications to borrowers experiencing financial difficulty.” In everyday terms: a landlord lowers the rent for a tenant who is short of cash so the tenant does not move out. The lease runs on, the rent comes in — but the worry is the same as before. The earnings release of October 21, 2026, has one sentence on this, right after the good news about slightly lower nonperforming loans:
“Performing loan modifications to borrowers experiencing financial difficulty totaled $51.1 million at September 30, 2026, compared to $31.0 million at June 30, 2026. The increase was primarily attributable to the modification of payment terms on a commercial and industrial loan.”
— Southern Missouri Bancorp, Inc., earnings release for the first quarter of fiscal 2027 (8-K Item 2.02, Exhibit 99.1, filed October 21, 2026)

The quarterly report of November 6, 2026, is more precise. There the main reason reads “an interest rate reduction on one commercial and industrial loan.” The bank does not say how large that one loan is. The table in Note 4 shows interest rate reductions on commercial and industrial loans totaling $21.1 million for the quarter — 3.74 percent of all the bank’s commercial and industrial loans. The scale: that line item, and likewise the increase in concessions of about $20 million in one quarter, is larger than the entire quarterly net income of $19.1 million. And the $51.1 million is almost twice the officially nonperforming loans. The report does not say which industries the borrowers belong to or what secures the loans. Important for context: according to the quarterly report, the $51.1 million is being paid under the modified terms, and none of the loans modified during the quarter was more than 90 days past due.
An illustration, not a forecast: if the entire $21.1 million line item were lost and nothing had yet been reserved for it, that would cost $21.1 million before taxes — at the latest quarter’s tax rate of 19.0 percent about $17 million after taxes, or roughly $1.56 per share, almost one quarter’s earnings ($1.73). It would not topple the bank: the allowance for credit losses is $58.3 million and equity is $601.1 million.
There is a third drawer that is opened only once a year. In the annual report, the bank lists loans that are still performing under their contracts but where management has concerns about whether the borrowers will hold up:
“At June 30, 2026, these other loans of concern totaled $105.7 million, as compared to $77.0 million at June 30, 2025.”
— Southern Missouri Bancorp, Inc., SEC annual report 10-K for fiscal 2026, Item 1 “Other Loans of Concern”
The report also gives the cause: the increase came primarily from 41 loans, mostly farm loans, owner-occupied commercial real estate and commercial and industrial loans, and it adds: “Agricultural real estate and production lending borrowers continue to experience financial pressure from lower commodity prices and elevated input costs.” $105.7 million equaled just under 18 percent of the $590.7 million in equity at that date. To be fair: these loans are being paid, nobody knows how many will ever default, and the bank discloses the figure this clearly of its own accord. But all three drawers point the same way.
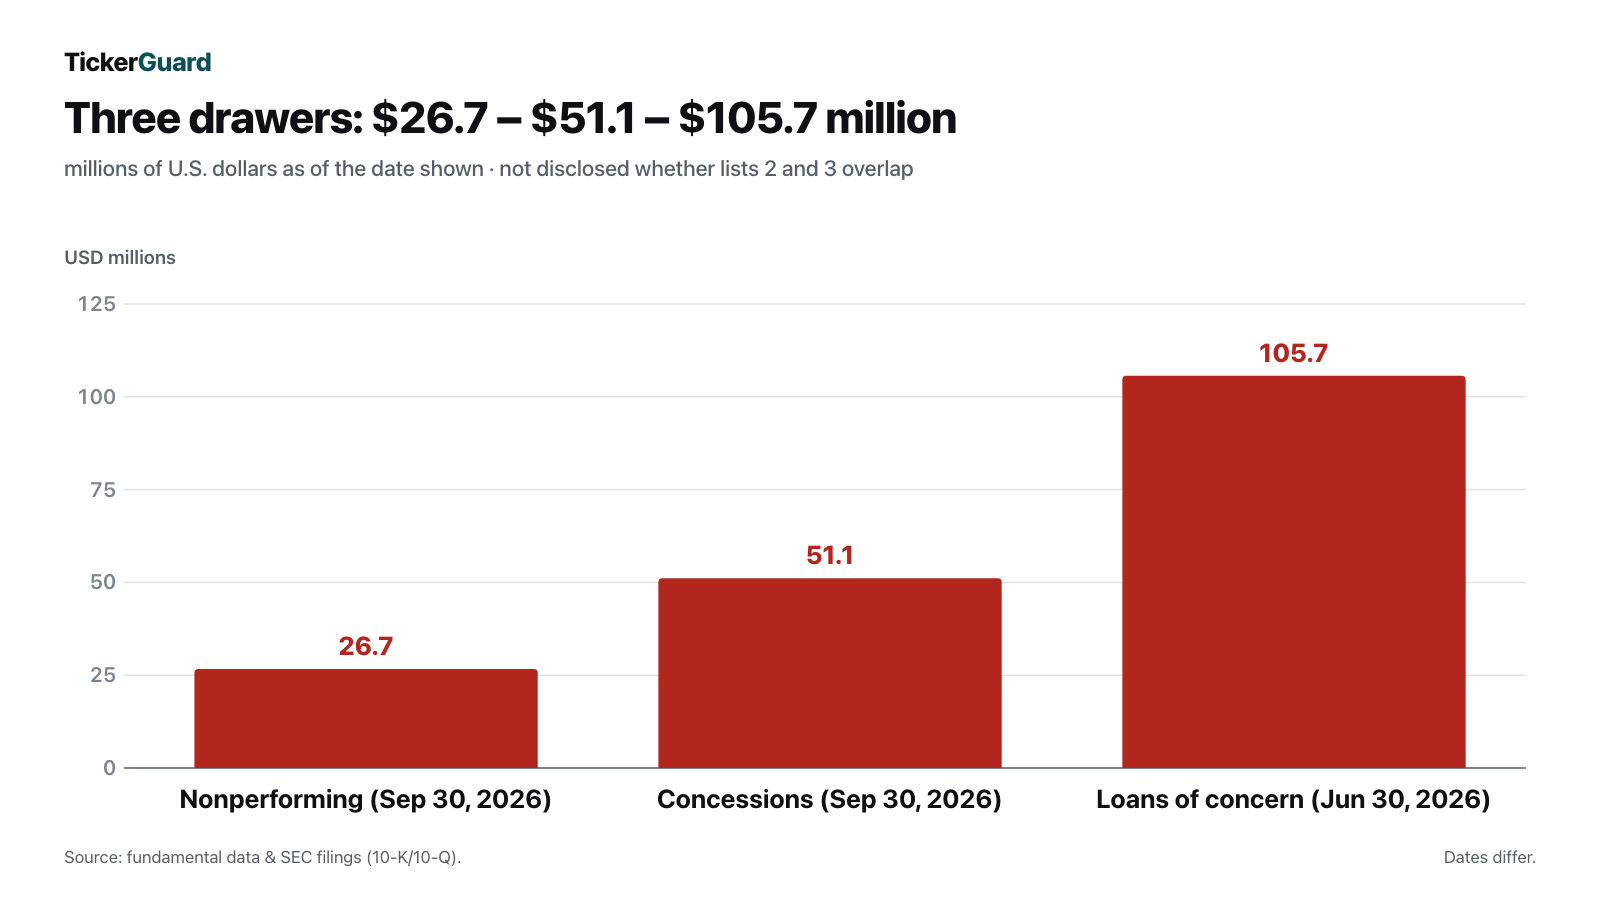
Remember the image: the headline shows the top drawer. The action is in the two below. The difference from Plumas Bancorp, a regional bank from California: there the finding sat in the top drawer — the problem loans themselves hit a multi-year high. Here it sits in the lists below.
Uncomfortable truth no. 3: commercial real estate equals 2.8 times core capital
U.S. bank regulators have a rule of thumb for concentration risk: if loans for rented-out commercial real estate, apartment buildings and construction projects exceed 300 percent of core capital and that portfolio has grown by at least half in three years, they take a closer look. The quarterly report gives the current reading:
“The Bank’s concentration in non-owner occupied commercial real estate loans, as defined by banking regulatory guidance and including multi-family and construction and land development loans, was estimated at 277.7% of Tier 1 capital and ACL at September 30, 2026, as compared to 287.7% as of June 30, 2026, the linked quarter end, with these loans representing 37.9% of total loans at September 30, 2026.”
— Southern Missouri Bancorp, Inc., SEC quarterly report 10-Q for September 30, 2026, Item 2 (MD&A)

In everyday terms: picture having lent 2.8 times your entire savings to people who run hotels, care facilities and strip centers with it — not your own money, but your neighbors’, for which you are on the hook. As long as the tenants pay, that is good business. The bank is moving in the right direction: on June 30, 2025, the ratio was still 301.1 percent according to the annual report, above the marker. And the second half of the rule of thumb does not apply — the portfolio grew only 14.9 percent in the three years through June 30, 2026. Even so, the annual report gives the topic its own risk factor under the heading “The level of our non-owner occupied commercial real estate portfolio may subject us to additional regulatory scrutiny.” For you that means: the room to keep growing in this field is limited, and a downturn in commercial real estate would hit more than a third of the loan book.
Uncomfortable truth no. 4: four of every ten deposit dollars are time deposits — and the finance function changes hands
The other side of a bank is its funding. The cheapest money is checking accounts on which customers leave their cash without interest. At Southern Missouri Bancorp that was only $541 million on September 30, 2026, or 12.1 percent of the $4.47 billion in deposits. By contrast, $1.80 billion — a little over 40 percent — sits in certificates of deposit, on which the bank has to pay rates close to the market. $271 million comes through brokers (brokered deposits): money the bank buys in, and which moves on to wherever the rate is higher. Another $475 million belongs to municipalities and other public bodies. In the latest quarter the bank spent $28.2 million on deposit interest — 37 percent of its total interest income of $75.8 million. And it has lent out almost everything it has collected: the average loan-to-deposit ratio for the quarter was 98.8 percent.
This is not a funding problem. According to the quarterly report, the bank can borrow roughly $1 billion from the Federal Home Loan Bank — a kind of central cash pool for U.S. banks — and had drawn only $122.7 million of that on September 30, 2026. But it explains what the margin hangs on: when rates fall, the certificates of deposit get cheaper and the margin rises — which is exactly what happened recently. When they rise again, the film runs backward, as it did between 2022 and 2024, when the margin fell from 3.72 percent to 3.27 percent.
Finally, a personnel matter. Between the earnings release and the quarterly report, the bank reported on October 29, 2026:
“On October 26, 2026, Stefan Chkautovich, Executive Vice President and Chief Financial Officer of Southern Missouri Bancorp, Inc. (the “Company”) and its wholly-owned subsidiary, Southern Bank (the “Bank”), informed the Company and the Bank that he was resigning his employment effective November 7, 2026, to pursue another professional opportunity.”
— Southern Missouri Bancorp, Inc., SEC current report 8-K of October 29, 2026, Item 5.02

The filing gives another professional opportunity as the reason. According to the same filing, Chkautovich had been chief financial officer since August 31, 2023; his resignation took effect on November 7, 2026, one day after the quarterly report was filed. As of that date, President Matthew T. Funke, who was the bank’s chief financial officer from 2006 to 2022, was appointed principal financial officer — in addition to his existing duties and with no new compensation arrangement. The filing names no further successor.
Valuation: what the November 13, 2026, close implies
How expensive is the stock? At the $70.95 close on November 13, 2026, and 10,927,606 shares outstanding (as of November 5, 2026, per the cover of the quarterly report), the bank has a market value of about $775 million. Earnings over the last four quarters come to $6.78 per share, which gives the P/E of about 10.5. For banks, book value matters alongside. Equity per share was $54.91 on September 30, 2026; strip out goodwill and other intangibles from the acquisitions and $48.52 of tangible book value remains. So the stock costs about 1.3 times book value and 1.46 times tangible book value. The dividend, most recently $0.27 per quarter, works out to a yield of about 1.5 percent a year.
The bank itself supplies an honest yardstick. In the quarter ended September 30, 2026, it bought back 19,000 of its own shares at an average of $72.63 and noted in the earnings release that this was 150 percent of tangible book value. The November 13 price sits slightly below that. A yardstick from the stock’s own history: at the five quarter-ends from September 2025 through September 2026, the stock traded, per the earnings release, between 1.21 times (September 30, 2025: $52.56 against $43.35 of tangible book value) and 1.61 times (June 30, 2026: $76.21 against $47.43) tangible book value. The professionals’ view: six analysts follow the stock, five of them rate it a hold and one a buy; their average price target is $78.40 (source: fundamental data, as of November 14, 2026). An average means all targets added up and spread evenly — a single optimist pulls it upward. Five of six votes for “hold” is, in any case, not euphoria.
So what does the price ask for? A P/E of a little over ten is not expensive for a regional bank with a return on equity above 12 percent. But it is calculated on the profit of a year in which the provision for credit losses cost $11.5 million — just under 12 percent of earnings before taxes and provisions. In fiscal 2023 it was $17.1 million. The price assumes that the three drawers from the previous chapter do not all open at once. A different kind of case is Byline Bancorp of Chicago: there the fine print hung on a government guarantee, not on concessions to borrowers.
Opportunities and risks at a glance
What speaks for Southern Missouri Bancorp:
- Strong earnings on a broad base: $71.8 million in fiscal 2026 (up 22.6 percent), net interest income of $172.8 million, operating expenses steady at $102.1 million; in the quarter ended September 30, 2026, the efficiency ratio was 50.0 percent according to the earnings release.
- Rising margin and returns: net interest margin of 3.70 percent, return on equity of 12.7 percent, return on assets of 1.44 percent (each for the quarter ended September 30, 2026, annualized).
- A thick capital cushion: $601.1 million in equity, a total capital ratio of 14.04 percent and a Tier 1 leverage ratio of 11.18 percent (September 30, 2026) — the bank is classified as well capitalized.
- A reliable, conservatively set payout: quarterly dividend raised to $0.27 in July 2026, payout ratio of just under 16 percent; plus a buyback program for up to 550,000 shares (January 2026).
- The problem ratios are still low in absolute terms: nonperforming loans at 0.60 percent of loans, the allowance at 219 percent of that, and net charge-offs in the latest quarter at 0.04 percent (annualized).
What speaks against it:
- The direction of credit quality: nonperforming loans at four times the mid-2024 low, and the net charge-off rate up from 0.05 percent to 0.18 percent (fiscal 2024 and 2026).
- The lists below are growing faster: concessions to borrowers in financial difficulty at $51.1 million after $31.0 million in one quarter — including rate reductions on commercial loans totaling $21.1 million — and other loans of concern at $105.7 million after $77.0 million (June 30, 2026 and 2025).
- Commercial real estate concentration: 37.9 percent of all loans and just under the supervisory marker, with hotels, restaurants and care facilities as the largest groups (September 30, 2026).
- Farm concentration: $548 million in farm loans, 91 percent of equity; the annual report itself cites lower commodity prices and higher input costs as ongoing pressure on farmers.
- Expensive, rate-dependent funding (a little over 40 percent time deposits, $271 million in brokered deposits, loans at 98.8 percent of deposits).
A human conclusion
Back to the clockwork trap from the beginning. Its core is not that the streak is a lie — 130 dividends in a row are real, and so is the $71.8 million profit. Its core is that a long streak gets you to read the future off the ticking instead of off the condition of the movement. And the movement of a bank is its loan book. At Southern Missouri Bancorp, it shows 0.60 percent nonperforming loans, a filled allowance and plenty of equity. But a direction is written there, too: four times as many problem loans as a little over two years ago, $20 million in new concessions in one quarter, $105.7 million on the worry list — and all of it in a book that is more than a third commercial real estate and an eighth farm loans.
The honest question for you is therefore not “Can a bank with 130 dividends in a row disappoint at all?” but: do you believe the rise in problem loans has peaked — or that it is only just arriving in the drawers below? If you believe the first, you have a thesis that every quarterly report will confirm or refute. If you do not know, all you have heard so far is ticking. What you make of it is your decision. And that is exactly as it should be.
Sources
All original documents used in this analysis — to read for yourself:
- Southern Missouri Bancorp, Inc. — SEC quarterly report 10-Q for September 30, 2026 (filed November 6, 2026)
- Southern Missouri Bancorp, Inc. — earnings release for the first quarter of fiscal 2027 (8-K Item 2.02, Exhibit 99.1, filed October 21, 2026)
- Southern Missouri Bancorp, Inc. — SEC current report 8-K of October 29, 2026 (Item 5.02 change in the finance function, Item 5.07 annual meeting)
- Southern Missouri Bancorp, Inc. — SEC current report 8-K of November 4, 2026 (Item 7.01, investor presentation)
- Southern Missouri Bancorp, Inc. — SEC annual report 10-K for fiscal 2026 (filed September 11, 2026)
- Southern Missouri Bancorp, Inc. — earnings release for the fourth quarter of fiscal 2026 with the dividend increase to $0.27 (8-K Item 2.02, Exhibit 99.1, filed July 22, 2026)
- Complete SEC filing history of Southern Missouri Bancorp, Inc.: EDGAR overview (sec.gov)
- Fundamental data (prices, market value, analyst estimates; as of November 14, 2026), reconciled with the SEC filings.
Transparency & disclaimer: this analysis is journalistic commentary on publicly available information. It is not investment advice, not a regulated investment research product and not a solicitation to buy or sell securities. Equity investments carry substantial risk up to and including total loss. All information is provided without warranty; the as-of date for each figure is stated in the text. Positions held by the operator are disclosed daily; where one exists, it appears as a notice at the top of this analysis.
Key figures at a glance
All monetary figures in millions of $; earnings per share as reported.
| Metric | 2022 | 2023 | 2024 | 2025 | 2026 |
|---|---|---|---|---|---|
| Revenue | 138.1 | 202.6 | 273.2 | 305.2 | 316.5 |
| Operating Income (EBIT) | 59.9 | 49.5 | 63.1 | 74.0 | 87.1 |
| Net Income | 47.2 | 39.2 | 50.2 | 58.3 | 71.8 |
| Net Margin | 34.2% | 19.4% | 18.4% | 19.1% | 22.7% |
| Earnings Per Share | 5.23 $ | 3.46 $ | 4.44 $ | 5.18 $ | 6.46 $ |
Source: fundamental data & SEC filings (annual and quarterly reports, 10-K/10-Q)
Our Bottom Line at a Glance
- Earnings power positive
- Net income of $71.8 million in fiscal 2026 (up 22.6 percent, the highest of the five fiscal years presented) on steady operating expenses of $102.1 million; in the quarter ended September 30, 2026, a net interest margin of 3.70 percent and a return on equity of 12.7 percent. Part of the lift comes from lower deposit costs and is therefore rate-dependent.
- Capital & substance positive
- Equity of $601.1 million (11.3 percent of total assets), a total capital ratio of 14.04 percent and a Tier 1 leverage ratio of 11.18 percent as of September 30, 2026 — well above the thresholds for “well capitalized.” The allowance of $58.3 million covers nonperforming loans 2.2 times.
- Credit quality negative
- The level is unremarkable (0.60 percent nonperforming loans); the direction is not: $26.7 million after $6.7 million within a little over two years, concessions to borrowers in financial difficulty at $51.1 million after $31.0 million in one quarter, and other loans of concern at $105.7 million after $77.0 million (June 30, 2026 and 2025).
- Concentration risks negative
- Commercial real estate loans as defined by regulators are estimated at 277.7 percent of Tier 1 capital plus the allowance (supervisory marker 300 percent; June 30, 2025: 301.1 percent) and 37.9 percent of the loan book. $548 million in farm loans account for just under 30 percent of nonperforming loans (September 30, 2026).
- Funding neutral
- A little over 40 percent of the $4.47 billion in deposits are certificates of deposit and only 12.1 percent bear no interest; $271 million are brokered deposits, and loans equal 98.8 percent of deposits (quarterly average through September 30, 2026). Against that stands roughly $1 billion of available credit at the Federal Home Loan Bank, of which $122.7 million is drawn.
- Management & payout neutral
- 130 consecutive quarterly dividends at a payout ratio of just under 16 percent and an active buyback program point to discipline. Chief Financial Officer Stefan Chkautovich left effective November 7, 2026; President Matthew T. Funke, CFO from 2006 to 2022, takes on the role in addition.
Southern Missouri Bancorp is the clockwork trap in its friendly form: a regional bank with the highest annual profit of the last five fiscal years ($71.8 million in fiscal 2026), a rising margin, a thick capital cushion and 130 dividends in a row — and a loan book in which nonperforming loans have risen from $6.7 million to $26.7 million since June 2024, concessions to borrowers grew by $20 million in one quarter — in the same quarter the bank cut the rate on commercial loans totaling $21.1 million — and commercial real estate equals 277.7 percent of Tier 1 capital plus the allowance. The substance holds; what is open is whether the deterioration in credit quality has peaked. Not investment advice.
What Our Rating Means
Open questions
The business works in principle, but one material question is open. As long as it stays open, our findings do not carry a quality verdict.
The bank earns well, is strongly capitalized and pays reliably — the filings show no risk to its substance. One material operating question is open: whether the rise in problem loans (four times the June 2024 level, plus $51.1 million in concessions and $105.7 million in loans of concern) fades out or continues in a loan book that is more than a third commercial real estate and an eighth farm loans. If you hold the stock, you are betting that margin and capital will absorb higher losses; if you wait, the first lines to read in the next quarterly report are nonperforming loans, modifications and the provision. At a P/E of about 10.5, little euphoria is priced in. The decision is yours.
A journalistic assessment by our editorial team at the time of the deep dive, based on public sources — not investment advice and not a solicitation to buy or sell. Your personal circumstances (investment goals, risk capacity, taxes) cannot be taken into account. What our levels mean, how verdicts are formed, and what conflicts of interest exist →
Worth Noting
- The trigger for this analysis was the quarterly report (10-Q) of November 6, 2026, for the quarter ended September 30, 2026; every filing made since then was reviewed (as of November 14, 2026).
- The fiscal year ends on June 30: “fiscal 2026” means July 2025 through June 2026. The figures in the October 21, 2026, earnings release were preliminary; the quarterly report is authoritative.
- For banks, metrics such as the Altman Z-score or net current asset value are not meaningful; this analysis therefore works with net interest margin, credit quality, capital ratios and book value. Valuation figures are dated (close of November 13, 2026); daily prices are not a buy argument.
Stock Watch
This analysis is as of November 14, 2026. Stock Watch will tell you what's changed at SMBC since then.
Later $1 a month per stock — signing up is free, and you'll be the first to know when it launches.
The full analysis as a PDF for later
We will send you this analysis as a PDF — to print, file away, and read at your own pace. And we will add you to the free Stock Watch list for Southern Missouri Bancorp Inc (SMBC), so you hear about it when something material in this analysis changes.
Frequently Asked Questions
Southern Missouri Bancorp, Inc. (Nasdaq: SMBC) of Poplar Bluff, Missouri, is the holding company of Southern Bank, founded in 1887. On June 30, 2026, the regional bank operated its headquarters plus 63 full-service branches in Missouri, Arkansas, Illinois and Kansas. It takes deposits and makes home, commercial real estate, business and farm loans. On September 30, 2026, total assets were $5.31 billion and the loan book $4.46 billion.
In fiscal 2026 (July 1, 2025, through June 30, 2026) the bank earned $71.8 million, 22.6 percent more than the year before, with a return on equity of 12.66 percent and a net interest margin of 3.62 percent. In the first quarter of fiscal 2027 (through September 30, 2026) net income was $19.1 million, or $1.73 per share, and the margin was 3.70 percent.
On October 20, 2026, the bank declared its 130th consecutive quarterly dividend, unchanged at $0.27 per share; the increase from $0.25 to $0.27 came in July 2026 with the 129th dividend. In fiscal 2026 it paid out $1.00 per share against earnings of $6.43 per share — a payout ratio of just under 16 percent. The dividend is therefore well covered; a long streak is not a guarantee for the future.
Nonperforming loans rose from $6.7 million (June 30, 2024) to $26.7 million (September 30, 2026), which is 0.60 percent of all loans. The allowance for credit losses of $58.3 million covers them 2.2 times. At the same time, concessions to borrowers in financial difficulty rose from $31.0 million to $51.1 million in the latest quarter, and other loans of concern stood at $105.7 million on June 30, 2026.
Loans for rented-out commercial real estate, apartment buildings and construction projects were estimated at 277.7 percent of Tier 1 capital plus the allowance and 37.9 percent of all loans on September 30, 2026; regulators look more closely from 300 percent. Farm loans added up to $548 million, 12.3 percent of the loan book, but accounted for just under 30 percent of nonperforming loans.
Southern Missouri Bancorp reports on a fiscal year that ends on June 30. Fiscal 2026 therefore covers July 1, 2025, through June 30, 2026, and the first quarter of fiscal 2027 covers July through September 2026. Anyone comparing its numbers with banks on a calendar year has to allow for that half-year shift.
At the $70.95 close on November 13, 2026, and 10,927,606 shares, the market value was about $775 million. That equals a price-to-earnings ratio of about 10.5 on the earnings of the last four quarters ($6.78 per share), 1.3 times book value ($54.91) and 1.46 times tangible book value ($48.52 per share, September 30, 2026).
Found an error?
Did you spot a factual error, an outdated number, or a typo in this deep dive? Let us know briefly — your report goes straight to the editorial team.