Papa John's: The Dividend Ate All of 2025's Free Cash Flow — a Year Later It Was Gone
Everyone knows Papa John's: six ingredients in the dough, a brand since 1984, roughly 6,000 restaurants. Revenue has not moved in five years, net income fell from $120.0 million to $30.5 million, and in fiscal 2025 a dividend of $61.141 million consumed free cash flow of $61.305 million almost to the dollar. On August 6, 2026 the board suspended the dividend and cut its earnings guidance by $20 million. The balance sheet at June 28, 2026 carries a $442.3 million stockholders' deficit. We read the filings to the U.S. securities regulator, the SEC, line by line — and show you where this warning was already printed in black and white a year earlier.
 Thomas Mücke
Founder & Publisher
Thomas Mücke
Founder & Publisher
As of Today
As of: October 5, 2026
- Closing price
- 19.50 $ +0.60%
- Market Capitalisation
- 0.6 $B
- P/E
- 24.7
- Growth Score
- 3/10
- AAQS
- 3/10
Price change since August 20, 2026: -16.4%
This analysis has a cut-off date. The Stock Guard tells you when something material changes in the numbers. Reserve your free spot
Chart
Interactive price chart (TradingView).
52-week range: 19.40 $ to 55.30 $ · Last price: 19.50 $ (As of: October 5, 2026)
Note: pure fact-based analysis, not investment advice and not a solicitation to buy or sell. All figures without guarantee.
There is an investor habit that dresses itself up as prudence, and it goes like this: "The company has paid a dividend for years, so things cannot be that bad." Call it the dividend trap. It is dangerous precisely because a running dividend looks like a seal of quality — a visible, recurring sign of life from the cash register. But a dividend is not proof that the money is there. It is proof that somebody decided to wire it.
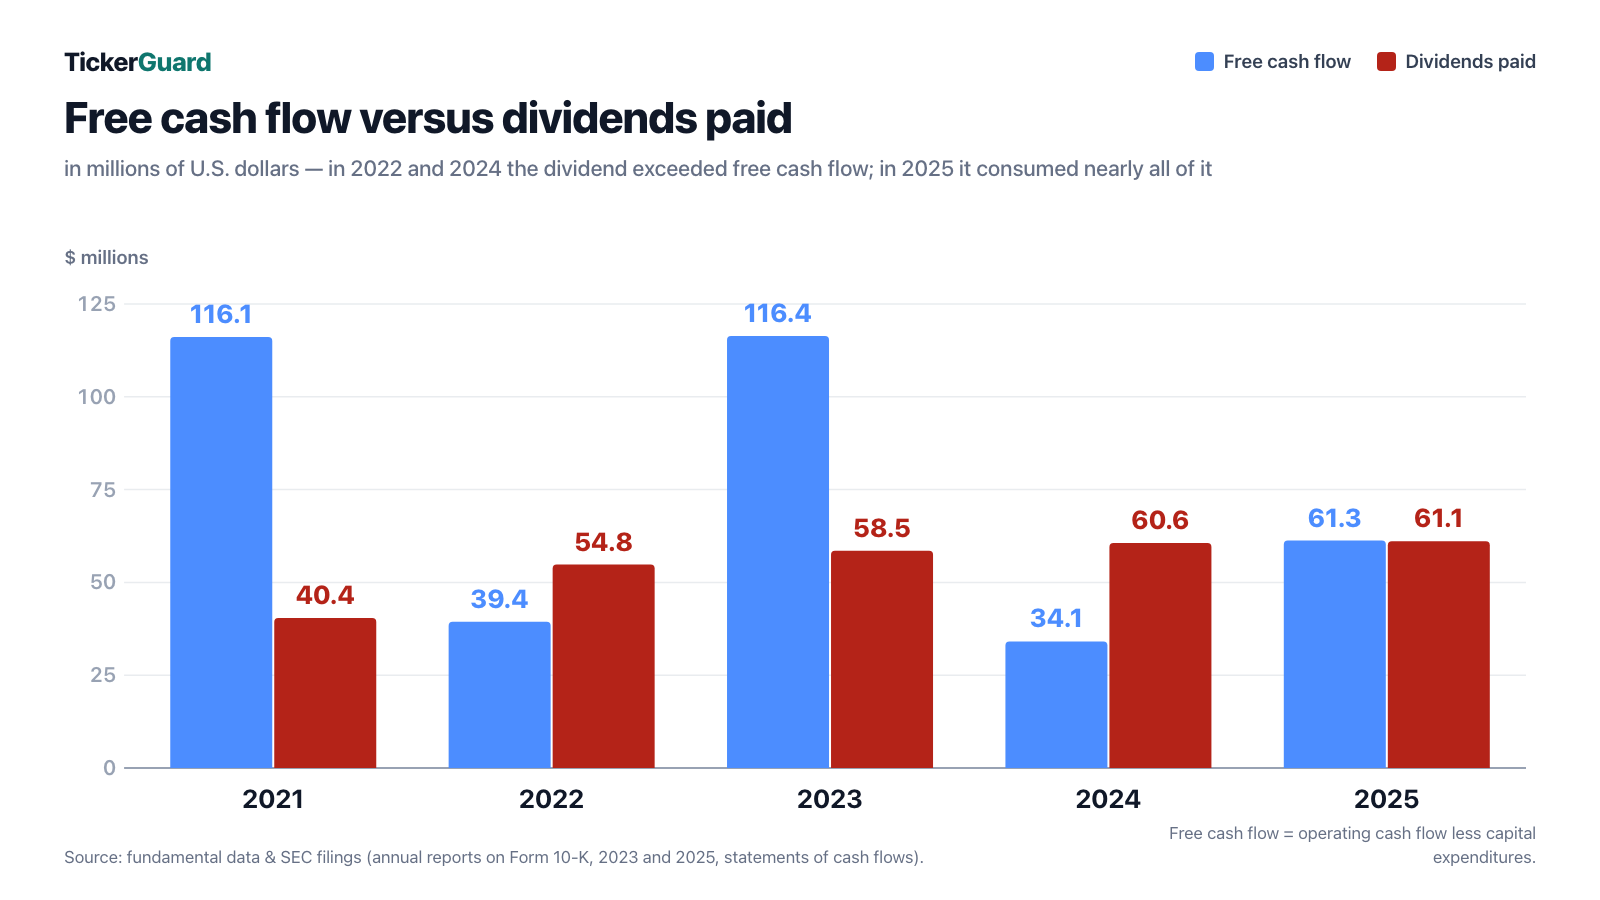
At Papa John’s International, Inc. that trap can be measured unusually well, because the two relevant numbers sit next to each other in the annual report. In fiscal 2025 the company generated free cash flow of $61.305 million. In the same year it paid $61.141 million of dividends to common stockholders. That left $164 thousand — at a company with more than $2 billion of revenue. A year later, on August 6, 2026, the board pulled the plug. So here is the deal: we read the quarterly report for the period ended June 28, 2026, the earnings release filed the same day, and the annual reports behind them — and by the end you will know which of these numbers an investor could already have seen in 2025. What you do with that is your call.
What Papa John’s actually earns — and where the money really comes from
Papa John’s opened its first restaurant in 1984 in Jeffersonville, Indiana, went public in 1993 and trades on Nasdaq under the ticker PZZA. It is co-headquartered in Louisville, Kentucky and Atlanta, Georgia. As of June 28, 2026 there were 5,978 Papa Johns restaurants in 51 countries and territories.
The first instinct — "a pizza chain with 6,000 stores" — is misleading. Only 456 of those restaurants are company-owned in North America, plus 13 in the United Kingdom. The remaining 5,509 are franchised: independent operators renting the sign, the recipe and the advertising. Papa John’s therefore earns money in four clearly separated segments, and they are very different animals.
- Domestic company-owned restaurants. Segment revenue of $138.936 million in the quarter ended June 28, 2026, segment adjusted EBITDA of $6.635 million. This is the labor-heavy, thin-margin part — roughly five cents of every revenue dollar stayed in the business.
- North America franchising. Segment revenue of $33.268 million, segment adjusted EBITDA of $23.740 million. This is the real earnings engine: the standard franchise agreement carries a royalty of 5 percent of gross restaurant sales, and it costs the company almost nothing to collect. About 71 cents of every segment revenue dollar stayed in.
- North America commissaries. Segment revenue of $255.829 million, segment adjusted EBITDA of $22.334 million. Eleven quality control centers in the United States and one in Canada make dough and deliver sauce, cheese, paper and cleaning supplies twice a week to every traditional restaurant. Franchisees are required to buy dough and pizza sauce there. High volume, thin margin — just under nine cents on the dollar.
- International. Segment revenue of $45.040 million, segment adjusted EBITDA of $7.371 million. Almost entirely franchised, with 2,539 restaurants.
The takeaway: Papa John’s is, to a large degree, not a pizza baker but a licensing and logistics business. That explains why a decline in restaurant sales hits consolidated earnings so hard. When franchise restaurant sales fall, the royalty falls and the volume moving through the commissary falls. Two segments get hit by the same event.
The annual report states average unit volumes for 2025 openly: $1.3 million at a company-owned restaurant and $1.1 million at a North America franchised restaurant. A franchisee therefore pays roughly $55 thousand of royalties a year — on top of everything it must buy from the commissary.
Company history for investors
-
2021
September: $400 million of 3.875 percent senior notes
The company locks in cheap debt through September 2029. For shareholders that means predictable interest — and a debt load that must be serviced regardless of how sales develop.
-
2023
December: the international overhaul begins
The International Transformation Plan starts and costs $34.4 million through the end of 2025. It pays off: international is today the only growing part of the company.
-
2024
August: Todd Penegor becomes chief executive
The former Wendy's CEO takes over. For investors the turnaround clock starts here; two years on, the interim scoreboard reads falling sales and a suspended dividend.
-
2025
November: 85 company-owned restaurants refranchised
The transaction removes roughly $25 million of reported revenue per quarter and makes the numbers harder to compare from 2026 onward — a detail every revenue comparison has to account for.
-
2025
December: Enterprise Transformation Plan approved
The board launches a restructuring program with restaurant closures and a 7 percent smaller corporate workforce. Cost $24 million to $31 million; the hoped-for return is at least $30 million of savings by 2027.
-
2026
June 30: the chief financial officer resigns
Ravi Thanawala leaves for another public company. Five weeks later the dividend and the guidance fall — and the interim fix is the same executive's second tour in that seat.
-
2026
August 6: dividend suspended, guidance cut
The board suspends the quarterly dividend from the third quarter and cuts the adjusted EBITDA expectation by $20 million. Roughly $61 million a year now stays inside the company rather than going to shareholders.
How the stock landed on our desk
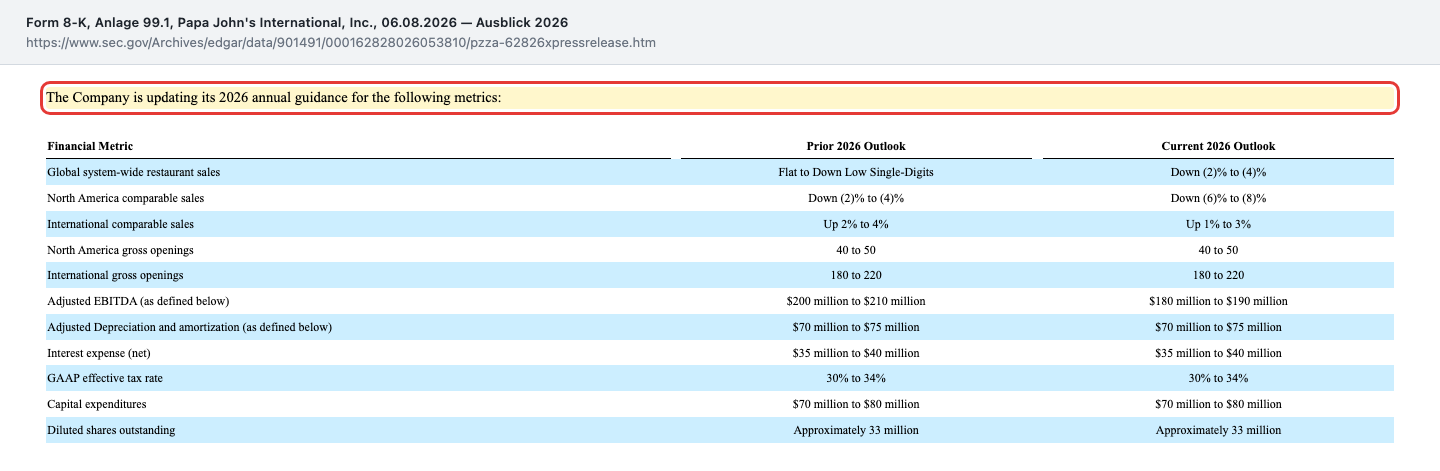
No screen led us here; a mandatory filing did. On August 6, 2026 Papa John’s filed a current report with the SEC — Form 8-K, Item 2.02, the item reserved for results announcements. The quarterly report on Form 10-Q for the period ended June 28, 2026 was filed the same day. Exhibit 99.1 of that release contains three things that rarely appear together: a revenue decline, a cut to full-year guidance, and the suspension of the dividend.
Anyone who collects filings knows that a board never cuts a dividend casually. It is the most visible surrender to one’s own cash position a public company can make. Which is exactly why the second look pays — especially since the chief executive is unusually candid in the same release:
"While our transformation is taking longer than anticipated, we continue to execute our strategy with discipline and focus and are seeing encouraging progress, including a growing and highly engaged Papa Rewards membership, supply chain savings, and AI-driven improvements to the customer ordering experience."
— Todd Penegor, President and CEO, Papa John’s International, Inc., Form 8-K filed August 6, 2026, Exhibit 99.1
Our in-house stock scanner adds a picture that is strikingly contradictory (data as of August 20, 2026). The Piotroski score sits at 5 out of 9. That scale measures nine markers of balance sheet health, from profitability through leverage to efficiency. Five of nine is mediocre — a genuinely healthy company scores 8 or 9. The Altman Z-score of 3.12, by contrast, sits above the 2.6 threshold that this variant for service companies and non-manufacturers (the Z″-score) treats as the safe zone; it deliberately uses book value instead of market capitalization, which makes it more informative for a franchisor like Papa John's than the classic Altman Z built for manufacturers. The price trend leaves no room for interpretation: as of August 20, 2026 the stock traded 57.8 percent below its 52-week high and just 0.4 percent above its 52-week low.
The numbers over the years — credit where it is due
Start with what genuinely impresses, because there is something. Papa John’s turns over more than $2 billion a year, has been profitable for decades, produced positive operating cash flow in every one of the last five fiscal years, and its international business reported its seventh consecutive quarter of positive comparable sales in the period ended June 28, 2026. None of that is trivial.
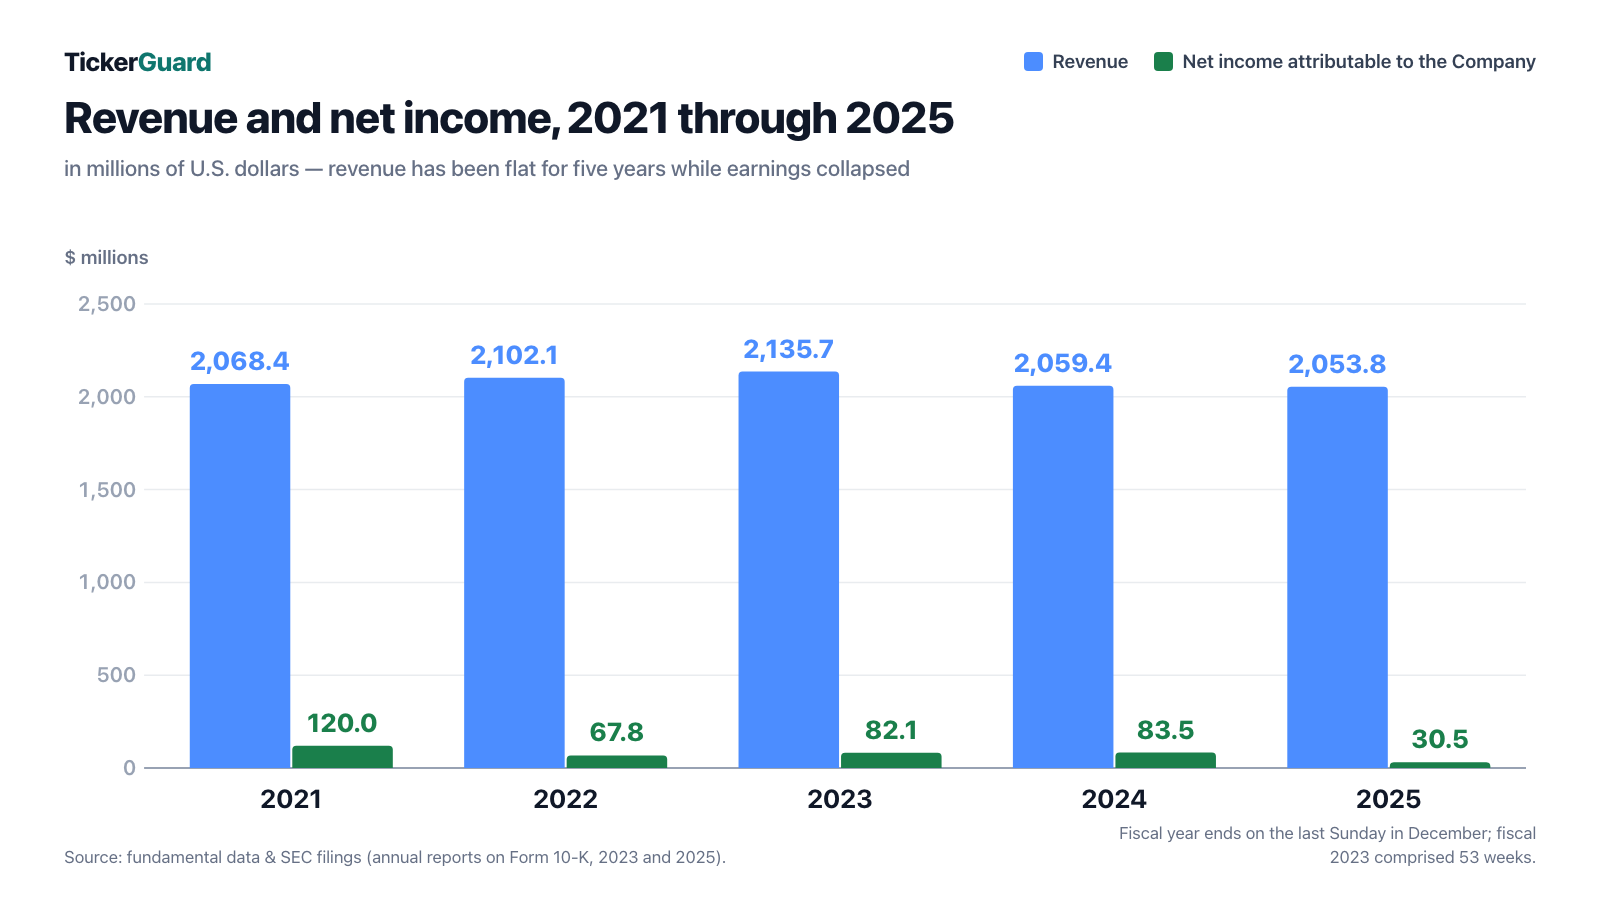
Now the uncomfortable part. Revenue has been essentially flat for five years: $2,068.4 million (2021), $2,102.1 million (2022), $2,135.7 million (2023), $2,059.4 million (2024) and $2,053.8 million (2025). The peak year 2023 carried a technical advantage the annual report states plainly: the fiscal year ends on the last Sunday in December, and fiscal 2023 comprised 53 weeks rather than 52 — one extra week of trading compared with every other year in the series.
Earnings tell a clearer story. Net income attributable to the company fell from $120.0 million (2021) through $67.8 million (2022), $82.1 million (2023) and $83.5 million (2024) to $30.5 million in 2025. Diluted earnings per share fell from $2.54 (2024) to $0.90 (2025). Out of every revenue dollar in 2025, 1.5 cents made it to the bottom line.
The current year continues the trend. In the quarter ended June 28, 2026 revenue fell 8.8 percent to $482.397 million, net income slipped $1.0 million to $8.700 million, and diluted earnings per share went from $0.28 to $0.24. Part of the revenue decline is explainable and not alarming: roughly $25 million relates to 85 company-owned restaurants refranchised in the fourth quarter of 2025 — their sales no longer show up as company revenue, though their royalties do. The rest is a genuine decline.
One bright spot in the same set of numbers: adjusted EBITDA was essentially flat at $52.719 million against $52.615 million a year earlier — the company absorbed almost the entire revenue decline through lower general and administrative expense and commodity deflation. Anyone looking only at that line sees a stable business. Which is precisely why we keep reading.
Uncomfortable truth No. 1: the dividend was already exhausted in 2025
Free cash flow is the most honest number in any annual report. It answers a simple question: how much money is actually left at year end once the business has run and the ovens, trucks and store fittings have been paid for? Anything paid out beyond that comes from the bank balance or from new borrowing.
At Papa John’s the arithmetic looked like this (all figures from the statements of cash flows in the Form 10-K filings for fiscal 2023 and 2025, in millions of dollars):
- 2021: 184.675 operating cash flow − 68.559 capital expenditures = 116.1 free cash flow, dividends 40.356 — plenty of room.
- 2022: 117.808 − 78.391 = 39.4, dividends 54.767 — the dividend exceeds free cash flow by 39 percent.
- 2023: 193.055 − 76.620 = 116.4, dividends 58.451 — comfortable again.
- 2024: 106.632 − 72.484 = 34.1, dividends 60.559 — the dividend is nearly double.
- 2025: 126.000 − 64.695 = 61.3, dividends 61.141 — $164 thousand left over.
Then came the first half of 2026. The company generated $35.828 million of operating cash flow, spent $26.356 million on property and equipment, and reported free cash flow of $9.472 million — down from $36.538 million a year earlier. In the same six months it paid $30.864 million of dividends, more than three times as much. On August 6, 2026 the board acted:
"Leveraging this framework and the Company’s commitment to allocating capital to the highest return opportunities, the Papa John’s Board of Directors voted to suspend the quarterly dividend, beginning with the third quarter 2026 dividend."
— Papa John’s International, Inc., Form 8-K filed August 6, 2026, Exhibit 99.1

An important qualifier: this suspension is not a mistake — it is the belated right call. Anyone who had read the 2024 and 2025 statements of cash flows knew the dividend was already coming out of substance. What is remarkable is not the decision but how long it took. We saw the same pattern in our analysis of Krispy Kreme, where the dividend ended after the first quarter of 2025: a household brand, a franchise model, and a payout the cash register no longer supported.
Uncomfortable truth No. 2: a $442 million equity deficit — and where it came from
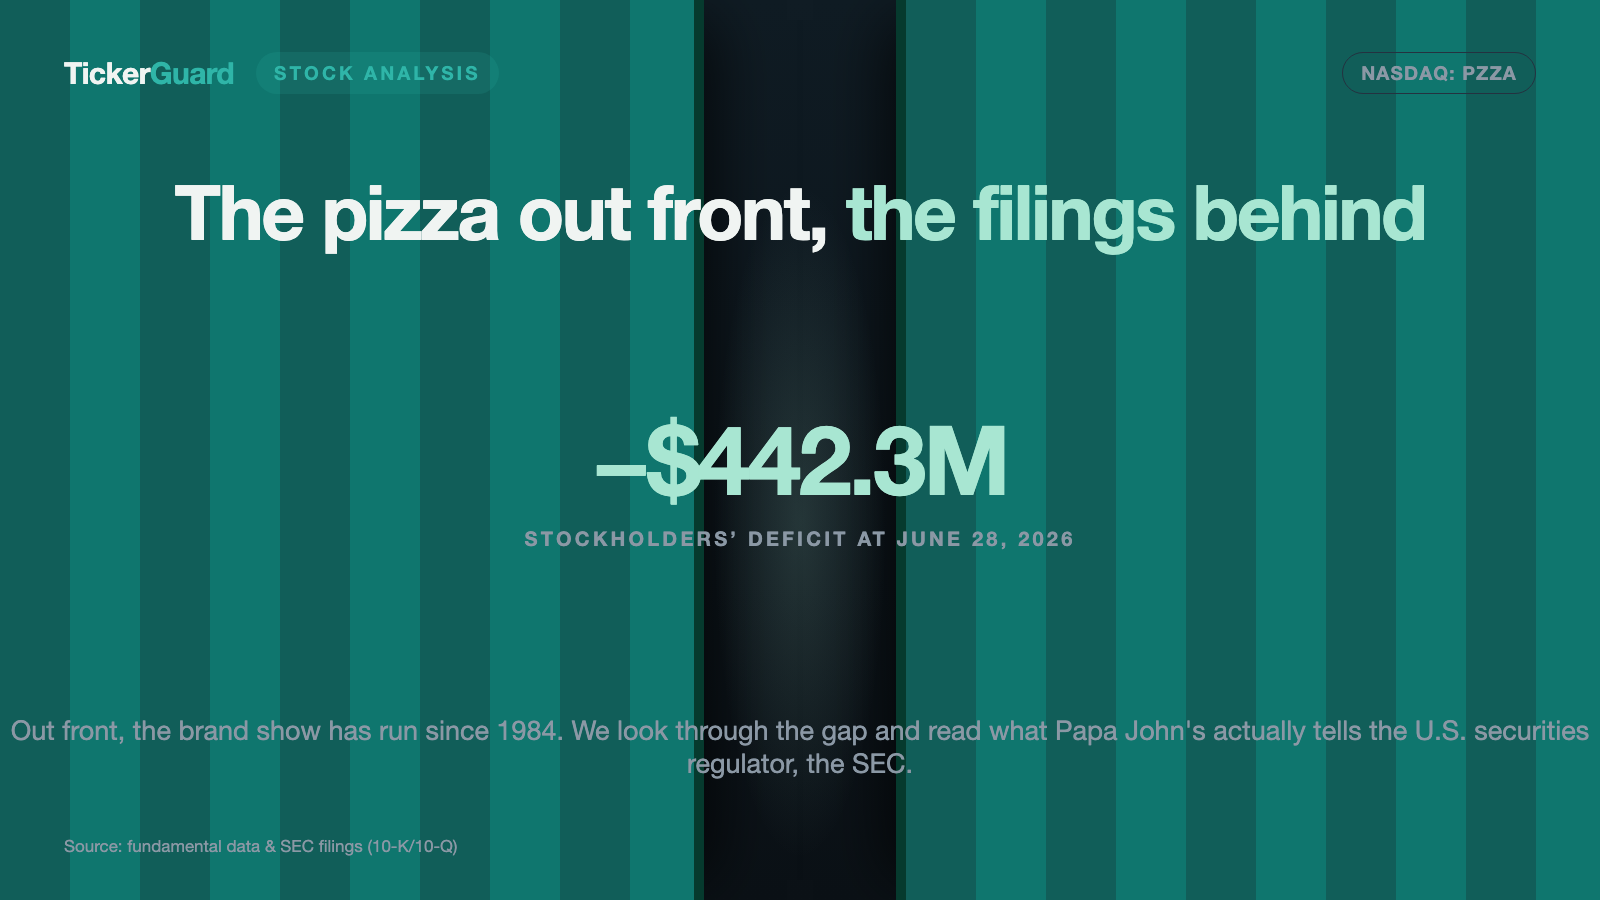
One number in the June 28, 2026 balance sheet should not be skimmed past. Total assets were $805.031 million; total liabilities were $1,246.244 million. The company therefore reports a total stockholders’ deficit of $442.274 million. In plain English: everything the company owns is not, on paper, enough to cover everything it owes.
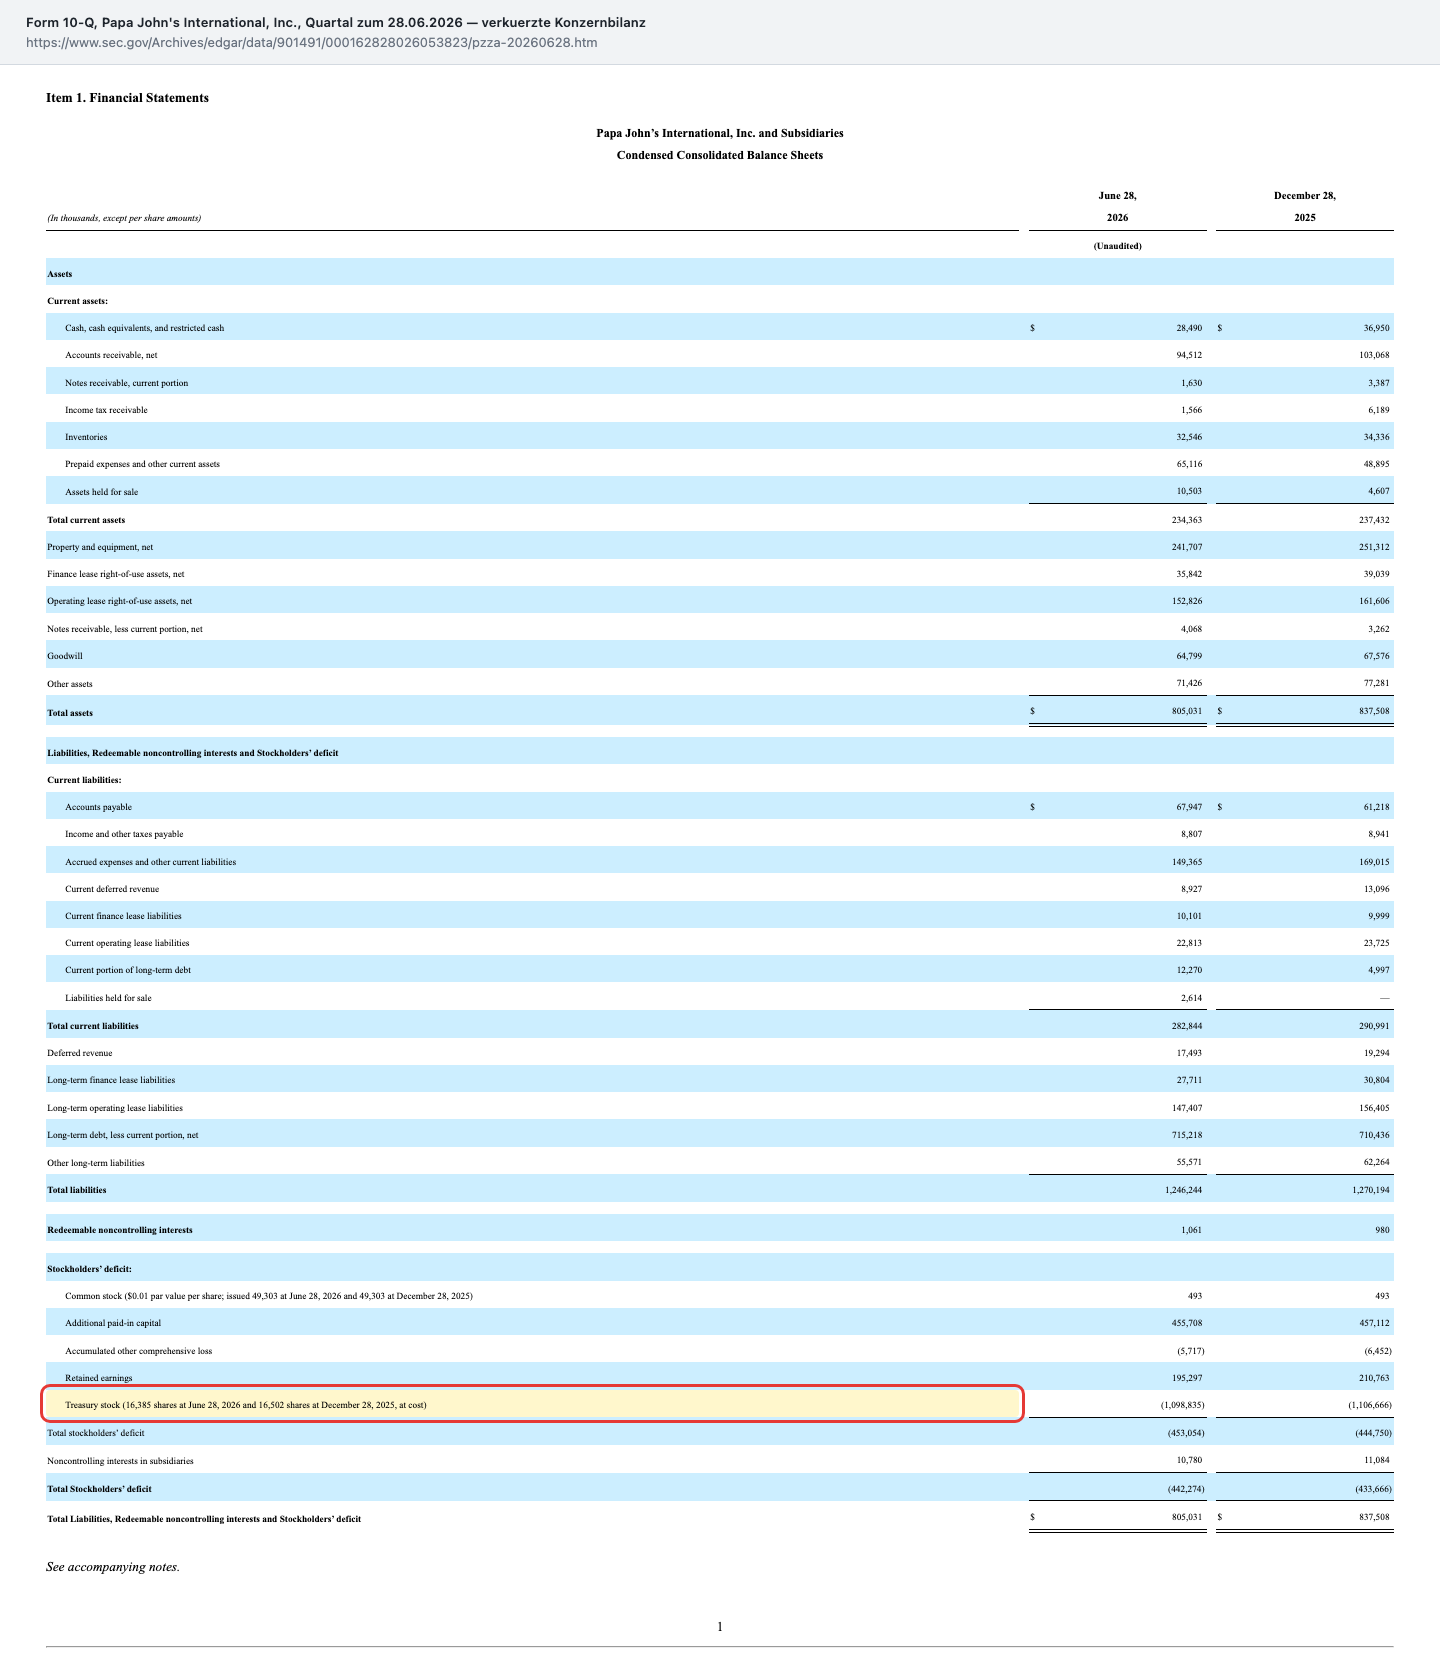
Here is the honest reading, and it matters. This deficit does not come from losses. Retained earnings — the sum of all profits kept in the business since inception — are a positive $195.297 million. Additional paid-in capital stands at $455.708 million. What drags equity below zero is a single line: treasury stock carried at $1,098.835 million of cost.
A picture for it: imagine you spent $1.1 million over twenty years buying back your own company’s shares from co-owners. In accounting terms that money leaves equity — it went to the sellers. Whether it was a good decision depends entirely on what those shares are worth today. And here it gets uncomfortable: Papa John’s total market capitalization was $766.1 million as of August 20, 2026. The buybacks cost more than the whole company is worth on the market today.
How dangerous is that deficit in practice? The balance sheet alone will not say, so here is the cross-check against the numbers that decide it:
- Debt against cash. $727.488 million of borrowings ($715.218 million long-term plus $12.270 million current) against $28.490 million of cash. That is a thin cushion.
- Maturities. The $400.0 million of 3.875 percent senior notes mature on September 15, 2029; the $200.0 million term loan and the $600.0 million revolving facility mature on March 26, 2030. Nothing is due soon.
- Headroom. Roughly $468.7 million of the revolving facility was still available as of June 28, 2026.
- Covenants. The leverage ratio stood at 3.3 against a maximum of 5.25 and the interest coverage ratio at 3.3 against a minimum of 2.00. Both were met at June 28, 2026.
To read that headroom properly, hold it against the new guidance. If adjusted EBITDA lands at $180 to $190 million rather than $200 to $210 million as the company said on August 6, 2026, the distance to the leverage covenant narrows — not to zero, but noticeably. A deficit created by buybacks is not a solvency event. A deficit created by buybacks alongside falling earnings is still a condition nobody should talk away.
Uncomfortable truth No. 3: the restaurant base is shrinking — and management is signaling more closures
For a franchisor the unit count underpins everything: every closed restaurant means permanently less royalty income and less commissary volume. In North America that count is going the wrong way.
In the quarter ended June 28, 2026, 50 restaurants opened system-wide and 92 closed — a net loss of 42 units. On a trailing four-quarter basis North America lost 78 net restaurants while international added 67. The base fell to 5,978 worldwide, of which 3,439 sit in North America.
Part of that is by design. In December 2025 the board approved the first phase of a transformation program and in February 2026 a second phase aimed explicitly at the restaurant portfolio:
"During the six months ended June 28, 2026, the Company closed 101 restaurants across North America as part of the ongoing assessment of our restaurant portfolio, of which eight were Company-owned."
— Papa John’s International, Inc., Form 10-Q for the quarter ended June 28, 2026, Note 9 (Restructuring)

And it does not stop there. The management discussion in the same quarterly report projects further shrinkage over the next two years:
"Potential future actions likely to be approved are expected to include elevated levels of restaurant closures in North America during 2026 and 2027, as we focus on improving the health of our restaurant portfolio by closing underperforming restaurants that lack a path to sustainable financial improvement."
— Papa John’s International, Inc., Form 10-Q for the quarter ended June 28, 2026, management discussion and analysis
The program has a price and a target. Through June 28, 2026 the company had incurred $16.4 million of restructuring costs; for the actions approved so far it expects $24 million to $31 million in total, spread across 2026 and 2027. Corporate headcount was cut by roughly 7 percent. In return the company has identified at least $30 million of general and administrative savings across both years. That is a sensible piece of arithmetic — but one that adapts costs to the revenue decline rather than reversing it.
How deep the core business has fallen shows in a single line from the earnings release: North America comparable sales fell 8.3 percent in the quarter ended June 28, 2026 — down 8.9 percent at company-owned restaurants and down 8.2 percent at franchised ones. A year earlier the same restaurants had posted a gain of 0.9 percent. That is not a stumble; it is a regime change.
Uncomfortable truth No. 4: a misstated number, a CFO exit and an unusual lease structure
Three smaller findings that are unremarkable on their own and, taken together, say something about how this company is run.
First, the misstated number. A footnote in the August 6, 2026 earnings release carries this sentence, and it is easy to miss:
"Comparable sales and system-wide restaurant sales for the six months ended June 28, 2026 have been adjusted to remove $1.0 million of Domestic Company-owned restaurant sales that were erroneously overstated in the first quarter of 2026."
— Papa John’s International, Inc., Form 8-K filed August 6, 2026, Exhibit 99.1, footnote (b)
The fair and complete reading: this concerns an operating metric, not the audited financial statements, and it is $1.0 million against $961.0 million of first-half revenue. The quarterly report filed the same day concludes that disclosure controls and procedures were effective as of the period end. Even so: comparable sales are precisely the number the market uses to judge this company — and it was wrong for a quarter.
Second, the CFO. On June 26, 2026 Ravi Thanawala gave notice of his resignation as Chief Financial Officer and President, North America, effective June 30. The stated reason in the filing: a chief financial officer position at another public company, and expressly not a disagreement with the company. Five weeks later the dividend and the guidance were cut. Christopher K. Collins, until then Senior Vice President of Corporate Finance, stepped in on an interim basis — his second tour of that duty, having already served as interim CFO from March to July 2023. The chief executive seat is young too: Todd A. Penegor has led the company only since August 2024, previously as CEO of Wendy’s. A search for a permanent CFO was still under way at the time of the filing.
Third, the UK lease structure. The company operates just 13 company-owned restaurants there — yet, per the fiscal 2025 annual report, it holds the master leases for nearly all locations and subleases roughly 330 restaurants to franchisees. Head leases generally run 15 years; the franchisee subleases run only five to ten. We documented that find separately in our side-finds feed, because it deserves a watch list of its own.
What the stock costs
All figures below carry the date August 20, 2026 and are deliberately orders of magnitude, not a quote of the day.
Market capitalization stood at roughly $766 million on 32,921,687 shares outstanding (as of July 31, 2026, per the cover page of the quarterly report). Against trailing twelve-month revenue that is a price-to-sales ratio of about 0.4 — a low number for a business with more than $2 billion of revenue, though a fitting one for a business with a 1.5 percent net margin.
The trailing price-to-earnings ratio was about 29 — high, but misleading: it measures against earnings that collapsed to a quarter of their former level in 2025. Enterprise value is more useful — market capitalization plus debt less cash: roughly $1.68 billion. Measured against the company’s own 2026 adjusted EBITDA guidance of $180 to $190 million, that is 8.8 to 9.3 times. The important caveat: that multiple has not come down because the business improved, but because the share price fell further than the earnings expectation did.
A price-to-book ratio cannot meaningfully be computed: book value per share is negative at roughly minus $13.76 because equity itself is negative. Any ratio that divides by that book value is worthless for Papa John’s — including the three-digit figures some data services publish.
The professionals’ view, also as of August 20, 2026: 14 analysts cover the stock — 4 with a strong buy, 1 with a buy, 9 with a hold and none with a sell. The average price target was about $28.67. Read that honestly: the majority is advising patience, not purchase. And one warning to close this chapter. Data services still show a dividend yield of roughly 7 to 8 percent for PZZA. That figure looks backward — it rests on a dividend that no longer exists from the third quarter of 2026.
Upside and risks at a glance
What speaks for the company:
- International is growing. Seven consecutive quarters of positive comparable sales, up 1.5 percent in the quarter ended June 28, 2026, with system-wide sales up 5 percent to $347.2 million. Net 67 new units over four quarters.
- The cost side responds. Adjusted EBITDA held at $52.7 million in the quarter despite an 8.8 percent revenue decline; general and administrative expense fell from $70.1 million to $59.0 million.
- The model funds itself. Operating cash flow was positive in each of the last five fiscal years, covenants were met at June 28, 2026, and debt maturities fall in 2029 and 2030.
- The dividend cut buys room. Roughly $61 million a year now stays in the business — enough to fund the transformation without new borrowing.
- The brand is real. "Better Ingredients. Better Pizza." has been in the market since the mid-1990s, and the company describes itself as the world’s third-largest pizza delivery company.
What speaks against it:
- North America is breaking down. Comparable sales down 8.3 percent in the quarter ended June 28, 2026 and full-year guidance cut to down 6 to 8 percent. North America accounts for roughly 71 percent of global system-wide sales.
- The base is shrinking, with more closures signaled. 101 North America closures in the first half of 2026, net 78 units lost over four quarters, and "elevated levels of restaurant closures" flagged for 2026 and 2027.
- A $442.3 million stockholders’ deficit against $727.5 million of borrowings and $28.5 million of cash (June 28, 2026). The covenant headroom narrows as guidance falls.
- The transformation is unproven. The chief executive concedes it is "taking longer than anticipated"; the $24 million to $31 million of costs land in 2026 and 2027 while the benefit remains an expectation.
- Turnover in the finance seat. The CFO left five weeks before the dividend was suspended; the interim replacement is serving a second stint, and a permanent appointment was outstanding at the filing date.
- Structural opponents. The annual report names delivery aggregators as competitors for sales and margin, alongside a heavily promotional quick-service market and softening consumer sentiment.
A human conclusion
Back to the dividend trap. It worked exceptionally well at Papa John’s, because everything lined up: a brand everybody knows, a business that has run for forty years, and a dividend that was raised year after year. Anyone watching only those three signals saw a solid company. The annual reports had been telling a different story since 2022: a payout that twice exceeded free cash flow and, in 2025, consumed it down to $164 thousand.
That is the real lesson here, and it travels far beyond this stock: a dividend is not proof of money in the till. It is a decision — and decisions can be reversed. The number that tells you in advance whether it will hold sits in the statement of cash flows and is called free cash flow. It is two pages further back in the report and considerably less comfortable to find than a yield figure.
What is left? A company that works abroad and is losing customers in North America. A board taking the right steps — closures, cost cuts, a dividend stop — but taking them late. A balance sheet whose deficit comes from old buybacks rather than losses, yet which leaves the company without reserves at precisely the moment it needs them. And a transformation whose payoff would first become visible in 2027.
Whether that is an opportunity, because the stock trades near a multi-year low, or a trap, because the core business keeps shrinking, comes down to one question: does the decline in North America comparable sales stop before the money to fix it runs out? The answer sits in the next quarterly report, not in an analysis. What you do with it is your decision. And that is exactly as it should be.
If you want to see how similar these patterns look at other household consumer brands, our analysis of Beyond Meat shows the same sequence in a sharper form: a brand everybody knows, revenue falling away, and a balance sheet that does not buy the time to fix it.
Sources
- Form 10-Q for the quarter ended June 28, 2026, Papa John’s International, Inc., filed August 6, 2026 (SEC EDGAR, CIK 0000901491)
- Form 8-K filed August 6, 2026, Exhibit 99.1 — second quarter 2026 results, dividend suspension and revised 2026 outlook
- Form 8-K filed June 30, 2026, Item 5.02 — resignation of CFO Ravi Thanawala, interim appointment of Christopher K. Collins
- Form 10-Q for the quarter ended March 29, 2026, filed May 7, 2026
- Form 10-K for fiscal 2025, filed February 26, 2026 — segment disclosures, leases (Note 3), risk factors
- Form 10-K for fiscal 2024, filed February 27, 2025
- Form 10-K for fiscal 2023, filed February 29, 2024 — the 2021 and 2022 series
- Source: fundamental data & SEC filings (annual and quarterly reports, 10-K/10-Q) — market capitalization, valuation multiples, analyst coverage and headcount as of August 20, 2026
Disclaimer: This article is journalistic analysis of publicly available company filings and market data. It is not investment advice, not a recommendation to buy or sell, and not a solicitation to buy or sell securities. Stocks can lose value at any time; a total loss of invested capital is possible. All figures come from the original documents linked above and carry the dates stated; no warranty is given for completeness or accuracy. Positions held by the operator are disclosed daily; where one exists, it appears as a notice at the top of this deep dive.
Key figures at a glance
All monetary figures in millions of $; earnings per share as reported.
| Metric | 2021 | 2022 | 2023 | 2024 | 2025 |
|---|---|---|---|---|---|
| Revenue | 2,068.4 | 2,102.1 | 2,135.7 | 2,059.4 | 2,053.8 |
| Operating Income (EBIT) | 168.2 | 109.0 | 147.1 | 156.7 | 89.1 |
| Net Income | 120.0 | 67.8 | 82.1 | 83.5 | 30.5 |
| Net Margin | 5.8% | 3.2% | 3.8% | 4.1% | 1.5% |
| Earnings Per Share | 3.40 $ | 1.90 $ | 2.48 $ | 2.54 $ | 0.93 $ |
Source: fundamental data & SEC filings (annual and quarterly reports, 10-K/10-Q)
Our Bottom Line at a Glance
- North America core business negative
- Comparable sales down 8.3 percent in the quarter ended June 28, 2026, after a 0.9 percent gain a year earlier. Full-year guidance was cut on August 6, 2026 from down 2 to 4 percent to down 6 to 8 percent. North America accounts for roughly 71 percent of global system-wide sales.
- International business positive
- Seventh consecutive quarter of positive comparable sales (up 1.5 percent in the quarter ended June 28, 2026), system-wide sales up 5 percent to $347.2 million, net 67 additional units over four quarters. Too small to offset North America, but the only growing part.
- Capital returns negative
- The dividend exceeded free cash flow in 2022 and 2024 and consumed nearly all of it in 2025 at $61.141 million against $61.305 million. It was suspended on August 6, 2026 from the third quarter of 2026 — the right call, but a late one.
- Balance sheet and leverage negative
- A $442.274 million stockholders' deficit and $727.5 million of borrowings against $28.5 million of cash at June 28, 2026. The deficit stems from buybacks (treasury stock at $1,098.835 million of cost), not from losses, and credit agreement covenants were met (leverage ratio 3.3 against a 5.25 maximum).
- Cost discipline and transformation neutral
- Adjusted EBITDA held at $52.7 million in the quarter ended June 28, 2026 despite an 8.8 percent revenue decline, with general and administrative expense down from $70.1 million to $59.0 million. Against that sit $24 million to $31 million of restructuring costs for 2026 and 2027, and a chief executive who called the transformation "taking longer than anticipated" on August 6, 2026.
- Leadership and reporting quality negative
- The chief financial officer resigned on June 26, 2026, five weeks before the dividend suspension and guidance cut; the interim successor is serving that role for the second time. The August 6, 2026 release also corrects $1.0 million of restaurant sales that had been overstated in the first quarter of 2026.
Papa John's is a profitable licensing and logistics business with a household brand whose North America core has been losing ground at a double-digit rate for a year. The dividend was no longer covered by free cash flow in 2025 and was suspended on August 6, 2026, the same day earnings guidance fell by $20 million. The balance sheet carries a $442.3 million stockholders' deficit from old buybacks, set against $727.5 million of borrowings and $28.5 million of cash. The transformation is under way; its effect would first be measurable in 2027. Not investment advice.
What Our Rating Means
Substance risk
We found at least one documented issue that threatens the company itself — regardless of how the stock is currently valued.
We rate business quality red, and it is the balance sheet that drives it, not the share price. At June 28, 2026 the books carry a stockholders' deficit of $442.3 million against $727.5 million of borrowings and only $28.5 million of cash. Fairness requires naming how that deficit arose: not through losses — retained earnings are a positive $195.3 million — but through share repurchases carried at $1,098.8 million of cost. That distinction is real and it speaks for the company. It does not change the situation. A business with no equity cushion needs a dependable earnings stream, and that stream is eroding: net income fell from $120.0 million in 2021 to $30.5 million in 2025, North America comparable sales fell 8.3 percent in the quarter ended June 28, 2026, and on August 6, 2026 the company cut its own earnings guidance by $20 million and suspended the dividend. Credit agreement covenants were met at the balance sheet date and maturities do not fall due until 2029 and 2030, so there is no acute distress. There is, however, a company without reserves at exactly the moment it must pay for a multi-year transformation. This rating says nothing about the price of the stock: it trades near a multi-year low and can rise from there. The decision is yours.
A journalistic assessment by our editorial team at the time of the deep dive, based on public sources — not investment advice and not a solicitation to buy or sell. Your personal circumstances (investment goals, risk capacity, taxes) cannot be taken into account. What our levels mean, how verdicts are formed, and what conflicts of interest exist →
Worth Noting
- The trigger was the SEC current report on Form 8-K filed August 6, 2026 (Item 2.02) with the dividend suspension and reduced outlook, not a hit in our in-house stock scanner.
- Data basis: Form 10-Q for the quarter ended June 28, 2026 (filed August 6, 2026) fully reviewed, all SEC submissions through August 14, 2026 checked; fundamental data and prices as of August 20, 2026.
- Important when comparing data sources: some services still show a dividend yield of roughly 7 to 8 percent for PZZA. It reflects the dividend paid through the second quarter of 2026 and is void from the third quarter of 2026 onward.
- A price-to-book ratio is not meaningful for Papa John's: book value per share is negative because of the stockholders' deficit (roughly minus $13.76 as of August 20, 2026).
- Fiscal 2023 comprised 53 weeks rather than 52; revenue comparisons with that year are therefore not directly comparable.
Stock Watch
This analysis is as of August 26, 2026. Stock Watch will tell you what's changed at PZZA since then.
Later $1 a month per stock — signing up is free, and you'll be the first to know when it launches.
The full analysis as a PDF for later
We will send you this analysis as a PDF — to print, file away, and read at your own pace. And we will add you to the free Stock Watch list for Papa John's International Inc (PZZA), so you hear about it when something material in this analysis changes.
Frequently Asked Questions
On August 6, 2026 the board suspended the quarterly dividend beginning with the third quarter of 2026 in order to accelerate investment in its transformation. The economics sit in the statement of cash flows: in fiscal 2025 the company paid $61.141 million of dividends against free cash flow of $61.305 million. In the first half of 2026 it paid $30.864 million against just $9.472 million of free cash flow.
The $442.274 million stockholders' deficit at June 28, 2026 does not come from losses. Retained earnings are a positive $195.297 million. What pushes equity below zero is a single balance sheet line: treasury stock carried at $1,098.835 million of cost. Share repurchases reduce equity in accounting terms because the cash went to the selling shareholders.
Through four segments. In the quarter ended June 28, 2026, segment revenue was $138.9 million from company-owned restaurants, $33.3 million from North America franchising, $255.8 million from supplying restaurants through eleven distribution centers, and $45.0 million from international. Franchising is by far the most profitable: roughly 71 cents of every segment revenue dollar remained as segment adjusted EBITDA.
In the quarter ended June 28, 2026 North America comparable sales fell 8.3 percent — down 8.9 percent at company-owned restaurants and down 8.2 percent at franchised ones. A year earlier the same restaurants had posted a 0.9 percent gain. For full-year 2026 the company has guided to down 6 to 8 percent since August 6, 2026, against down 2 to 4 percent previously.
As of June 28, 2026 there were 5,978 restaurants in 51 countries and territories — 3,439 in North America and 2,539 international. Only 469 are company-owned. In the second quarter of 2026, 50 units opened and 92 closed. On a trailing four-quarter basis North America lost 78 net restaurants while international added 67.
At June 28, 2026 borrowings totaled $727.5 million against $28.5 million of cash. That includes $400.0 million of 3.875 percent senior notes maturing September 15, 2029 and a $200.0 million term loan maturing March 26, 2030. Roughly $468.7 million of the $600.0 million revolving facility remained available, and the leverage ratio stood at 3.3 against a covenant maximum of 5.25.
Papa John's fiscal year ends on the last Sunday in December. Because a calendar year does not divide evenly into 52 weeks, the year end drifts — and roughly every five or six years a fiscal year runs one week longer. That happened in 2023. The $2,135.7 million of revenue reported for that year therefore contains one more week of trading than the comparison years.
A restructuring program whose first phase the board approved in December 2025 and whose second phase it approved in February 2026. It covers restaurant closures, a roughly 7 percent reduction in corporate headcount, and at least $30 million of general and administrative savings across 2026 and 2027. The company puts total restructuring costs at $24 million to $31 million, of which $16.4 million had been incurred through June 28, 2026.
Found an error?
Did you spot a factual error, an outdated number, or a typo in this deep dive? Let us know briefly — your report goes straight to the editorial team.