10,000 Euros Would Have Become 12,009: A Stock Newsletter Recalculated After Eight Months
Would you have made money with "HOT STOCKS EUROPE" issue No. 24, dated November 28, 2025? We ran the numbers: 10,000 euros, spread equally across the nine featured stocks, would have grown to 12,009 euros by July 24, 2026 – up 20.1 percent against 11.8 percent for the STOXX Europe 600. The calculation is a what-if, and the honest part belongs with it: without the single outlier SUSS MicroTec it would have been just 6.1 percent, and of eight price targets quoted, exactly one was reached. Not investment advice, just a reckoning in euros.
 Thomas Mücke
Founder & Publisher
Thomas Mücke
Founder & Publisher
The question is simple, and for you as an investor it is the only one that counts: would you have made money with this stock newsletter? Not "was the analysis clever," not "did the author cite properly" — but: would there have been more in your account eight months later?
We have issue No. 24 of "HOT STOCKS EUROPE," dated November 28, 2025, in front of us: eight pages, nine stocks presented in detail, a model portfolio with six positions, plus a year-end review of eight celebrated winners. We wrote a separate deep dive on 22 of these names and checked every company figure in them against annual and quarterly reports. Now we are tallying up that issue — in euros.
The answer in one number: anyone who had spread 10,000 euros equally across the nine featured stocks on publication day and held them until July 24, 2026 would have ended up with 12,009 euros. That is a gain of 2,009 euros in just under eight months, or 20.1 percent. Including dividends it was 12,110 euros.
That is the good news. The honest one follows immediately: take a single stock out of that calculation — SUSS MicroTec, up 131.7 percent — and 20.1 percent turns into 6.1 percent. 10,000 euros would then have become 10,614 euros, which is less than a plain index investment: on the same basis — pure price return — the STOXX Europe 600 came to 11,180 euros. So the model calculation does produce a gain, and that gain comes almost entirely from one single hit.
How we calculated it, which stock contributed what, whether the price targets were reached, what the stop-loss levels in the model portfolio were really worth — and what these numbers explicitly do not show. All of it, in that order.
The Answer in One Number
Before that number means anything, it has to be clear how it was arrived at. We calculated a what-if, not a replayed model portfolio. Nowhere did the newsletter call on readers to buy all nine featured stocks equally weighted on publication day — that is our assumption, made so that anything can be compared at all. The rules:
- Purchase date: closing price on publication day, Friday, November 28, 2025. Nobody who read the newsletter could have bought earlier.
- Sale date: closing price on July 24, 2026, the last trading day on which all the stocks could be valued together.
- Equal-weighted: roughly 1,111 euros in each of the nine names, fractional shares assumed, no topping up, no selling in between.
- Everything in euros, converted at the exchange rate prevailing on each reference date. Currency gains and losses are therefore included — exactly the way a euro-based investor experiences them in the portfolio.
- Excluding fees and excluding taxes. Both would push the result down further.
A footnote on fairness: the prices printed in the issue are as of the editorial deadline one to two days before publication and are in some cases below the closing price on publication day. For SUSS MicroTec the newsletter quotes 32.90 euros, while the closing price on November 28 was 34.16 euros; for R&S Group the issue shows 17.40 euros against a closing price of 18.90 euros. We use the price a reader would actually have had to pay — the variant that is less favorable to the newsletter, but the more honest one.
And this is what the result looks like in comparison:
| Investment from Nov 28, 2025 to Jul 24, 2026 | 10,000 euros became | Return |
|---|---|---|
| The 9 stocks of the newsletter, equal-weighted (incl. dividends) | 12,110 euros | +21.1 % |
| The 9 stocks of the newsletter, equal-weighted (price only) | 12,009 euros | +20.1 % |
| STOXX 600 ETF (incl. distributions) | 11,410 euros | +14.1 % |
| MSCI World ETF (accumulating, income reinvested) | 11,240 euros | +12.4 % |
| STOXX Europe 600 (price index, excluding distributions) | 11,180 euros | +11.8 % |
| DAX (performance index, dividends included) | 10,530 euros | +5.3 % |
Comparing like with like — pure price return against a pure price index — the nine stocks, at 12,009 euros, are 829 euros ahead of the STOXX Europe 600. Counting distributions on both sides, 12,110 euros compare with 11,410 euros for the ETF: a lead of 700 euros. Against the DAX, which managed only 5.3 percent over these eight months, the gap was considerably wider.
That leaves the one item almost no stock-newsletter scorecard includes: the newsletter itself. According to its masthead, "HOT STOCKS EUROPE" costs 29.50 euros a month including German VAT and postage. Eight months therefore cost 236 euros. On a 10,000-euro stake that equals 2.4 percentage points of return that first have to be earned: a gain of 2,009 euros turns into 1,773 euros. The lead over the ETF shrinks from 700 to roughly 464 euros. Anyone who had invested only 5,000 euros would already have paid almost five percentage points for the subscription — the subscription fee is a fixed amount, the return is not. In fairness it should be noted: those 236 euros buy eight issues, and we measured only one. Anyone who had bought this single issue would have paid 29.50 euros, leaving 1,980 euros of the 2,009. On the other side of the comparison, the ongoing cost of an ETF is not deducted either.
Stock by Stock
Nine stocks were presented in issue 24, each with its own text, its own chart and its own reasoning. Here they are with the price you would have paid on publication day and the price on July 24, 2026 — both in euros, foreign currencies converted at that day's exchange rate.
| Stock | Price Nov 28, 2025 | Price Jul 24, 2026 | Return in euros | Our analysis |
|---|---|---|---|---|
| SUSS MicroTec | 34.16 euros | 79.15 euros | +131.7 % | SUSS MicroTec analysis |
| ACG Metals | 12.44 euros | 22.62 euros | +81.8 % | ACG Metals analysis |
| Nokia | 5.24 euros | 8.22 euros | +56.8 % | Nokia analysis |
| DPM Metals | 24.07 euros | 32.73 euros | +36.0 % | DPM Metals analysis |
| R&S Group | 18.90 euros | 21.78 euros | +15.2 % | R&S Group analysis |
| PFISTERER | 73.70 euros | 80.00 euros | +8.5 % | PFISTERER analysis |
| Thor Explorations | 0.742 euros | 0.691 euros | −6.8 % | Thor Explorations analysis |
| Fermi | 14.22 euros | 6.51 euros | −54.2 % | Fermi analysis |
| The Platform Group | 6.64 euros | 0.782 euros | −88.2 % | Platform Group analysis |
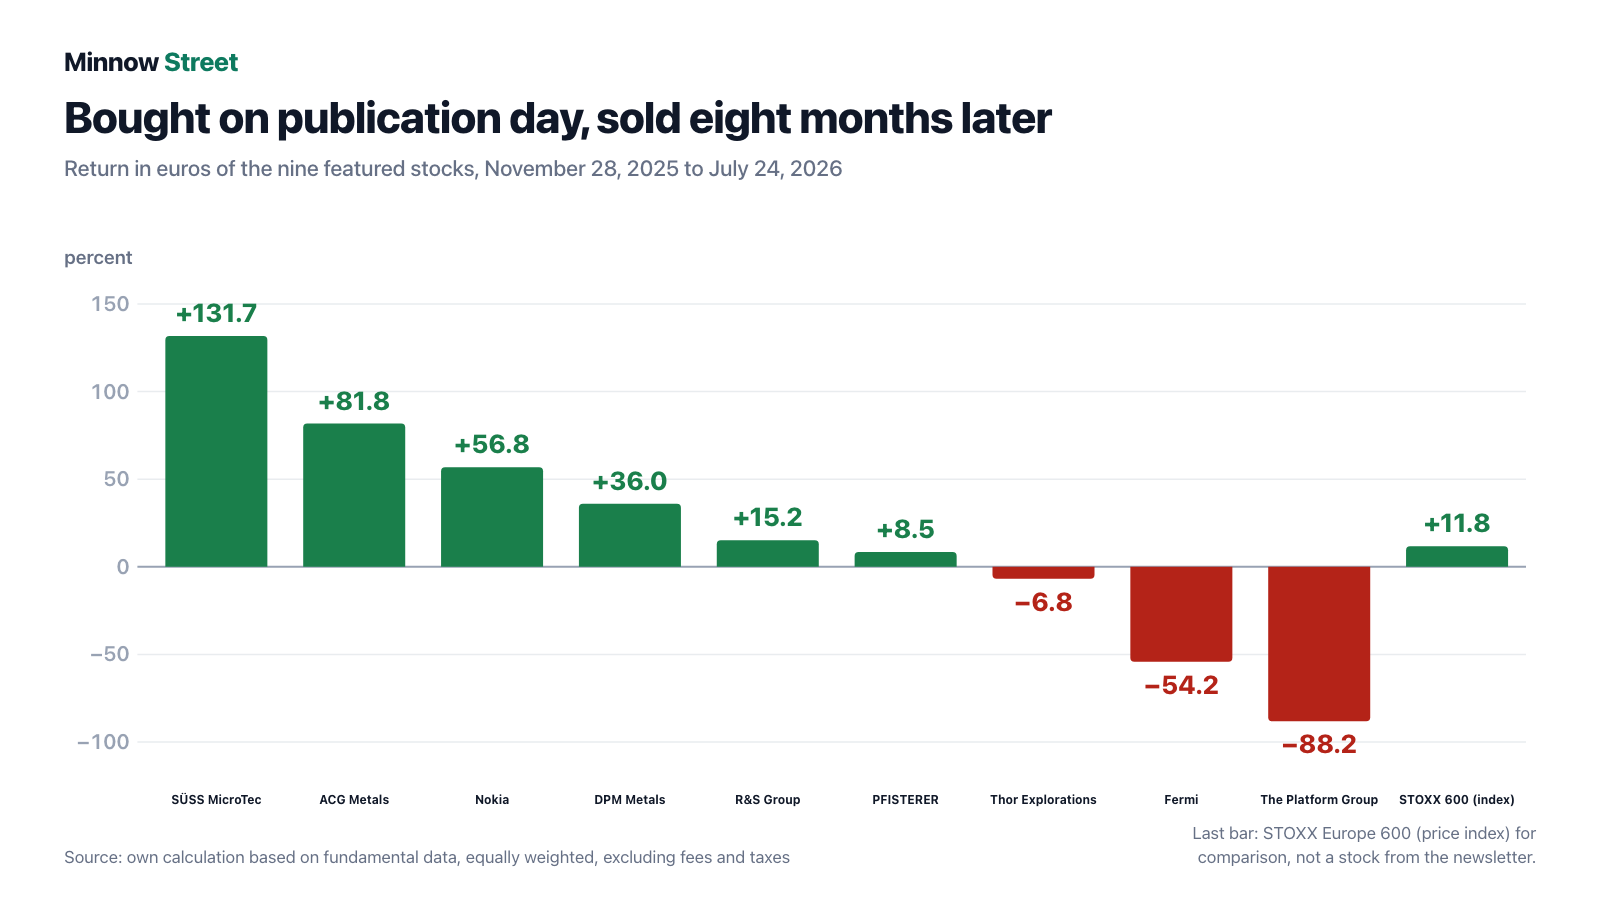
Six of the nine stocks were up on July 24, 2026, with the middle stock (median) at plus 15.2 percent. The spread is the genuinely remarkable part: from plus 131.7 percent to minus 88.2 percent. Anyone who had bought only three or four of the names instead of all nine — which is what happens in practice — would have almost doubled or almost halved their money depending on the selection. The 20.1 percent is the result of the complete list, not the result of a reader picking two favorites.
For five of the nine names, the euro result also reflects the exchange rate: R&S Group trades in Swiss francs, Fermi in U.S. dollars, DPM Metals in Canadian dollars, Thor Explorations and ACG Metals in British pence. For Thor Explorations that is the difference between minus 9.2 percent in pence and minus 6.8 percent in euros; for ACG Metals between plus 77.1 and plus 81.8 percent — so the weaker euro added to the gain here.
Alongside that, page 1 of the newsletter celebrated eight stocks as the top performers of the past trading year. These were not buy recommendations, but a look back at price gains that had already happened — for Steyr Motors the newsletter even points to a sell recommendation it had already issued. Even so, it is interesting to see how these eight fared from publication day onwards:
| Stock (page 1 review) | Return in euros since Nov 28, 2025 | Our analysis |
|---|---|---|
| Nebius | +102.0 % | Nebius analysis |
| Trekor Metals (Taseko Mines until June 2026) | +36.1 % | Trekor Metals analysis |
| Steyr Motors | +20.2 % | Steyr Motors analysis |
| Hensoldt | +16.8 % | Hensoldt analysis |
| Endeavour Mining | +6.1 % | Endeavour Mining analysis |
| Zegona Communications | +5.5 % (incl. distribution +19.4 %) | Zegona analysis |
| RENK | −10.3 % | RENK analysis |
| Strickland Metals | −57.1 % | Strickland Metals analysis |
Equal-weighted, these eight add up to plus 14.9 percent, and six of eight were up. What is remarkable about that is above all how little the celebrated past said about the following eight months: the name with the most spectacular review, Steyr Motors with plus 1,256 percent in the newsletter text, delivered 20.2 percent afterwards — solid, but a long way from the number that shone in the review. And Strickland Metals, mentioned in the newsletter with a price gain of around 200 percent, lost 57.1 percent afterwards.
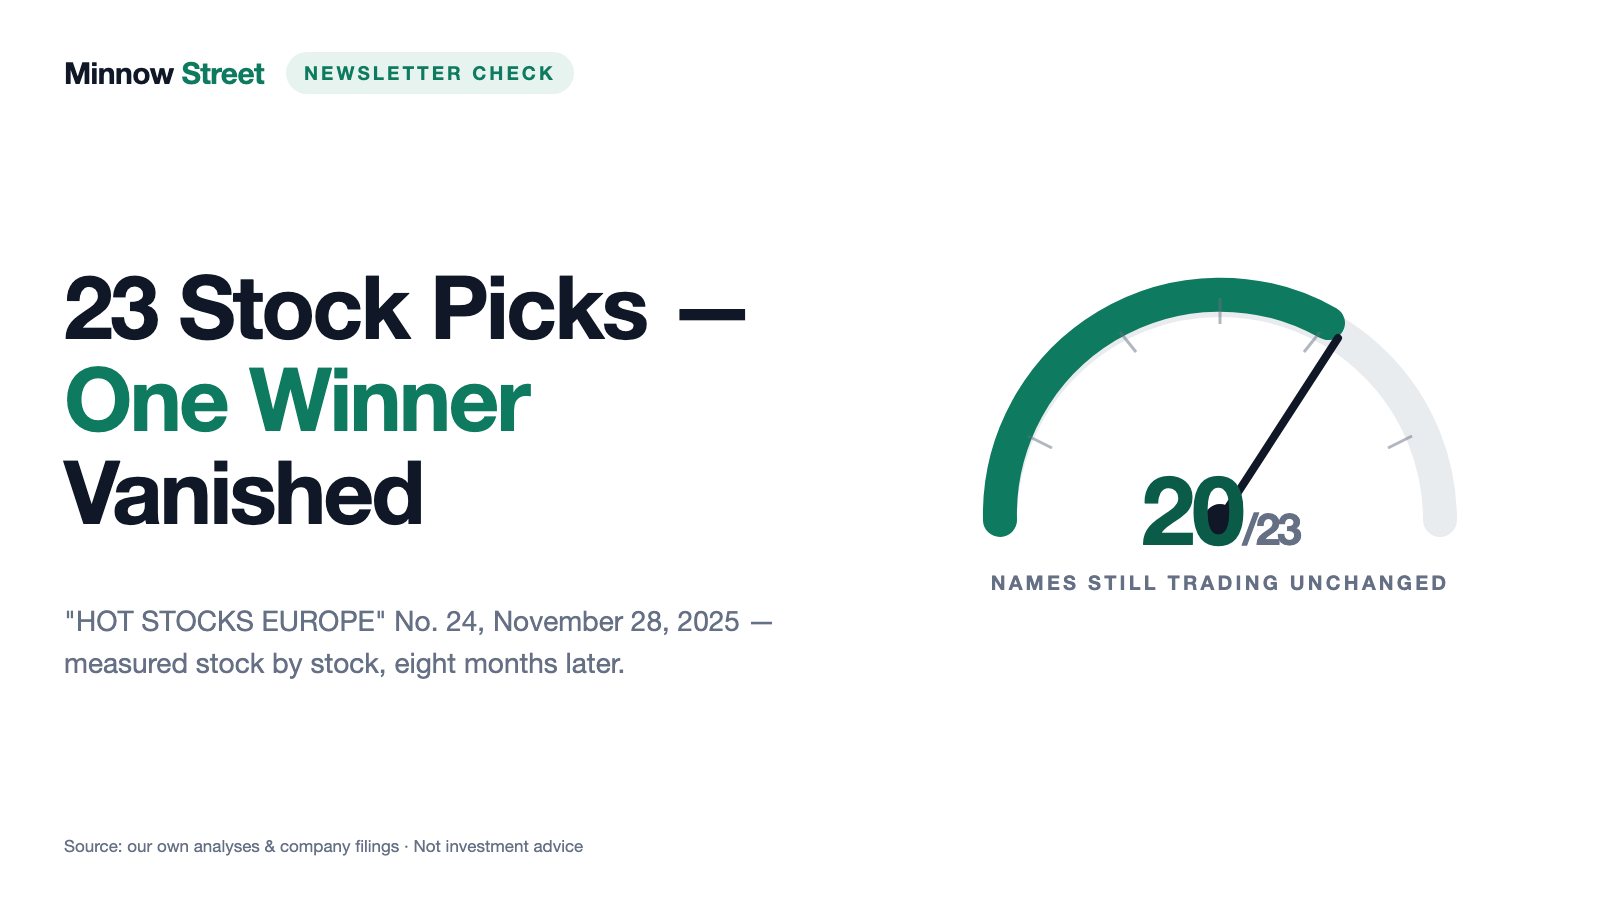
Adding up all 23 names of the issue — the nine featured, the eight from the review and the six portfolio positions, the latter likewise measured from November 28, 2025 and, for the turbo certificate, represented by the underlying ASML share — produces plus 14.9 percent equal-weighted; 14 of 23 were up on July 24, 2026. That this figure matches the review figure to the decimal is coincidence: it rests on a different population. Without the substitute calculation for the certificate, 22 names remain, and the figure is plus 12.3 percent — the ASML share is the only stock in this line that the newsletter did not name as such.
Were the Price Targets Reached?
Price targets appear prominently in stock newsletters, but are rarely held up against the actual price history afterwards. That is exactly what we do here for this one issue: for eight stocks, issue 24 gives a specific analyst target that can be measured against the price on July 24, 2026. Result: one out of eight targets was reached.
A note on fairness belongs in front of that: the issue names no time horizon for any of these targets, and analyst targets usually run for twelve months. Our measurement after just under eight months is therefore a snapshot as of the reference date, not a final score — a target not reached by then may later have been reached, withdrawn or adjusted.
| Stock | Research house | Price target in the newsletter | Price Jul 24, 2026 | Result |
|---|---|---|---|---|
| SUSS MicroTec | MWB Research | 56.00 euros | 79.15 euros | reached, beaten by 41.3 % |
| PFISTERER | GBC Research | 85.00 euros | 80.00 euros | missed by 5.9 % |
| Thor Explorations | Canaccord | 89 pence | 59 pence | missed by 33.7 % |
| Pharming Group | Jefferies | 1.70 euros | 1.102 euros | missed by 35.2 % |
| SolGold | Canaccord | 46 pence | 28 pence (cash consideration) | missed by 39.1 % |
| R&S Group | Berenberg | CHF 35.00 | CHF 20.26 | missed by 42.1 % |
| Fermi | Berenberg | USD 37.00 | USD 7.40 | missed by 80.0 % |
| The Platform Group | MWB Research | 19.50 euros | 0.782 euros | missed by 96.0 % |
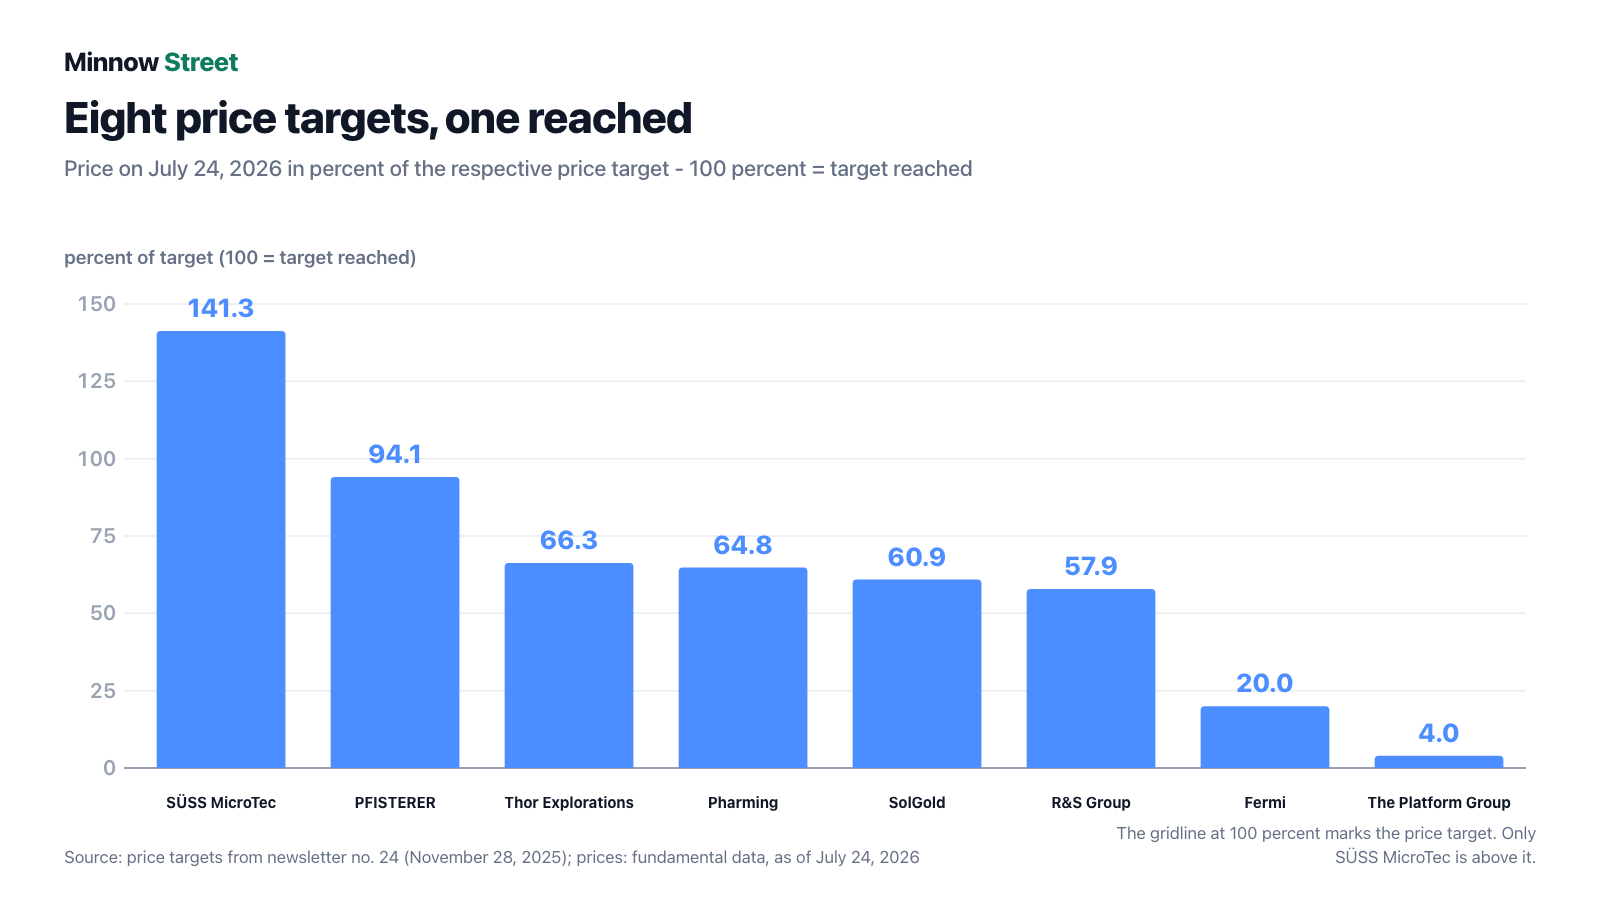
Two stocks even appeared in the issue with several targets. For The Platform Group, alongside the 19.50 euros from MWB Research, the newsletter named 20 euros (First Berlin) and a target of 21 (NuWays, with no currency stated in the issue); in the table we used the lowest of the three — the other two would have been missed by even more. For Pharming Group, alongside the Jefferies target of 1.70 euros there were two unquantified expectations: according to the newsletter, H.C. Wainwright expected the share price to double and Oppenheimer expected almost a tripling — the stock stood at 1.102 euros on July 24, 2026, 23.5 percent below the price on publication day. And for ACG Metals the newsletter named no analyst target, but quoted CEO Artem Volynets as seeing "probably still 200 to 300 percent upside potential"; by the reference date that had turned into plus 81.8 percent.
And now the point that gets interesting for anyone who takes price targets seriously: the hit rate of the price targets and the return have little to do with each other.
The best example is ACG Metals. As of November 28, 2025, the newsletter quoted an earnings estimate from Canaccord for the 2025 financial year: earnings per share of 0.48 U.S. dollars. The audited accounts for the same financial year (fiscal year ended December 31, 2025, audit opinion dated April 13, 2026) instead show a loss of 2.04 U.S. dollars per share — the estimate was not slightly off, it was on the wrong side of zero. We do not know whether the house adjusted its estimate later. Even so, ACG Metals is the second-best of the nine featured names at plus 81.8 percent. Anyone who had followed the forecast would have done well; anyone who had checked the forecast would probably have got out. All the details are in our ACG Metals analysis.
The PFISTERER case runs the other way. Here everything the newsletter wrote about the business was correct — growing revenue, a record order book, a research house that, according to the newsletter, raised its target from 48 to 85 euros. The business did indeed keep running, and the stock gained. Only by 8.5 percent instead of the roughly 15 percent it would have taken to reach the price target. A target missed by 5.9 percent at a company where nothing went wrong operationally — that is the ordinary outcome price targets rarely capture. You can read the details in our PFISTERER analysis.
The biggest loss in the issue was The Platform Group: from 6.64 euros to 78 cents, while three houses named targets of 19.50 euros, 20 euros and 21 (NuWays, with no currency stated in the issue). The collapse coincided with press reports: the German business magazine manager magazin wrote on June 12, 2026 about bank loans terminated for cause and a tax claim; according to multiple, matching press reports, the Chemnitz public prosecutor's office has since been reviewing a criminal complaint on suspicion of document forgery — reviewing a complaint is neither a formal investigation nor an indictment. The company rejects the account through its lawyers as "distorted and false assertions"; there is no court decision on the matter. The presumption of innocence applies. None of this could have been known to anyone in November 2025, neither to the newsletter nor to the analysts it quoted. That does not undo the effect the price targets had, but it explains them: a price target is an opinion with a date, not a promise. Details in our Platform Group analysis.
The Model Portfolio: What the Stop-Losses Achieved
The model portfolio of the newsletter is the most verifiable part of the issue, because it names real purchase dates, real purchase prices and fixed stop-loss levels. It was opened on December 13, 2024 with 100,000 euros. For the money check we recalculated every position from its actual purchase date and compared two variants: once the way the newsletter prescribes it (sell as soon as the stop-loss level is breached), and once without a stop — simply held through to July 24, 2026.
| Position | Purchase date | Purchase price | Stop | What happened | Without stop | With stop |
|---|---|---|---|---|---|---|
| SolGold | Sep 5, 2025 | 0.175 euros | 0.14 euros | cash consideration 28 pence = 0.322 euros on Mar 4, 2026 | +84.0 % | +84.0 % |
| Pharming Group | Jun 20, 2025 | 0.91 euros | 1.30 euros | stop triggered on Feb 12, 2026; price on Jul 24, 2026: 1.102 euros | +21.1 % | +42.9 % |
| Tharisa | Jul 18, 2025 | 1.06 euros | 1.06 euros | already stopped out according to the newsletter; price on Jul 24, 2026: 1.324 euros | +24.9 % | ±0 % |
| Serabi Gold | Oct 31, 2025 | 2.72 euros | 2.00 euros | stop held; price on Jul 24, 2026: 3.070 euros | +12.9 % | +12.9 % |
| Serviceware | Oct 31, 2025 | 18.50 euros | 15.50 euros | stop triggered on Feb 6, 2026; price on Jul 24, 2026: 14.55 euros | −21.4 % | −16.2 % |
In money: the five positions tied up 112,900 euros at their purchase prices — more than the starting capital of 100,000 euros with which the portfolio was opened in December 2024. With the stop-loss levels of the newsletter they were worth 139,720 euros in the end, which is plus 23.8 percent. Without stops it would have been 140,090 euros (plus 24.1 percent). On balance the stops therefore cost 370 euros or 0.3 percentage points — practically the same result, but arrived at in completely different ways.
Position by position the stops worked, and they worked where it mattered. With Pharming Group the stock ran strongly after the purchase, then turned and breached the trailing stop on February 12, 2026: 42.9 percent secured instead of the 21.1 percent that would be left today. For Serviceware the stop capped the loss at 16.2 instead of 21.4 percent. That is no magic trick, simply what stops are there for.
They also cost money, though. Tharisa is the counter-example: the position was stopped out at the stop-loss level of 1.06 euros, which was exactly the purchase price, and therefore left the portfolio with a zero result — the newsletter itself lists it in its own table at 0.0 percent with a position value of zero. On July 24, 2026 the stock traded at 1.324 euros; anyone who had held the position would be at plus 24.9 percent. More on that in our Tharisa analysis.
The largest gain came from SolGold, and it came by an unusual route: the stock was not sold; the company was taken over. On March 4, 2026 the cash consideration of 28 pence per share became effective — 0.322 euros converted, against a purchase price of 0.175 euros, which is plus 84.0 percent. That is worth stressing, because a delisting sounds like a total loss: here it was a payout. Anyone who had only entered on the publication day of the newsletter, however, would have bought at 0.3373 euros and lost 4.6 percent on the payout — the same position, two completely different results, only because the entry points were three months apart.
And one more number that shows how much depended on the exit decision with these stocks. The interim highs, meaning the points at which a sale would have paid off most: SolGold plus 113.6 percent (December 5, 2025), Pharming plus 99.8 percent (January 28, 2026), Tharisa plus 61.1 percent (January 29, 2026), Serabi Gold plus 58.7 percent (January 26, 2026). Only Serviceware never got further than plus 3.8 percent (January 27, 2026). In all five cases the best moment to sell was therefore in December or January — well before our reference date.
One position we have to disclose instead of counting it: the sixth portfolio holding was a turbo certificate on ASML, bought on September 19, 2025 at 2.80 euros and carried in the newsletter at 3.90 euros (plus 39.3 percent). A leveraged product cannot be tracked in any price database — it has a knock-out barrier, an issuer and its own price history that is not publicly archived. We therefore do not include it in the portfolio scorecard above. For context: the ASML share itself rose from 903.40 to 1,563.00 euros between November 28, 2025 and July 24, 2026, which is 73.0 percent (more on that in our ASML analysis). Only in the overall tally across all 23 names above do we use this share as a substitute — it is disclosed there, and the figure without it is stated there as well.
What the Numbers Do Not Show
Every return calculation is also a decision about what gets measured. So that you can put our numbers in context, here are the points where they are weak:
- The reference date is chosen. July 24, 2026 is no magic date; it is the last common trading day before our editorial deadline. A month earlier or later would have produced different numbers — with SUSS MicroTec, which more than doubled, in some cases drastically different ones.
- Eight months is short. Stocks such as Fermi or ACG Metals are bets on projects that take years. What happens in eight months says little about how those stories end — in either direction.
- Equal-weighted is an assumption, not a fact. No reader buys all nine names in equal parts. Every real selection deviates from it, and the difference between the best and the worst name is 220 percentage points.
- One name dominates. Without SUSS MicroTec the result falls from 20.1 to 6.1 percent. A scorecard that hangs on a single position is statistically an anecdote and no proof of method.
- No taxes, no fees. Nine buy orders, custody costs, FX conversion fees, and finally the German flat-rate withholding tax on the gain — none of it accounted for. Real net returns are lower — on both sides of the comparison.
- With the model portfolio we measure only the survivors. The table dated November 28, 2025 shows the positions that were in the portfolio at that point. What the newsletter bought and sold again between December 2024 and November 2025 is not in it — the measured plus 23.8 percent is therefore not a portfolio scorecard, but the scorecard of five positions.
- The calculation is a what-if. The newsletter did not call on readers to buy all nine names on publication day. We make this assumption because it is the only one that favors nobody.
- The newsletter discloses a conflict of interest of its own. On page 8, "HOT STOCKS EUROPE" points out, under the EU Market Abuse Regulation (No. 596/2014), that the publisher, author or related third parties may have taken long positions in the securities discussed and intend to sell them into rising prices. In issue 24 the field for specifically named positions was left blank — whether and how much was invested therefore cannot be determined from the issue, only that the possibility exists and is disclosed.
Footnote: Three Names That No Longer Exist in That Form
For the sake of completeness, because otherwise you run into a dead end when looking things up: three names in the issue no longer go by the name the newsletter uses for them. SolGold plc was acquired by Jiangxi Copper (Hong Kong) Investment Company Limited — the High Court of Justice of England and Wales sanctioned the scheme of arrangement on March 2, 2026, it became effective on March 4, 2026 at 28 pence in cash per share, and the cancellation from the London Official List followed on March 5, 2026 (Regulatory News Service, investegate.co.uk). For the money question that was a payout, not a loss: plus 84.0 percent from the model-portfolio purchase price, minus 4.6 percent from the price on publication day. Dundee Precious Metals has been called DPM Metals since September 12, 2025, and Taseko Mines has been called Trekor Metals since June 25, 2026 — both simply name changes, with an unchanged trading symbol and an unchanged business. For the money question this had no consequences: DPM Metals stands at plus 36.0 percent, Trekor Metals at plus 36.1 percent.
Conclusion
We started with two questions. Here are the answers, straight.
First: would you have made money from the purchase onwards? Yes. 10,000 euros would have become 12,009 euros in just under eight months, 12,110 euros including dividends. That is more than a Europe ETF would have delivered in the same period, and considerably more than the DAX. After deducting the 236 euros of subscription fees, 1,773 euros remained — so on paper the model result would have more than covered the subscription cost of these eight months. But: this result hangs on a single stock. Without SUSS MicroTec it would have been 6.1 percent and therefore less than the ETF, whose ongoing costs we do not deduct either — just as we leave out fees and taxes on the other side. Anyone who did not buy the complete list — and practically nobody did — could have more than doubled their money with the same nine picks (SUSS MicroTec, plus 131.7 percent) or lost 88 percent.
Second: were the price targets reached? Almost never. One out of eight, and that one was beaten by 41.3 percent right away. The other seven fell short by between 5.9 and 96.0 percent. Even more revealing is that target attainment and return had barely anything to do with each other: ACG Metals delivered 81.8 percent even though the earnings estimate quoted was on the wrong side of zero. PFISTERER missed its target only narrowly even though everything went right in the business. A price target does not measure the quality of a company, and certainly not the return of a reader — it measures the expectation of a research house on a particular day.
What that means for you is yours to decide. But the most useful number in this tally may not be the 12,009; it may be the 6.1: the figure that remains when one single bullseye is missing. That is exactly where the difference between a method and a lucky hit lies — and after eight months that difference cannot yet be decided.
Sources
All the underlying material used here – so you can check the numbers yourself:
- Calculation method: purchase at the closing price on November 28, 2025 (publication day of the newsletter, earliest possible purchase date for a reader), valuation at the closing price on July 24, 2026. All amounts in euros, foreign currencies converted at the exchange rate prevailing on each reference date, so currency effects are included. Equal-weighted, without adding to positions, without fees, without taxes. "Including dividends" denotes the total return. For the model portfolio, return from the purchase date named in the newsletter at the purchase price named there; "with stop" means a sale at the stop-loss level on the first day it was breached; real executions are typically somewhat below that, so the calculation is simplified in favor of the newsletter in that respect.
- Prices and exchange rates: closing prices on the relevant home market or reference rates from our fundamental data set; distributions additionally checked against the annual reports. Data as of July 24 to 27, 2026.
- "HOT STOCKS EUROPE," issue No. 24, dated November 28, 2025, B-Inside International Media GmbH, Freiburg im Breisgau, Germany (author Michael Calivas) – source for the price targets, model-portfolio positions, purchase dates, purchase prices, stop-loss levels, the conflict-of-interest note on page 8 and the subscription price. A third-party opinion and expectation, not a source for company figures.
- manager magazin, June 12, 2026, report on bank loans terminated for cause at The Platform Group; counterstatement by the law firm LHR Rechtsanwälte dated the same day; secondary coverage including aktiencheck.de dated June 13, 2026 – details and references in our Platform Group analysis.
- Our 22 published individual analyses of the stocks discussed in issue 24 (each linked in the tables above) – with every metric there sourced individually against annual and quarterly reports.
- Regulatory News Service (investegate.co.uk) – "Court Sanction of Scheme of Arrangement," SolGold plc, March 2, 2026 and "Scheme of Arrangement Becomes Effective," SolGold plc, March 4, 2026.
- DPM Metals Inc. – Fourth Quarter 2025 report (MD&A), section "Our Business," p. 3, already cited in the DPM Metals analysis; "Taseko Annual General Meeting Voting Results and Change of Name," press release, trekormetals.com, June 24, 2026.
Transparency & disclaimer: this article is a journalistic assessment of publicly available information and is not investment advice, not a financial analysis in the regulatory sense and not an invitation to buy or sell securities. Past performance is no indication of future results. Equity investments carry substantial risks up to and including total loss. All information is provided without warranty; the data cut-off is noted in the text in each case. TickerGuard is itself a financial publication and to that extent competes with the stock newsletter recalculated here; this newsroom is not involved in its production. Positions held by the operator are disclosed daily; where one exists, it appears as a notice at the top of this deep dive.
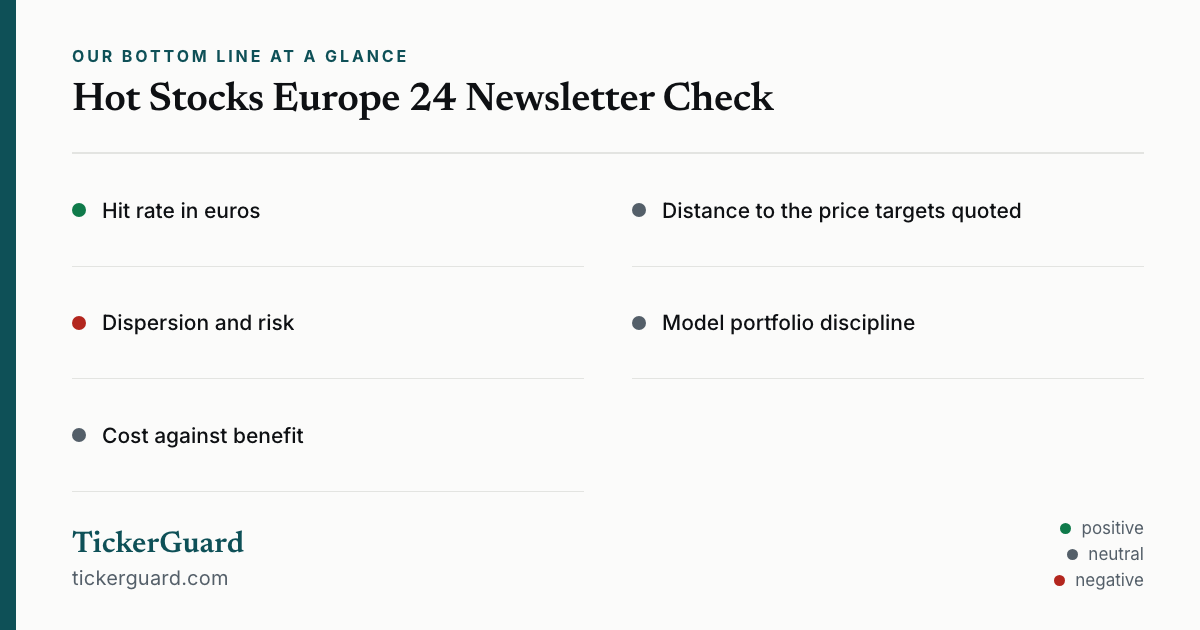
Our Bottom Line at a Glance
- Hit rate in euros positive
- Six of the nine featured stocks were up on July 24, 2026, and the equal-weighted return was plus 20.1 percent (plus 21.1 percent including dividends). On paper, 10,000 euros would have become 12,009 euros – more than with the STOXX Europe 600 (11,180 euros, same calculation basis), more than with a STOXX 600 ETF including distributions (11,410 euros against 12,110 euros including dividends) and more than with the DAX (10,530 euros).
- Distance to the price targets quoted neutral
- Of eight specific analyst price targets, one had been reached as of the reference date – SUSS MicroTec, and that one was beaten by 41.3 percent right away. The other seven were between 5.9 percent (PFISTERER) and 96.0 percent (The Platform Group) below their targets; the issue names no time horizon for any of them, so the measurement is a snapshot. Target distance and return had barely anything to do with each other: ACG Metals delivered plus 81.8 percent even though the estimate quoted for 2025 – earnings per share of 0.48 U.S. dollars – ended up as an audited loss of 2.04 U.S. dollars.
- Dispersion and risk negative
- The result hangs on a single stock: without SUSS MicroTec, only 6.1 percent of the 20.1 percent remain – 10,000 euros would then have become 10,614 euros, less than the 11,180 euros of the STOXX Europe 600 on the same calculation basis. There are 220 percentage points between the best and the worst stock (plus 131.7 against minus 88.2 percent). Anyone who did not buy the complete list would have ended up somewhere else entirely.
- Model portfolio discipline neutral
- The stop-loss levels are publicly verifiable with a purchase date, purchase price and level for each position. Position by position they worked: for Pharming plus 42.9 instead of plus 21.1 percent, for Serviceware minus 16.2 instead of minus 21.4 percent. For Tharisa they cost the 24.9 percent the position would otherwise be up – 370 euros on balance. Five positions together: 112,900 euros invested, 139,720 euros as a result (without stops 140,090 euros).
- Cost against benefit neutral
- 29.50 euros a month comes to 236 euros for eight months and therefore 2.4 percentage points on a 10,000-euro stake – a gain of 2,009 euros turns into 1,773 euros, and the lead over the ETF shrinks from around 700 to around 464 euros. With smaller portfolios the math turns quickly: on a 5,000-euro stake the subscription costs almost five percentage points.
The money question has a clear answer: 10,000 euros, spread equally across the nine featured stocks on November 28, 2025, would on paper have become 12,009 euros by July 24, 2026 – up 20.1 percent and therefore more than the STOXX Europe 600, a STOXX 600 ETF, an MSCI World ETF or the DAX. But the result rests on a single stock: without SUSS MicroTec, 6.1 percent remain. Of eight price targets, one had been reached as of the reference date, and 236 euros of subscription fees for eight months cost 2.4 percentage points. A model calculation excluding fees and taxes, not investment advice.
Worth Noting
- This article deliberately carries no company quality rating block: the rating judges the substance of a single company from its financial reports – here an entire newsletter issue with 23 stocks discussed is recalculated in euros.
- The return calculation is a what-if: the newsletter did not call on readers to buy all nine featured stocks equally weighted on publication day. We make this assumption because it favors no individual name.
- Not included in the portfolio scorecard is the sixth model-portfolio position, a turbo certificate on ASML (bought September 19, 2025 at 2.80 euros, carried in the newsletter at 3.90 euros) – the price histories of leveraged products are not publicly archived. The ASML share itself gained 73.0 percent over the measurement period; only in the overall view across all 23 names do we use it as a substitute, and we state the figure without it as well (plus 12.3 percent across 22 names).
- The six portfolio positions, measured from November 28, 2025 and therefore comparable with the other stocks of the issue: Pharming Group minus 23.5 percent, Tharisa plus 17.2 percent, SolGold minus 4.6 percent (cash consideration), Serviceware minus 12.1 percent, Serabi Gold minus 6.9 percent, ASML plus 73.0 percent. The table in the text, by contrast, measures from the real purchase date named in the newsletter.
- Data cut-off for this article: July 24 to 27, 2026. Calculated excluding fees and taxes.
Download the verdict card (traffic light and rating of this analysis as an image, PNG)
The full analysis as a PDF for later
We will send you this analysis as a PDF — to print, file away, and read at your own pace.
Frequently Asked Questions
Yes. Anyone who had spread 10,000 euros equally across the nine stocks featured in the issue on publication day, November 28, 2025, and held them until July 24, 2026 would have had 12,009 euros – a gain of 2,009 euros or 20.1 percent, and 12,110 euros including dividends. This is a model calculation, not a replayed portfolio: the newsletter did not call on readers to buy all nine names on publication day. The second half of the answer matters: without the single outlier SUSS MicroTec (up 131.7 percent) it would have been just 6.1 percent.
Over the same period, 10,000 euros became 11,410 euros with a STOXX 600 ETF including distributions and 11,240 euros with an MSCI World ETF. The nine stocks were therefore around 700 euros ahead at 12,110 euros (including dividends) – before the subscription fee. After 236 euros of subscription costs, roughly 464 euros of that remain. Without SUSS MicroTec the index investment would have been ahead: 11,180 euros (STOXX Europe 600, pure price return) against 10,614 euros on the same basis.
Purchase at the closing price on publication day, November 28, 2025, valuation at the closing price on July 24, 2026, everything in euros and at the exchange rate prevailing on each reference date – so currency gains and losses are included. Equal-weighted, meaning roughly 1,111 euros per name with fractional shares assumed, without adding to positions, without fees and without taxes. This is a what-if: nowhere did the newsletter call on readers to buy all nine names on publication day.
Of eight specific analyst price targets named in the newsletter, exactly one had been reached by July 24, 2026: SUSS MicroTec beat the target of 56 euros by 41.3 percent. The other seven remained below – PFISTERER by 5.9 percent, Thor Explorations by 33.7, Pharming by 35.2, SolGold by 39.1, R&S Group by 42.1, Fermi by 80.0 and The Platform Group by 96.0 percent. For context: the issue names no time horizon for any of these targets, so our measurement is a snapshot as of the reference date and not a final score.
The five verifiable positions tied up 112,900 euros at their purchase prices and were worth 139,720 euros in the end with the stop-loss levels of the newsletter, which is plus 23.8 percent. The stops helped at Pharming (plus 42.9 instead of plus 21.1 percent) and Serviceware (minus 16.2 instead of minus 21.4 percent) and cost return at Tharisa: stopped out there at nil, the position would be up 24.9 percent today. On balance the stops cost 370 euros – without them it would have been 140,090 euros. The sixth position, a turbo certificate on ASML, is a leveraged product and cannot be recalculated.
That depends on the size of the portfolio, not on the quality of the newsletter. 29.50 euros a month comes to 236 euros for eight months. On a 10,000-euro stake that is 2.4 percentage points of return, on 5,000 euros almost five percentage points, on 50,000 euros less than half a point. The measured gain of 2,009 euros turns into 1,773 euros after the subscription fee. Eight months, however, is too short a period to derive a rule from.
No. This article recalculates what happened to previously published picks by a third party over a completed period. It contains no buy or sell recommendation and no forecast. Nor does it grade the publisher; it measures solely how the stocks named in one single issue developed over a completed period. Past performance is no indication of future results; equity investments can lead to total loss.
Found an error?
Did you spot a factual error, an outdated number, or a typo in this deep dive? Let us know briefly — your report goes straight to the editorial team.