Realty Income: The Dividend Arrives on Time — but Twice as Many Shares Split the Pie
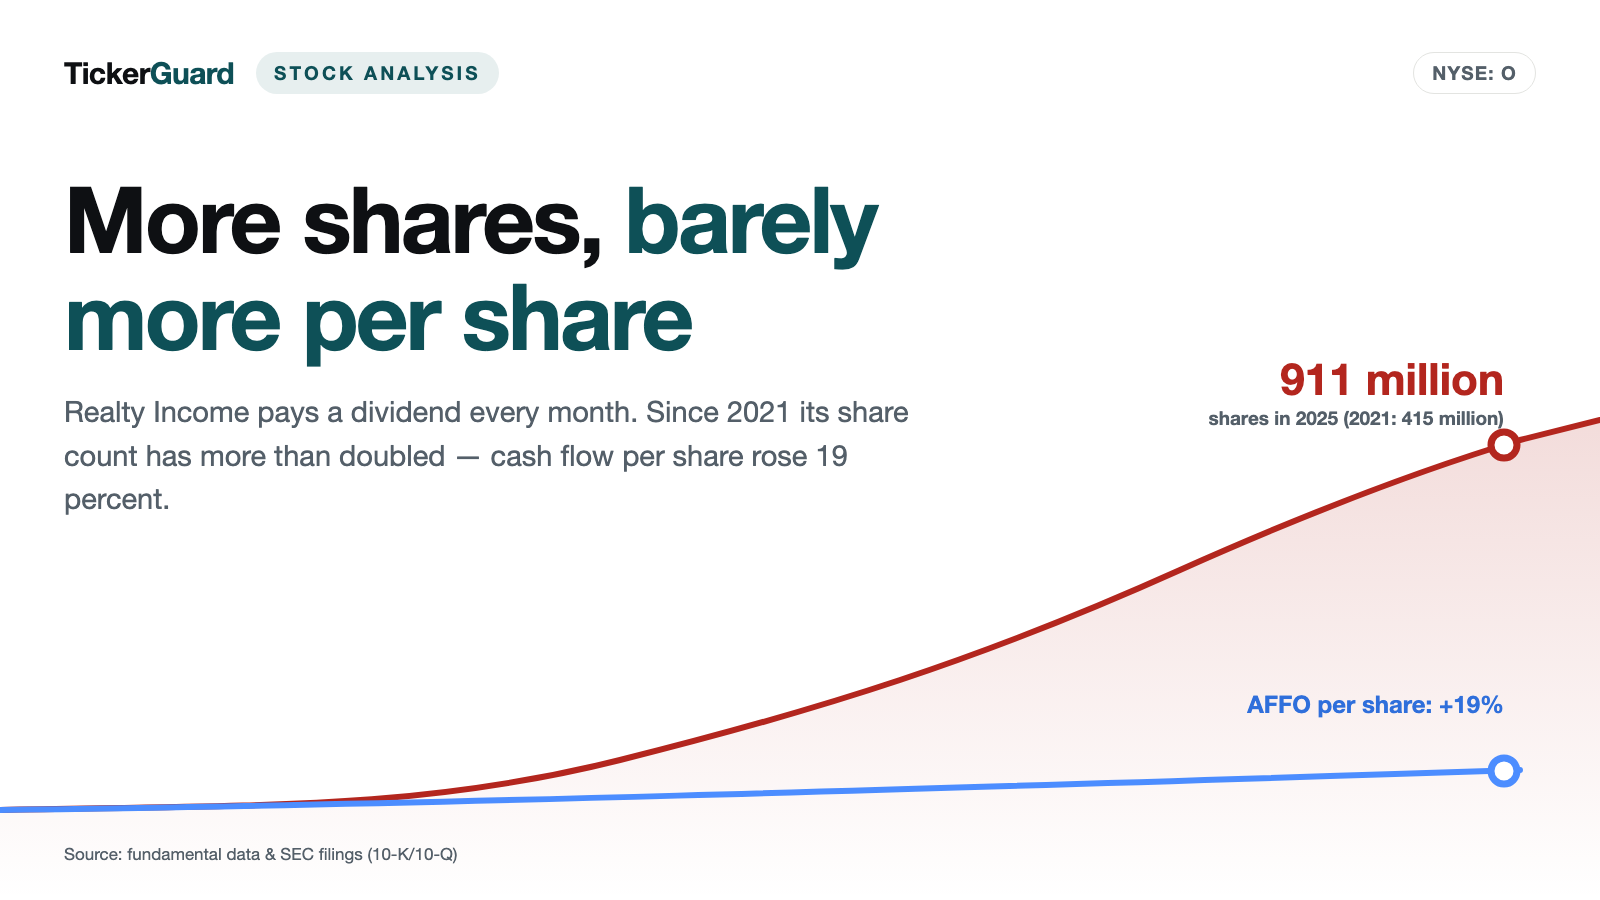
Realty Income has declared 673 consecutive monthly dividends and leases more than 15,500 grocery stores, convenience stores and warehouses. Its filings also show this: since 2021, revenue has nearly tripled and the share count has more than doubled, while cash flow per share rose only 19 percent. On top of that, the landlord nearly doubled its loan book in the first six months of 2026. Not investment advice — just the math on how much of every new dollar reaches the individual share.
 Thomas Mücke
Founder & Publisher
Thomas Mücke
Founder & Publisher
As of Today
As of: October 2, 2026
- Closing price
- 54.10 $ +1.10%
- Market Capitalisation
- 49.9 $B
- P/E
- 45.7
- Growth Score
- 4/10
- AAQS
- 6/10
Price change since October 2, 2026: -0.1%
This analysis has a cut-off date. The Stock Guard tells you when something material changes in the numbers. Reserve your free spot
Chart
Interactive price chart (TradingView).
52-week range: 53.50 $ to 67.60 $ · Last price: 54.10 $ (As of: October 2, 2026)
Note: pure fact-based analysis, not investment advice and not a solicitation to buy or sell. All figures without guarantee.
There is a feeling the stock market underrates: the comfort of regularity. When a payment lands every month, a stock starts to feel like a second paycheck. The brain draws a convenient conclusion: whatever pays this reliably must be healthy, and whatever is healthy grows. Let’s call it the paycheck effect. It confuses reliability with growth — and stops asking where the money comes from that is supposed to make the payment bigger every year.
Realty Income Corporation (NYSE: O) has turned that feeling into a brand. The San Diego real estate company calls itself “The Monthly Dividend Company” and, according to its August 5, 2026 earnings release, has declared 673 consecutive monthly dividends since its founding. June 2026 brought its 115th consecutive quarterly increase. The dividend has gone up every year for more than 31 years. Among U.S. dividend stocks, Realty Income is one of the well-known names.
So here is the deal: before the paycheck effect wins you over, let’s read together what Realty Income itself has told the U.S. securities regulator, the SEC — the annual reports (10-K) for 2021 through 2025, the quarterly report (10-Q) for the period ended June 30, 2026, and every current report (8-K) through August 25, 2026. The central tension of this analysis: the dividend is reliable, but the growth behind it is bought with new shares and new debt — and less and less of it reaches each share. Whether that bothers you is your call.
What Realty Income actually does — landlord to grocery stores, gas stations and home improvement chains
Realty Income buys freestanding commercial properties and leases them long term to a single tenant. The model is called a net lease: according to the annual report, the tenant typically pays not just rent but also property taxes, insurance and maintenance. Imagine renting out an apartment where the tenant also covers the property tax and the roof repair. Your income is predictable and your work is light — as long as the tenant pays.
The scale: as of June 30, 2026, Realty Income owned or held interests in 15,588 properties, leased to 1,798 clients in 92 industries, across all 50 U.S. states, the United Kingdom and eight other European countries. Occupancy was 98.8 percent, and the weighted average remaining lease term was about 8.6 years. Properties re-leased in the second quarter of 2026 brought in 2.7 percent more rent on average than before. By annualized base rent, 78.3 percent is retail, 16.2 percent industrial, 3.1 percent gaming (including the Bellagio in Las Vegas) and 2.4 percent other. The largest industries are grocery (11.1 percent), convenience stores (9.4 percent), home improvement (6.4 percent) and dollar stores (6.0 percent). The largest clients are Dollar General (3.3 percent of annualized base rent), 7-Eleven (3.1), Walgreens (3.0) and Family Dollar (2.6). About a third of rent (34.3 percent) comes from investment-grade clients, meaning strong credit; 52.0 percent comes from retailers without such a rating.
Legally, Realty Income is a REIT (real estate investment trust), a property company that pays no corporate income tax as long as it distributes at least 90 percent of its taxable income. That is why the dividend is high, and why little stays inside the company. For you as a reader, it means ordinary net income says little about a REIT. Buildings are depreciated every year in the accounts as if they were wasting away, even though a well-located grocery store often gains value. In 2025, $1.06 billion of net income available to common stockholders compared with $2.52 billion of depreciation and amortization. The industry therefore uses FFO (funds from operations: net income plus depreciation, excluding gains on sales) and the stricter AFFO (adjusted FFO, which strips out further non-cash items). AFFO is the number Realty Income measures itself by — $3.89 billion in 2025, or $4.28 per share.
Two things have been added in recent years: Europe (about 19 percent of annualized base rent as of December 31, 2025, according to the annual report) and a growing business in loans, joint ventures and funds for outside investors. Rule of thumb: a net lease landlord is at its core a bet on its tenants’ ability to pay — and on the cost of its own money.
Company history for investors
-
1969
Founded
Realty Income is founded; according to its 08/05/2026 earnings release, it has declared 673 consecutive monthly dividends since then.
-
1994
NYSE listing
Since listing, Realty Income has raised its dividend 135 times through June 2026, including 115 consecutive quarterly increases.
-
2021
VEREIT merger, Orion spin-off
VEREIT acquired for stock on 11/01/2021; office properties handed to shareholders as Orion on 11/12/2021. The share count starts to climb steeply.
-
2024
Spirit Realty Capital merger
Closed on 01/23/2024, again for stock. The weighted average share count rises to 866 million in 2024, AFFO per share to $4.19.
-
2026
Loans, funds, data centers, A rating
Apollo pays $1.0 billion for 49% of 492 properties, the loan book nearly doubles, Fitch assigns an A rating, and a $1.0 billion convertible follows in August.
How the stock landed on our desk — via the wallstreet-online ranking
Not through one of our fundamentals screens. In early October 2026, Realty Income showed up in the ranking of the most-discussed stocks on wallstreet-online, one of Germany’s largest retail investing sites (as of October 4, 2026). That fits: monthly dividend stocks are a perennial topic in retail forums, and the stock had fallen. It closed at $54.13 on October 2, 2026, down from $67.56 on March 2, 2026. According to the EDGAR filing index (retrieved October 4, 2026), Realty Income filed no current report after August 25, 2026; its filings offer no explanation for the decline.
Let’s translate the two numbers people discuss there, and judge them. The dividend yield of about 6.0 percent ($3.252 annualized dividend per the quarterly report against a $54.13 share price) is high for a company rated A — for comparison, the quarterly report itself cites 5.2 percent based on the June 30, 2026 share price. The price-to-AFFO ratio of just over 12 ($54.13 against the $4.445 midpoint of 2026 guidance) means you pay about twelve dollars for each dollar of annual cash flow. That is neither a crisis discount nor a premium for growth. Put the two together and you get exactly the invitation the paycheck effect needs.
The numbers over the years — an honest look
First, credit where it is due. Revenue rose from $2.08 billion (2021) to $5.75 billion (2025). AFFO per share did not decline in any of those years; it climbed from $3.59 to $4.28. Dividends paid per share grew from $2.83 to $3.22, and they stayed at about three quarters of AFFO every year — 75 percent in 2025. Read the other way around: AFFO was 27 to 34 percent above dividends paid in every year. The remaining quarter stays in the company: $965 million of AFFO after distributions in 2025, according to the annual report. In the first half of 2026, $483 million of adjusted free cash flow was left after all dividends and recurring capital spending.
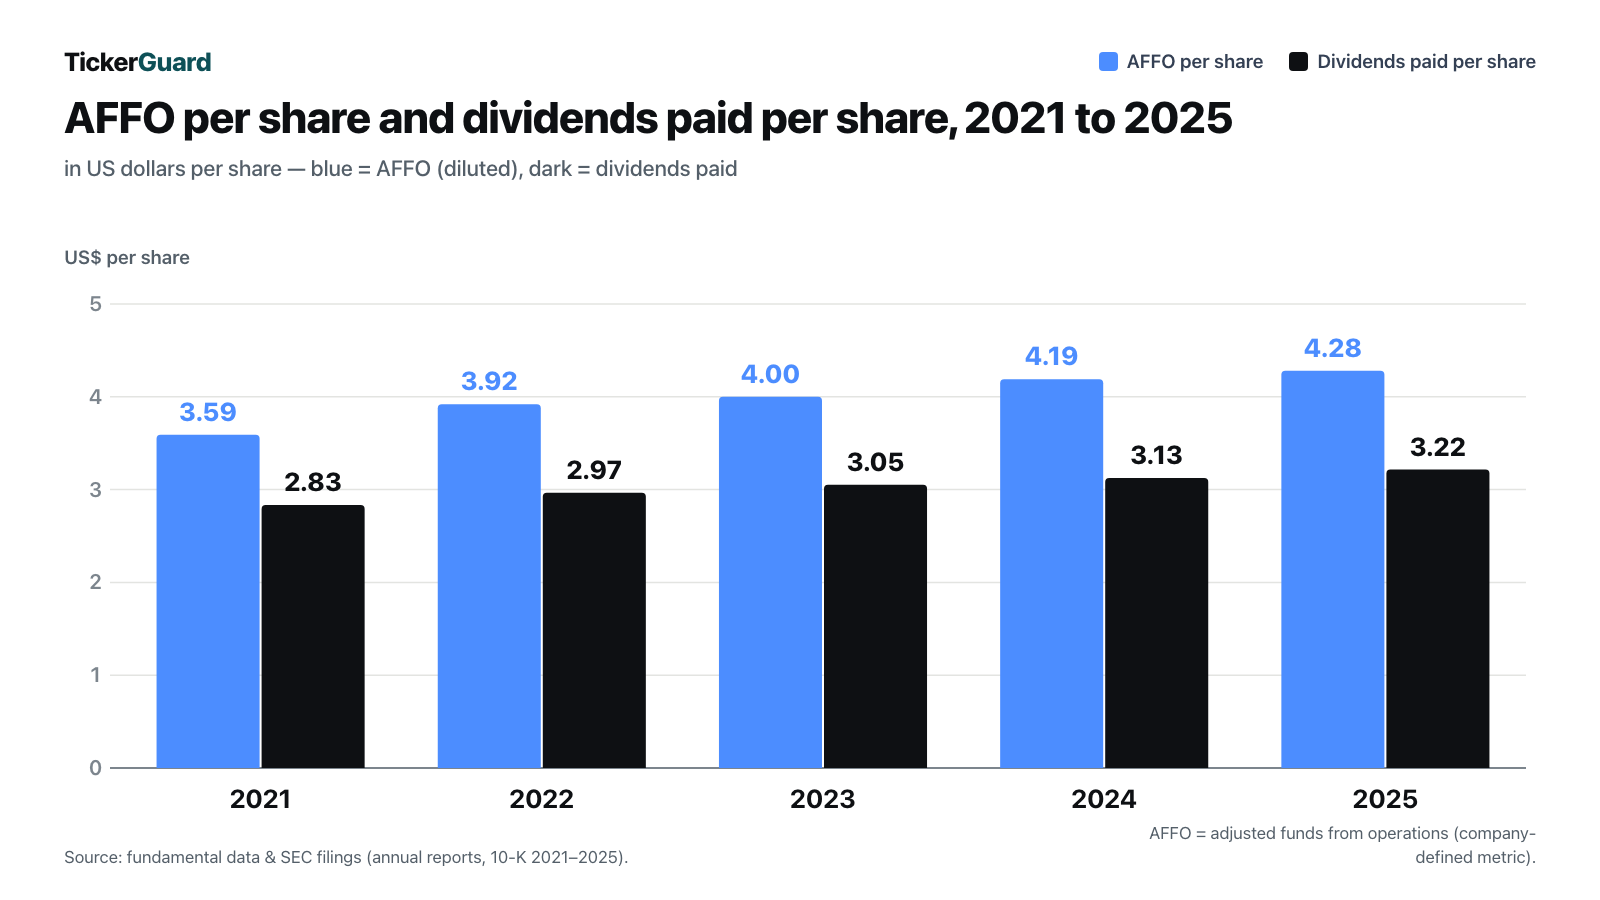
2026 is solid, too. In the second quarter, AFFO per share rose 3.8 percent to $1.09, and full-year guidance was raised to $4.44 to $4.45, about 4 percent growth at the midpoint. On August 3, 2026, Fitch Ratings assigned an issuer rating of A with a stable outlook. That is a strong credit rating.
Now the second look, and it is the more important one. The next chart sets every value for 2021 at 100. By 2025, revenue stands at 276 — it has nearly tripled. The weighted average share count stands at 220 — it has more than doubled, from 415 million to 911 million. And AFFO per share, the part that reaches the individual shareholder, stands at 119.
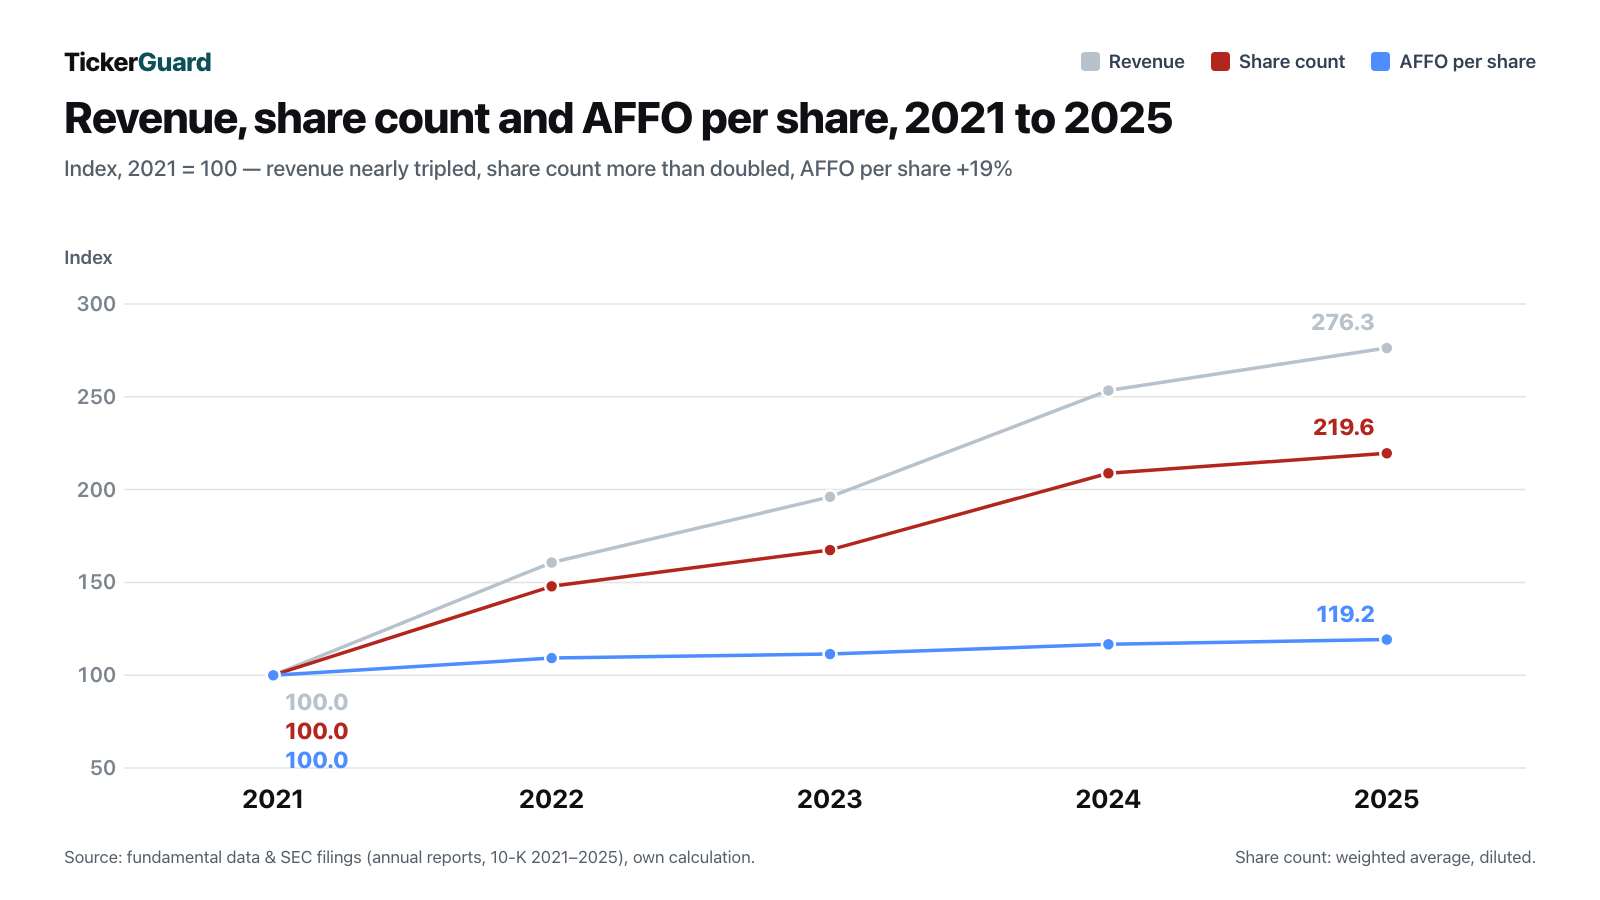
That is the heart of this analysis. Rule of thumb: a company can grow enormously without its individual shareholders noticing much — if it pays for that growth with new shares.
Uncomfortable truth No. 1: Growth is paid for with new shares
Where did the extra 496 million shares come from? Mainly from two acquisitions Realty Income paid for in stock: VEREIT on November 1, 2021, and Spirit Realty Capital on January 23, 2024. On top of that runs a permanent program: through its at-the-market (ATM) program, Realty Income sells new shares directly into the market on an ongoing basis. Picture a pie that gets baked bigger every year — but also cut into more and more slices. Whether your slice grows depends on which grows faster. The company describes the principle itself in its risk factors:
“Our future growth will depend upon our ability to raise additional capital. Raising capital through the issuance of equity securities, including securities exchangeable into our equity securities or convertible debt securities, can dilute the interests of holders of our common stock.”
— Realty Income Corporation, SEC annual report 10-K for 2025, Item 1A (Risk Factors)

What that looks like in 2026 is spelled out in the quarterly report for the period ended June 30, 2026:
“During the three months ended June 30, 2026, we raised $843.0 million of proceeds from the sale of common stock, at a weighted average of $61.52, primarily through the settlement of 13.7 million shares of common stock under our ATM program.”
— Realty Income Corporation, SEC quarterly report 10-Q for the period ended June 30, 2026, Item 2 (MD&A)
And it continues: as of August 5, 2026, about 22.5 million shares already sold under forward contracts had not yet been delivered, representing about $1.3 billion of expected proceeds, according to the quarterly report. On August 14, 2026, a $1.0 billion convertible note followed, paying 3.750 percent and due in 2031. It can be converted into shares if the stock rises substantially: the initial conversion price of about $72.72 was 17.5 percent above the $61.89 close on August 11, 2026. A hedge (capped call) is meant to offset dilution up to a share price of about $83.55; from the proceeds, Realty Income simultaneously repurchased 3.0 million of its own shares for $188.7 million.
Why is that a problem if every new dollar gets invested? Because the model depends on a spread. In the second quarter of 2026, Realty Income invested at an initial weighted average cash yield of 7.3 percent. In our deliberately simplified math, new shares “cost” at least the dividend that will be paid on them: about 5.3 percent at the $61.52 issue price, about 6.0 percent at the $54.13 close on October 2, 2026. The rest of the acquisitions is paid for with debt, which now costs about 5 percent for new issues (more on that in truth No. 4); the real hurdle is the blend of both. The lower the share price and the higher the interest rate, the thinner the spread — and the less is left for existing shareholders. That 176 percent revenue growth from 2021 to 2025 turned into only 19 percent more AFFO per share shows how little of that spread reached the individual shareholder.
Uncomfortable truth No. 2: The dividend rises in tenth-of-a-percent steps — and is not guaranteed
A streak of 115 consecutive increases sounds dynamic. The quarterly report shows how big the steps are: the monthly dividend rose to $0.2700 in December 2025, to $0.2705 in March 2026 and to $0.2710 in June 2026 — each time by $0.0005, about 0.2 percent. In the first half of 2026, dividends paid were only 1.2 percent above the prior year, and in the second quarter 0.7 percent — while AFFO per share rose 3.8 percent. Over four years, from 2021 to 2025, dividends paid per share grew about 14 percent, a little over 3 percent a year. The streak continues, but the growth behind it is small. And the company itself says it is not certain:
“Although we expect to continue our policy of paying monthly dividends, we cannot guarantee that we will maintain our current level of dividends, that we will continue our pattern of increasing dividends per share, or what our actual dividend yield will be in any future period.”
— Realty Income Corporation, SEC quarterly report 10-Q for the period ended June 30, 2026, Item 2 (distribution policy)

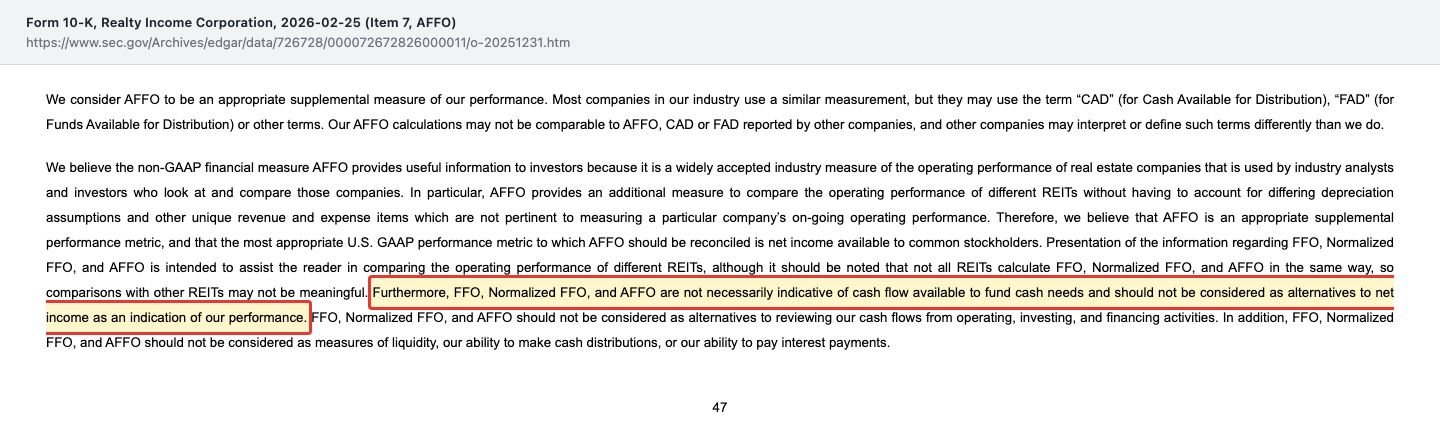
There is another detail many investors miss: the dividend is far higher than net income under accounting rules. In 2025, Realty Income paid $2.92 billion to its common stockholders against $1.06 billion of net income. Its June 30, 2026 balance sheet shows $11.4 billion of cumulative “distributions in excess of net income.” For a REIT, that is normal because of depreciation — but only as long as you trust the substitute metric, AFFO. And about that metric, the company itself writes:
“Furthermore, FFO, Normalized FFO, and AFFO are not necessarily indicative of cash flow available to fund cash needs and should not be considered as alternatives to net income as an indication of our performance.”
— Realty Income Corporation, SEC annual report 10-K for 2025, Item 7 (AFFO)
To be fair: operating cash flow of $2.02 billion in the first half of 2026 clearly exceeded the $1.51 billion of dividends. The dividend is covered today. The question is not whether it gets cut tomorrow, but how fast it can still grow when little is added per share.
Uncomfortable truth No. 3: The landlord is becoming a lender
The most surprising number in this analysis sits in Note 5 of the quarterly report. Alongside its leases, Realty Income is increasingly making loans. The loan book grew in just six months from $1,682.1 million (December 31, 2025) to $3,297.6 million (June 30, 2026), nearly doubling. In the first half of 2026 alone, $1,660.2 million in principal was funded. Interest and dividend income on loans and preferred equity investments rose to $88.5 million in the second quarter, from $39.5 million a year earlier. A large part is neither secured by property nor otherwise senior:
“Our investments in unsecured and mezzanine loans represent loans whose proceeds are being used by borrowers to fund data center and industrial investments.”
— Realty Income Corporation, SEC quarterly report 10-Q for the period ended June 30, 2026, Note 5 (Investments in Loans)

As of June 30, 2026, that meant $1,261.0 million of unsecured and mezzanine loans (subordinated loans that get repaid only after senior lenders if things go wrong) at a weighted average rate of 9.1 percent. On top come secured loans, construction loans and mortgage loans; another $375.4 million is committed but not yet funded. Note 5 does not name the borrowers. Provisions for credit losses on loans and financing receivables cost $46.4 million in the first half of 2026, more than twice the prior-year period ($20.3 million). $27.2 million of that related to loans — according to the quarterly report, mainly initial expected credit losses on loans acquired or originated — and $16.9 million to financing receivables.
At the same time, Realty Income is reshaping its property business. In June 2026, it announced a joint venture with Cloud Capital: up to $1.4 billion for a 45 percent stake in three hyperscale data centers in Northern Virginia valued at more than $6.0 billion. On March 31, 2026, it took $1.0 billion from the investment firm Apollo for a 49 percent interest in a portfolio of 492 retail properties. In the first half of 2026, noncontrolling interests on the balance sheet rose from $685 million to $2.38 billion, mainly because of Apollo and contributions to the company’s own U.S. Core Plus Fund. The annual report states the consequence openly: Realty Income invests “outside of our historical focus on acquiring freestanding, single-tenant, net lease retail properties located in the U.S.” That can pay off: loans earn more interest than leases earn rent. But it is a different business, with different default risks, from the one the stock built its reputation on.
Uncomfortable truth No. 4: The cheap debt is running out
As of June 30, 2026, Realty Income had about $31.0 billion of debt, and net debt stood at 5.4 times annualized pro forma adjusted EBITDAre (earnings before interest, taxes, depreciation and amortization for real estate). Many of its bonds date from the low-rate era. According to the maturity table in the 2025 annual report, $2.39 billion of fixed-rate debt comes due in 2026 at an average rate of 4.09 percent, and another $2.90 billion in 2027 at an average of just 2.80 percent. What new money costs is shown by the April 2026 notes: a 4.750 percent coupon in dollars, an effective yield of 5.047 percent to maturity in 2033. In July 2026, a euro bond due 2032 cost an effective 3.716 percent.
The effect is already visible: interest expense rose 10.0 percent to $312.1 million in the second quarter of 2026, practically in step with revenue (up 9.7 percent). That is not threatening: adjusted EBITDAre of $1,385.2 million in the second quarter covered interest about 4.4 times by our calculation, Fitch rates the company A, and it had $3.5 billion of available liquidity as of June 30, 2026. But every percentage point of higher interest on maturing debt eats into per-share growth that is already thin. One example by our calculation: if the $2.90 billion maturing in 2027 had to be replaced at about 5 percent instead of 2.80 percent, interest would rise by about $64 million a year — roughly 7 cents per share, or a little over 1.5 percent of expected 2026 AFFO. We worked through what rising financing costs do to a smaller property company in our analysis of HAMBORNER REIT.
A second risk sits on the tenant side. 52.0 percent of annualized base rent comes from retailers without an investment-grade rating, including Walgreens (3.0 percent) and Family Dollar (2.6 percent). Impairments on real estate were $434.5 million in 2025 and $144.4 million in the first half of 2026. Against a portfolio of $64.6 billion at cost, those are not dramas, but they are reminders that even long leases with weak tenants can end.
Valuation — about twelve times AFFO, a six percent dividend
With 946,218,033 shares outstanding (as of July 30, 2026) and a closing price of $54.13 on October 2, 2026, Realty Income is worth about $51.2 billion. At the August 11, 2026 price ($61.89, cited in the current report on the convertible notes), it was about $58.6 billion. The price-to-AFFO ratio is just over 12 based on the 2026 guidance midpoint, and the dividend yield is about 6.0 percent. The price-to-earnings ratio of almost 40 shown in data boxes says little for a REIT because of depreciation.
The 25 analysts covering the stock according to fundamental data (as of October 4, 2026) are cautious: 7 rate it a buy, 17 a hold, 1 a sell. Their average price target is about $66.39. Average here means: all available price targets added up and spread evenly — single very high or very low targets move it noticeably. A price target is an opinion, not a promise.
What does that mean? At about 12 times AFFO and roughly 4 percent per-share growth in guidance, you are paying for solid but slow-growing cash flow — the return comes mostly from the dividend, not from growth. How we assessed an even higher REIT dividend is shown in our analysis of CTO Realty Growth, a smaller retail REIT (a dividend of about 7 percent as of July 2026; it also covers a short-seller report). All valuation figures for Realty Income are dated early October 2026 and are not live prices.
Opportunities and risks at a glance
What speaks for Realty Income:
- Reliability: 673 consecutive monthly dividends, 115 consecutive increases (as of June 2026), dividend raised every year for more than 31 years; payout at about three quarters of AFFO.
- Broad, fully leased portfolio: 15,588 properties, 1,798 clients, 92 industries, 98.8 percent occupancy, re-leasing 2.7 percent above prior rent (June 30, 2026).
- Strong credit: Fitch rating A since August 3, 2026, interest coverage about 4.4 times (our calculation, Q2 2026), $3.5 billion of available liquidity.
- Guidance raised: 2026 AFFO per share of $4.44 to $4.45, about 4 percent growth.
What speaks against it:
- Dilution: share count more than doubled from 2021 to 2025 (415 million to 911 million), AFFO per share up only 19 percent; 22.5 million forward shares outstanding, $1.0 billion convertible since August 2026.
- Small dividend steps: $0.0005 per month each time, only 0.7 percent higher in the second quarter of 2026; no guarantee per the quarterly report.
- New lending business: loan book up from $1.68 billion to $3.30 billion in six months, about $1.24 billion of it (carrying value) unsecured or subordinated; credit loss provisions of $46.4 million in the first half of 2026.
- Pricier debt and weaker tenants: $2.39 billion (2026) and $2.90 billion (2027) of fixed-rate debt at 4.09 and 2.80 percent rolls off; 52.0 percent of rent from retailers without an investment-grade rating.
A human conclusion
Back to the paycheck effect. Realty Income’s monthly dividend is no illusion: it is covered, it has arrived on time for decades, and behind it stands a broad portfolio with an A rating from Fitch (August 3, 2026). So far the dividend has arrived reliably; per the quarterly report, that is no promise for the future. What the paycheck does not show is in the filings: much of the growth of recent years was paid for with new shares, so only a fraction of it reached the individual shareholder. The increases have shrunk to about 0.2 percent per step. And to keep growing, the landlord is turning into a lender and fund manager — a business with different risks from the one the stock is famous for.
To be fair, in early October 2026 the market asks only about twelve times cash flow for all this and offers a six percent dividend. Whoever buys here buys not growth but income that rises slowly — and should know it. Before you mistake a punctual dividend for growth, always ask how many shares are splitting the pie. The next chance to check is the quarterly report for the third quarter of 2026: it will show how many new shares were added and how the loan book developed. What you make of it is your decision. And that is how it should be.
Sources
All original documents used in this analysis — so you can check them yourself:
- Realty Income Corporation — quarterly report on Form 10-Q for the period ended June 30, 2026 (filed August 6, 2026) — latest periodic report: balance sheet, share count, loans and credit loss allowance (Note 5), distribution policy, ATM program, joint ventures with Apollo and Cloud Capital
- Realty Income Corporation — second-quarter 2026 earnings release, Form 8-K of August 5, 2026, Exhibit 99.1 (AFFO, 2026 guidance, occupancy, debt, Fitch rating, liquidity) and Q2 2026 supplemental (clients, industries, credit ratings)
- Realty Income Corporation — Form 8-K of August 12, 2026, Exhibit 99.1 (pricing of the convertible notes, $61.89 close on August 11, 2026) and Form 8-K of August 14, 2026, Items 2.03 and 3.02 (closing of $1.0 billion, capped call, share repurchase)
- Realty Income Corporation — annual report on Form 10-K for 2025 (filed February 25, 2026) — Item 1 (business), Item 1A (risk factors), Item 7 (FFO/AFFO), Item 7A (debt maturities)
- Realty Income Corporation — annual reports on Form 10-K for 2024, 2023, 2022 and 2021 (AFFO per share, dividends paid, revenue, share count, Spirit and VEREIT mergers)
- Closing prices on March 2 and October 2, 2026 (price anchor $54.13) and analyst ratings: source: fundamental data. Market value, price-to-AFFO ratio, interest coverage and index values are our own calculations. Multi-year figures: source: fundamental data & SEC filings (annual and quarterly reports, 10-K/10-Q).
Transparency & disclaimer: This analysis is a journalistic assessment of publicly available information. It is not investment advice, not a financial analysis in the regulatory sense, and not a solicitation to buy or sell securities. Investing in stocks involves substantial risk, up to and including the total loss of your capital. All information without guarantee; the date of the data is noted in the text. Positions held by the operator are disclosed daily; where one exists, it appears as a notice at the top of this deep dive.
Key figures at a glance
All monetary figures in millions of $; earnings per share as reported.
| Metric | 2021 | 2022 | 2023 | 2024 | 2025 |
|---|---|---|---|---|---|
| Revenue | 2,080.5 | 3,343.7 | 4,079.0 | 5,271.1 | 5,749.4 |
| Operating Income (EBIT) | 952.0 | 1,308.5 | 1,722.3 | 2,320.9 | 1,627.1 |
| Net Income | 359.5 | 869.4 | 872.3 | 860.8 | 1,058.6 |
| Net Margin | 17.3% | 26.0% | 21.4% | 16.3% | 18.4% |
| Earnings Per Share | 0.87 $ | 1.42 $ | 1.26 $ | 0.98 $ | 1.17 $ |
Source: fundamental data & SEC filings (annual and quarterly reports, 10-K/10-Q)
Our Bottom Line at a Glance
- Portfolio and tenants positive
- 15,588 properties, 1,798 clients, 98.8% occupancy, re-leasing 2.7% above prior rent (06/30/2026); but 52.0% of rent from retailers without an investment-grade rating.
- Dividend positive
- 673 consecutive monthly dividends (08/05/2026), payout at about 75% of AFFO (2025); recent increases only $0.0005 per month per quarter.
- Growth per share negative
- Revenue 2021–2025 up 176%, share count up 120%, AFFO per share up only 19% ($3.59 → $4.28); 22.5 million forward shares outstanding (08/05/2026).
- Balance sheet and credit positive
- Fitch rating A (08/03/2026), net debt/EBITDAre 5.4x, interest coverage about 4.4x (our calculation, Q2 2026), $3.5 billion of available liquidity.
- Lending business negative
- Loan book up from $1.68 billion to $3.30 billion in six months, of which $1.24 billion unsecured/mezzanine (carrying values); credit loss provisions of $46.4 million in H1 2026 (prior year $20.3 million).
- Refinancing neutral
- $2.39 billion (2026) and $2.90 billion (2027) of fixed-rate debt at 4.09% and 2.80% maturing; new 2033 dollar notes yield 5.047%; Q2 2026 interest expense up 10.0%.
Realty Income is a broadly diversified, fully leased net lease landlord with an A rating and a monthly dividend that has arrived on time for decades. On the other side: growth largely paid for with new shares, dividend increases in the tenth-of-a-percent range, a fast-growing lending business and pricier refinancing. Not investment advice.
What Our Rating Means
Quality confirmed
Business model, numbers and balance sheet hold up to our review. Whether the current price supports an entry is a separate question — it hangs on the price, not on the company.
Green rates the company, not the share price. The substance is documented: 98.8 percent occupancy, broad diversification across 1,798 clients, AFFO that exceeded dividends paid by 27 to 34 percent in every year since 2021, interest coverage of about 4.4 times and an A rating. The weaknesses in this analysis — dilution, small dividend steps, the new lending business — affect growth per share, not the survival of the company. Whether about twelve times AFFO is enough for so little growth is a question of price. The decision is yours.
A journalistic assessment by our editorial team at the time of the deep dive, based on public sources — not investment advice and not a solicitation to buy or sell. Your personal circumstances (investment goals, risk capacity, taxes) cannot be taken into account. What our levels mean, how verdicts are formed, and what conflicts of interest exist →
Worth Noting
- Version of October 4, 2026, based on the 10-K annual reports for 2021 through 2025, the 10-Q for the period ended June 30, 2026 (latest periodic report, filed August 6, 2026), the earnings release and supplemental of August 5, 2026, and the Forms 8-K of August 11, August 12, August 14 and August 25, 2026. The hook was the wallstreet-online ranking (as of October 4, 2026), not a hit in our fundamentals screens.
- FFO and AFFO are company-defined metrics, not U.S. GAAP measures. Index values (2021 = 100), price-to-AFFO, dividend yield, interest coverage and the simplified spread math on new shares are our own calculations. The multi-year share count is the weighted average diluted figure from the annual reports.
- The price anchor is the $54.13 close on October 2, 2026 (source: fundamental data). Cross-check of market value against the filing price of $61.89 (8-K, August 11, 2026): $58.6 billion versus $51.2 billion; the gap matches the share price decline through early October 2026.
Stock Watch
This analysis is as of October 4, 2026. Stock Watch will tell you what's changed at O since then.
Later $1 a month per stock — signing up is free, and you'll be the first to know when it launches.
The full analysis as a PDF for later
We will send you this analysis as a PDF — to print, file away, and read at your own pace. And we will add you to the free Stock Watch list for Realty Income Corporation (O), so you hear about it when something material in this analysis changes.
Frequently Asked Questions
Realty Income Corporation (NYSE: O) is a U.S. real estate investment trust (REIT) based in San Diego. It buys freestanding commercial properties and leases them long term to a single tenant who also pays taxes, insurance and maintenance (net lease). As of June 30, 2026, it had 15,588 properties in the U.S., the U.K. and eight other European countries, 98.8 percent occupied.
Every month. Realty Income calls itself “The Monthly Dividend Company” and, according to its August 5, 2026 earnings release, has declared 673 consecutive monthly dividends since its founding. Per the quarterly report for the period ended June 30, 2026, the monthly dividend was $0.2710, or $3.252 annualized. The quarterly report states that it is not guaranteed.
AFFO (adjusted funds from operations) is net income plus depreciation, adjusted for further non-cash items. For REITs it says more than net income, because buildings are depreciated in the accounts. In 2025, AFFO was $4.28 per share and dividends paid were $3.22. According to the annual report, however, AFFO is not a measure of cash available.
Because growth was largely paid for with new shares. From 2021 to 2025, revenue rose 176 percent and the weighted average share count 120 percent — from 415 million to 911 million, mainly through the VEREIT and Spirit acquisitions and ongoing share sales. AFFO per share rose only 19 percent over the same period.
As of June 30, 2026, Realty Income had about $31.0 billion of debt; net debt stood at 5.4 times annualized pro forma adjusted EBITDAre. Fitch has rated the company A since August 3, 2026. Fixed-rate debt averaging 4.09 percent (2026) and 2.80 percent (2027) is maturing; new bonds cost more.
At the $54.13 close on October 2, 2026, the price-to-AFFO ratio was just over 12 and the dividend yield about 6.0 percent. 2026 guidance calls for about 4 percent growth in AFFO per share. Whether that is cheap depends on the yardstick. Not investment advice.
Found an error?
Did you spot a factual error, an outdated number, or a typo in this deep dive? Let us know briefly — your report goes straight to the editorial team.