Microsoft Stock: Profit Grew 31 Percent — Free Cash Flow Fell
Microsoft earned $133.7 billion in fiscal year 2026, which ended June 30, 2026 — up 31 percent from a year earlier. Free cash flow, the money left after every investment, fell over the same year from $71.6 billion to $67.0 billion. In between sit $115.9 billion of datacenter spending, $329.1 billion of leases that have not even commenced, and an order book that grew 84 percent — but only 25 percent excluding OpenAI's Azure commitments. We read the annual report line by line and worked out what is actually left of this record profit.
 Thomas Mücke
Founder & Publisher
Thomas Mücke
Founder & Publisher
As of Today
As of: September 17, 2026
- Closing price
- 497.80 $ +1.50%
- Market Capitalisation
- 3,632.6 $B
- P/E
- 30.8
- Growth Score
- 7/10
- AAQS
- 10/10
Price change since August 4, 2026: +2.1%
This analysis has a cut-off date. The Stock Guard tells you when something material changes in the numbers. Reserve your free spot
Chart
Interactive price chart (TradingView).
52-week range: 352.80 $ to 542.10 $ · Last price: 497.80 $ (As of: September 17, 2026)
Note: pure fact-based analysis, not investment advice and not a solicitation to buy or sell. All figures without guarantee.
The trap is called familiarity
Let us make a deal. Before we talk about Microsoft, I will admit that I fell into this trap myself — and you probably did too. It is called familiarity, and it works like this: with a company whose name we do not know, we read the annual report with tweezers. With a company whose software we launch every morning, whose stock has risen for forty years and which ranks among the five most valuable businesses on earth, we skim the headline — "record profit" — and put the report down.
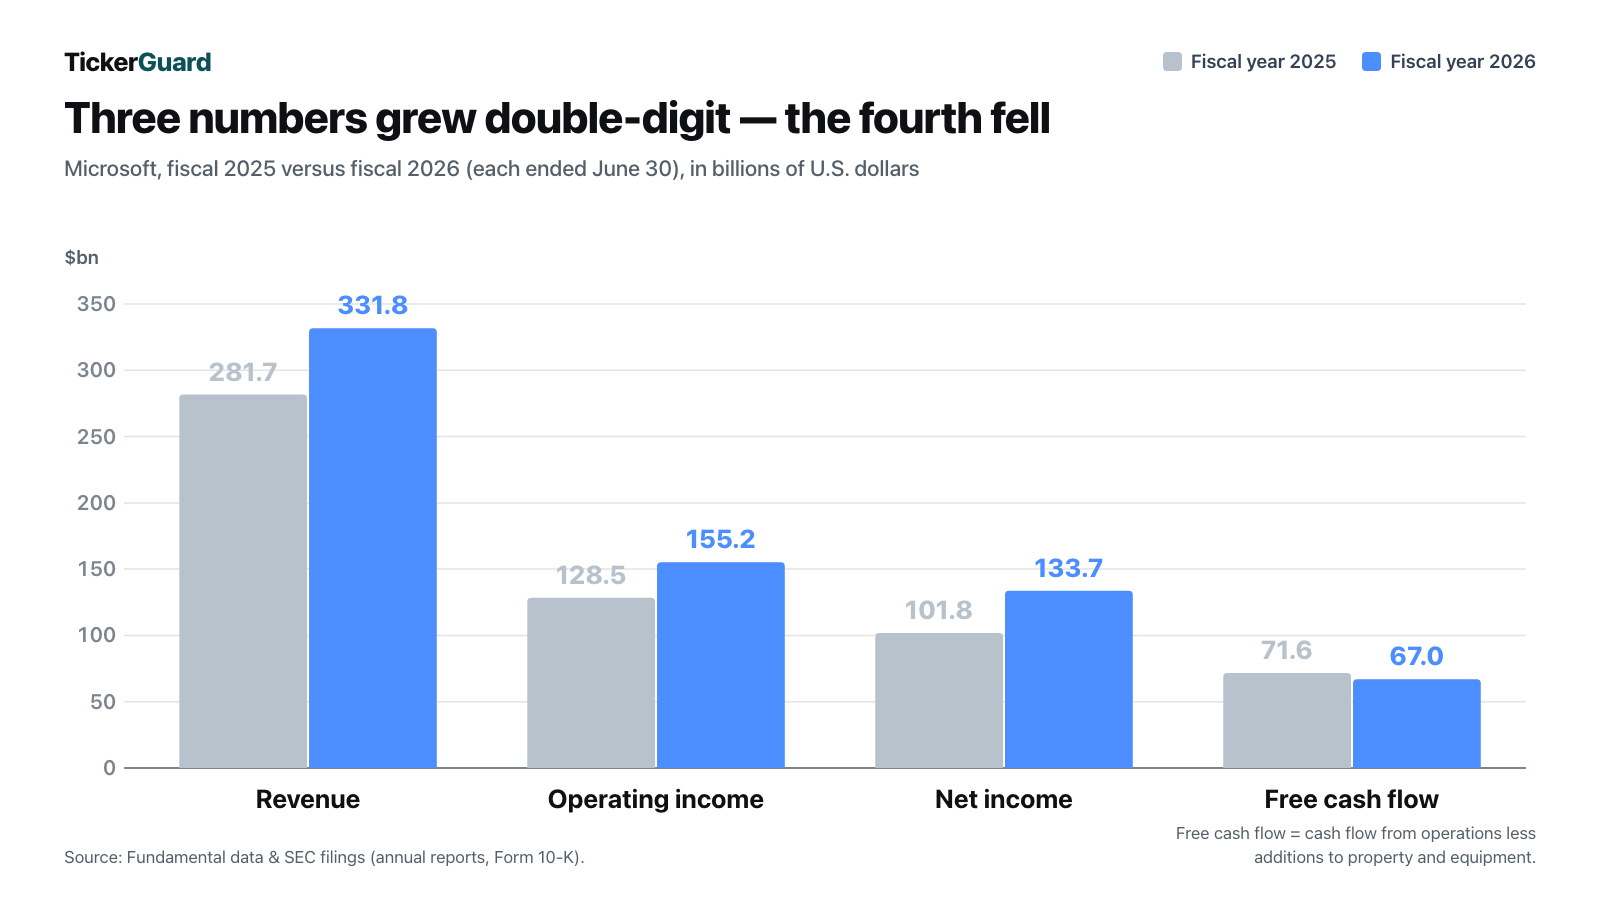
That is exactly where it gets interesting. Because Microsoft's annual report to the U.S. Securities and Exchange Commission contains a headline and a second number nobody puts on the front page. The headline: in fiscal year 2026, which ended June 30, 2026, net income rose 31 percent to $133.7 billion. The second number: free cash flow — the money genuinely left after every investment — fell over the same year from $71.6 billion to $67.0 billion.
Hold on to that tension; it runs through every chapter: Microsoft's profit is growing faster than it has in years — and the money that ends up freely available is shrinking. In between sit datacenters worth hundreds of billions. Let us read together and find out where the difference comes from.
Updated August 9, 2026: this analysis has been moved entirely onto the fiscal 2026 annual accounts. On July 29, 2026 Microsoft filed two documents at once — the annual report (Form 10-K) for the fiscal year ended June 30, 2026, and a current report (Form 8-K) carrying the earnings release for the fourth fiscal quarter. Every figure, chapter, chart and exhibit in this analysis now comes from those two filings; the previous edition rested on the quarterly report as of March 31, 2026. New in this edition: a chapter on the annual results including the accompanying earnings call, plus two findings that did not exist before — $329.1 billion of leases that have not yet commenced, and the first-time disclosure of OpenAI as a related party with $24.1 billion of revenue.
What Microsoft actually does
Microsoft sells three things at its core, and the annual report sorts them into three segments. First, productivity software on subscription: Microsoft 365 with Word, Excel, Teams and Outlook, plus LinkedIn and the Dynamics business software. Second, cloud infrastructure: Azure — rented computing power and storage in Microsoft's datacenters — plus the classic server products. Third, the consumer business: Windows, devices, Xbox and search advertising.
In fiscal year 2026, revenue of $331.8 billion split as follows: Productivity and Business Processes $140.0 billion (up 16 percent), Intelligent Cloud $137.8 billion (up 30 percent), More Personal Computing $54.1 billion (down 1 percent). The largest single product line is server products and cloud services at $129.4 billion (prior year $98.4 billion), followed by Microsoft 365 commercial at $102.0 billion. The consumer business is quietly shrinking: Xbox turned over $21.8 billion against $23.5 billion, and hardware revenue fell 29 percent.
An everyday image for Azure, in case the word cloud still feels vague: instead of putting servers in their own basement, companies rent computing power from Microsoft — much as you can lease a car instead of buying it. You pay for what you use, and Microsoft looks after hardware, power and maintenance. Which is precisely why Microsoft has to pay for the hardware, the power and the buildings first — years before the rental income arrives in full. That is the economic core of this analysis.
Microsoft's fiscal year ends on June 30. "Fiscal year 2026" therefore covers July 2025 through June 2026, not calendar 2026. Comparing Microsoft with Alphabet or other calendar-year reporters shifts everything by six months — an error that appears in comparison tables surprisingly often. For the same reason, the widespread description of the July 29, 2026 filing as "second quarter 2026 results" is wrong: on that day Microsoft presented the annual accounts for fiscal 2026, together with fourth-quarter results (April through June 2026). Every figure in this article comes from the annual report (Form 10-K) filed July 29, 2026 and the earnings release (Form 8-K) of the same day.
How this stock reached our desk
This time it was not a screener hit. Our stock screeners filter on metrics — cheap valuation, high Piotroski score, momentum — and that is precisely why the best-known heavyweights fail systematically: they are rarely cheap. When we counted in July 2026 how many of the 100 largest U.S. stocks by market capitalization already had a deep dive here, 88 had none. Microsoft was the largest of them, ranked fifth at the time.
That is an honest disclosure about our own method: a screener hunting for bargains does not find blue chips. Anyone following only the screeners ends up with a portfolio full of semiconductor laggards and not one of the companies that carry the index. So we are working down the list from the top — starting with the one whose filings offer the most.
The numbers over the years — fairly credited
Let us start with what genuinely impresses. Microsoft grew revenue in fiscal year 2026 (ended June 30, 2026) by 18 percent to $331.8 billion, operating income by 21 percent to $155.2 billion and net income by 31 percent to $133.7 billion. For comparison, the three years before: $281.7 billion of revenue and $101.8 billion of profit in fiscal 2025, $245.1 billion and $88.1 billion in fiscal 2024, $211.9 billion and $72.4 billion in fiscal 2023.
An operating margin of 46.8 percent means, in everyday terms: out of every $100 of revenue, $46.80 remains as operating profit. For scale — a solid industrial company runs at 10 to 15, a very good one at 20. Microsoft is exceptional in this discipline, and has been for years.
The cloud business grew strongly too: Microsoft Cloud reached $214.4 billion (up 27 percent) after $168.9 billion in fiscal 2025 and $137.7 billion in fiscal 2024. Azure alone grew 41 percent — after 34 percent the year before — and passed the $100 billion mark in annual revenue for the first time.
Now the second series of numbers — the same years, but the cash flow statement. This is where the tension becomes fully visible:
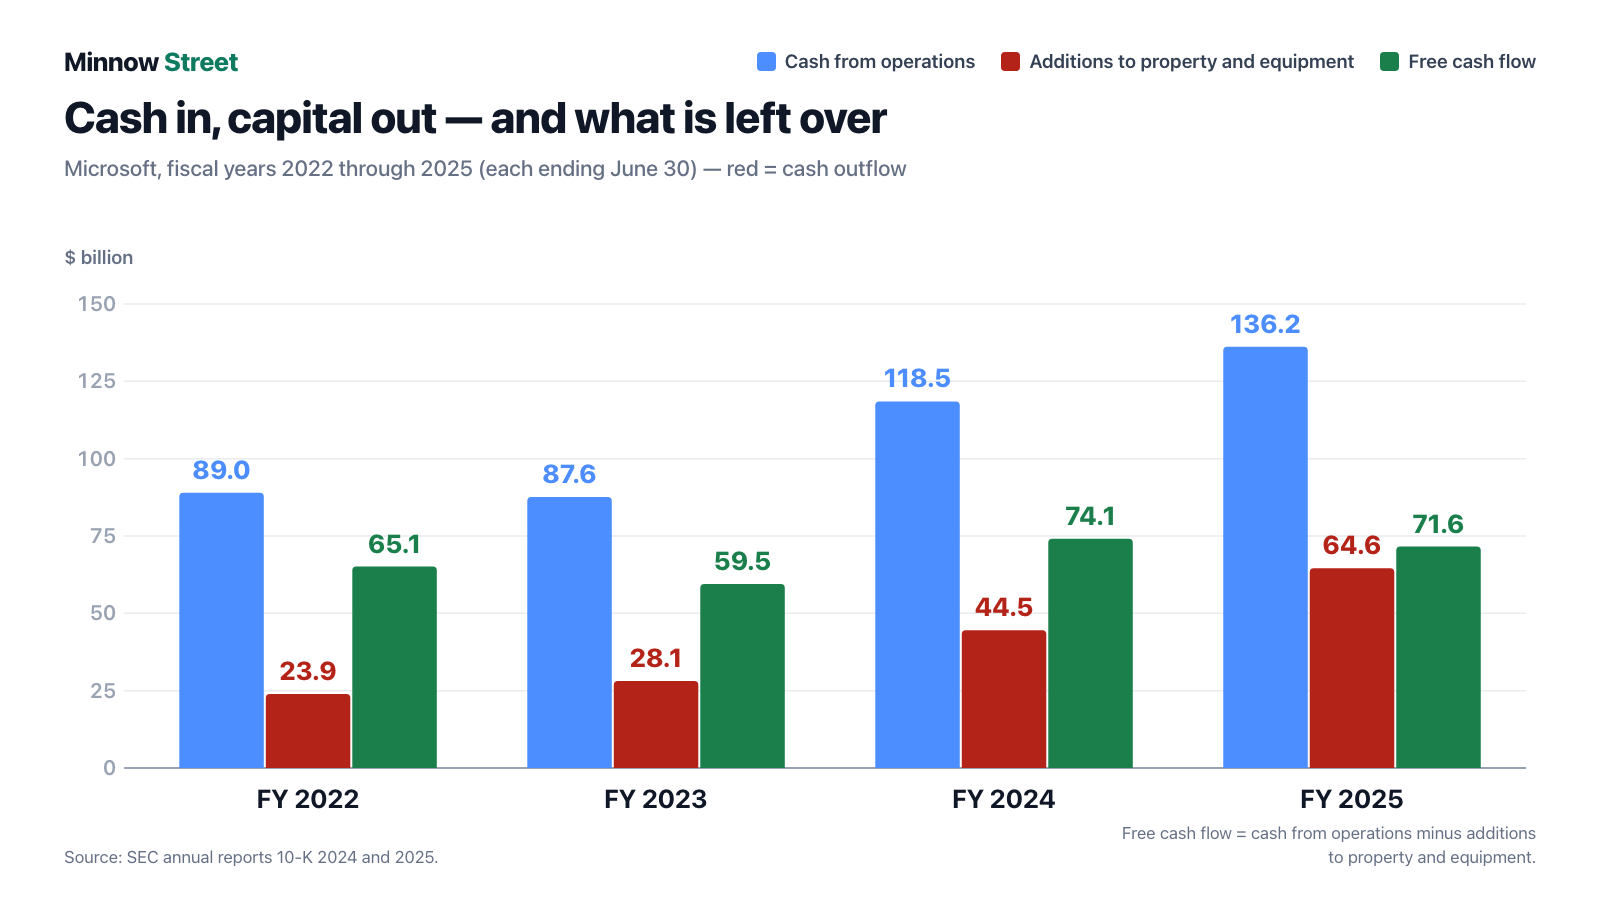
The figures in detail, all from the Forms 10-K for 2024, 2025 and 2026:
| Fiscal year (ended June 30) | Cash flow from operations | Additions to property and equipment | Free cash flow |
|---|---|---|---|
| 2022 | $89.0bn | $23.9bn | $65.1bn |
| 2023 | $87.6bn | $28.1bn | $59.5bn |
| 2024 | $118.5bn | $44.5bn | $74.1bn |
| 2025 | $136.2bn | $64.6bn | $71.6bn |
| 2026 | $182.9bn | $115.9bn | $67.0bn |
Read the last column again from top to bottom. Profit rose 31 percent in fiscal 2026 — free cash flow fell 6.5 percent, for the second year in a row. In proportional terms: in fiscal 2022 investment consumed 27 percent of operating cash flow, in fiscal 2025 it was 47 percent, and in fiscal 2026 it is 63 percent.
What the filings say — the uncomfortable truths
Uncomfortable truth no. 1: $115.9 billion flowed into concrete, servers and cable in one year
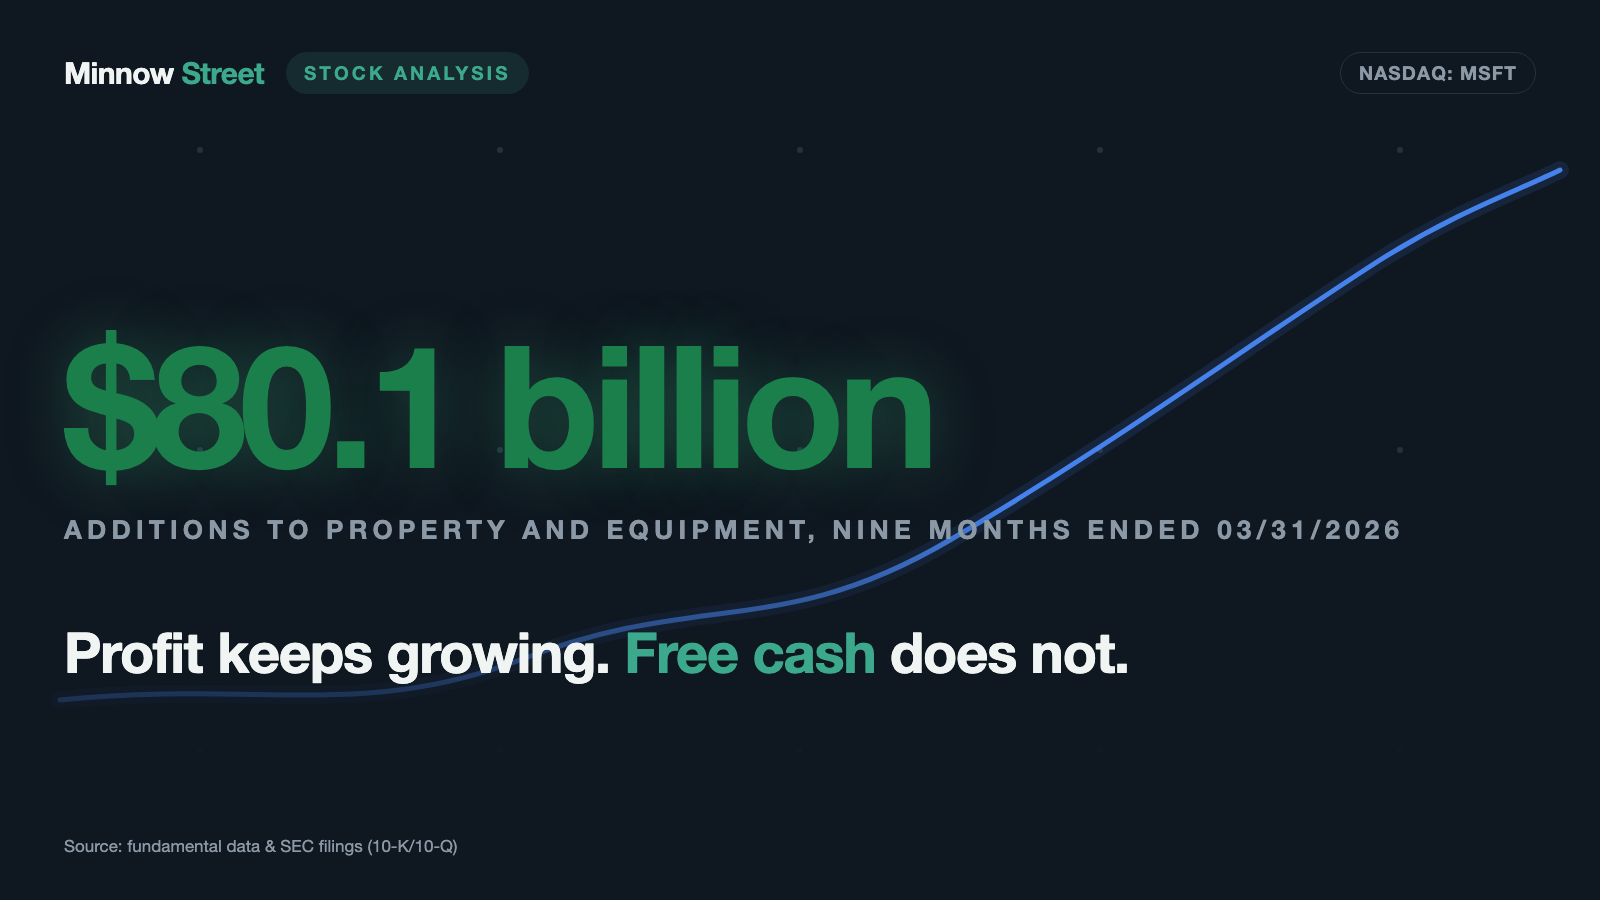
In fiscal year 2026 the pattern did not ease; it intensified. Operations brought in $182.9 billion — an increase of $46.8 billion on the prior year, an excellent result in its own right. At the same time $115.9 billion flowed out into property and equipment; the year before it was $64.6 billion. What remained was $67.0 billion instead of $71.6 billion.
The balance sheet shows where the money went. Property and equipment rose net from $205.0 billion (June 30, 2025) to $313.1 billion (June 30, 2026). In detail, each at cost: "servers, network equipment, and software" grew from $132.8 billion to $215.9 billion, and "buildings and improvements" from $137.9 billion to $182.7 billion. In twelve months, Microsoft capitalised roughly $133 billion of datacenter assets.
One figure from the same note belongs here because it shows that even $115.9 billion understates things: as of June 30, 2026, $26.7 billion of property and equipment purchases had not yet been paid and sat in accounts payable. A year earlier the figure was $6.9 billion. The bill for a substantial part of the 2026 building programme will therefore only pass through cash in fiscal 2027.
Microsoft says itself what this means for margins:
"The investments we are making in cloud and AI infrastructure and devices will continue to increase our operating costs and may decrease our operating margins."
— Microsoft Corporation, SEC Form 10-K for fiscal year 2026, Item 7 (MD&A), section "Economic Conditions, Challenges, and Risks"
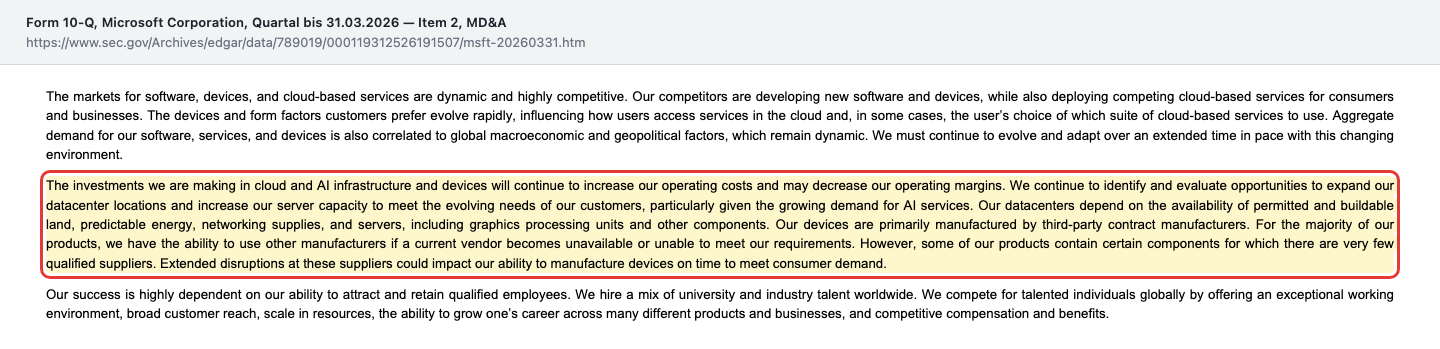
And the warning is no boilerplate — it is already visible in the segment numbers. In Intelligent Cloud, revenue rose 30 percent to $137.8 billion while cost of revenue rose 44 percent to $57.9 billion. Gross margin across the whole cloud business fell to 66 percent. The filing gives the reason verbatim: "continued investments in AI infrastructure and growing AI product usage". Depreciation is picking up too: the depreciation charge on property and equipment rose from $22.0 billion to $34.3 billion, after $15.2 billion in fiscal 2024.
Rule of thumb: growth that has to be built is never free. It appears first in the investment account and only years later in the profit account.
Uncomfortable truth no. 2: nobody earned $5.0 billion of the profit — it is a revaluation
The $133.7 billion of net income is not quite what it looks like. A single line in non-operating income changed sign: "Other income (expense), net" went from minus $4.901 billion to plus $10.697 billion. A $15.6 billion swing in an item that normally collects interest and minor valuation effects.
The notes explain where it comes from: the OpenAI stake delivered $6.5 billion of net gains into that line — the same stake had cost $4.8 billion the year before. After tax, $5.0 billion remains, or $0.67 per share. And the decisive clause sits right beside it: the gains relate "primarily … to the dilution gain from the OpenAI Recapitalization" — they come from a dilution gain.
What that means in plain language: Microsoft's share of OpenAI became smaller through the restructuring — from roughly 27 percent in March 2026 to roughly 25 percent at year end. But because the remaining, smaller stake was valued higher than the old, larger one, an accounting gain arises. Not a single dollar moves. Imagine your share of a community garden shrinking from 27 to 25 percent — while the garden is revalued so far upwards that your smaller share is worth more than your larger one was. On paper you have grown richer. In your wallet nothing has changed.
To be fair: Microsoft does not hide this — quite the opposite. The company sets out its own reconciliation in the same filing and strips the OpenAI effect out. Adjusted net income is $128.8 billion instead of $133.7 billion, the increase 22 percent instead of 31, and adjusted diluted earnings per share $17.28 instead of $17.95. That is a kind of transparency you rarely see — and the reason this truth is uncomfortable rather than alarming. Only: the headlines carried 31 percent, not 22.
A second, smaller one-off belongs here for completeness. According to the earnings release of July 29, 2026, the closing quarter contained a $3.2 billion gain from the investment in Anthropic. Together with lower-than-expected costs for a voluntary retirement programme — partly offset by severance and impairment charges in the Xbox business — this improved the quarterly result by $0.27 per share against the company's own April 2026 guidance.
Uncomfortable truth no. 3: the largest financial obligation is not under debt — and the largest commitment is in no balance sheet line at all
Look up Microsoft's debt and you find a reassuring figure: $40.3 billion of bond debt as of June 30, 2026 — less than the $43.2 billion a year earlier. A company reducing debt while investing furiously. Sounds too good, and it is.
A few notes further on, under "Leases", sits the larger number: $66.6 billion of finance lease liabilities. Twelve months earlier it was $46.2 billion. That is $20.4 billion added in one year, while bond debt fell by $2.9 billion.
A finance lease is economically a purchase in instalments: Microsoft uses the datacenters as if it owned them, carries them as property and equipment ($82.7 billion at cost, after $53.9 billion a year earlier) and pays fixed instalments with interest over many years. Undiscounted, those future payments total $89.7 billion, of which $55.5 billion falls due after fiscal 2031. The weighted average remaining term is 13 years, the weighted average discount rate 4.5 percent. The filing names the effect: interest expense rose to $3.051 billion, "primarily due to higher finance lease interest expense".
And now the sentence that blows the dimensions open in the 2026 annual report. It sits at the end of the same lease note, directly beneath the maturity table:
"As of June 30, 2026, we had additional leases, primarily for datacenters, that had not yet commenced of $329.1 billion, with some arrangements subject to certain contractual conditions being met. These leases will commence between fiscal year 2027 and fiscal year 2033 with lease terms of 1 year to 20 years."
— Microsoft Corporation, SEC Form 10-K for fiscal year 2026, Note 13 "Leases"
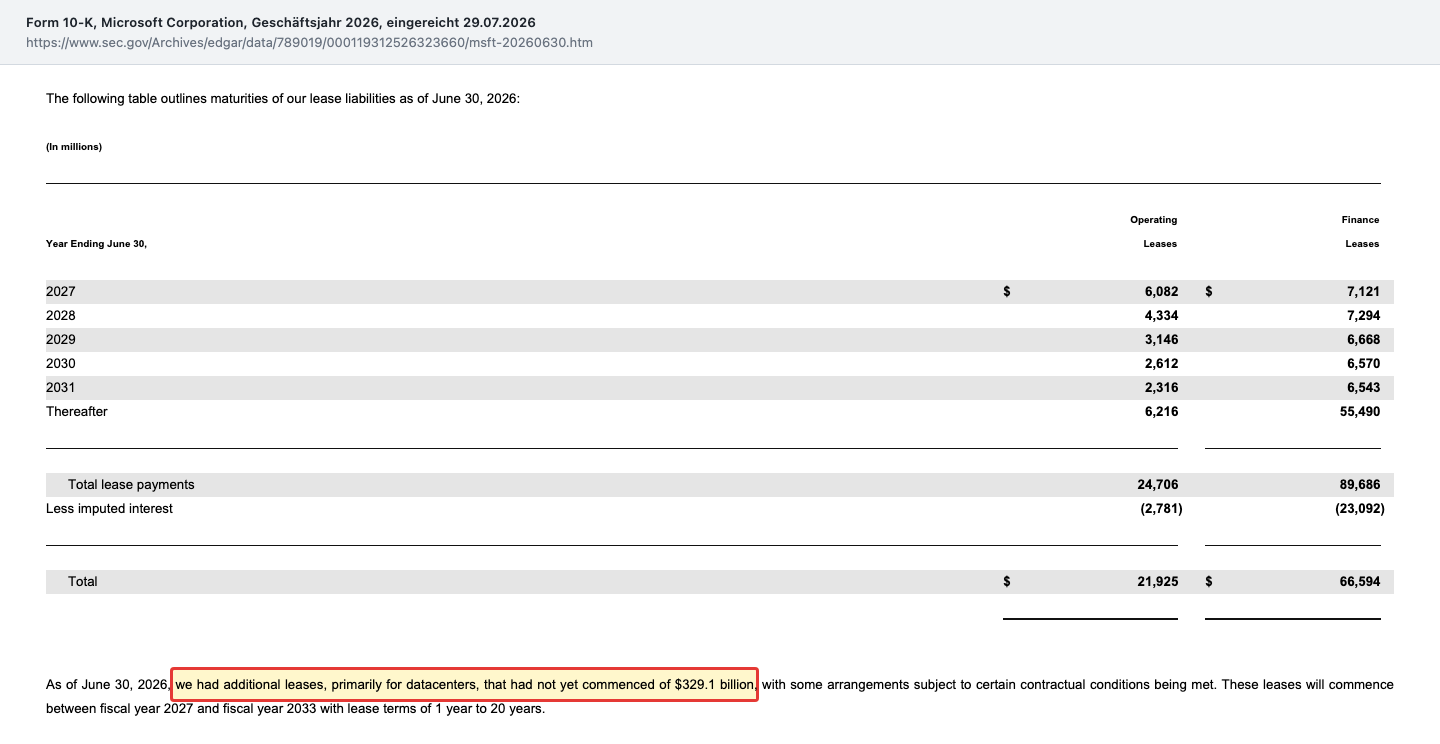
The trajectory of this single disclosure is the real finding. As of June 30, 2025 it read $92.7 billion, as of March 31, 2026 $196.6 billion, and as of June 30, 2026 $329.1 billion. More than tripled in twelve months. For scale: the balance sheet on the same date carries $66.6 billion of finance leases and $21.9 billion of operating leases, $88.5 billion in total. What has not yet commenced is roughly four times everything already recognised — and equals three quarters of total stockholders' equity.
In accounting terms this is entirely correct: a lease is recognised as a right-of-use asset and a liability only when the term begins. Economically they are commitments nonetheless. Add $34.6 billion of construction commitments and $194.1 billion of purchase commitments and the filing reports $743.8 billion of contractual obligations — more than twice annual revenue.
So that this does not land wrongly: for a company with $442.4 billion of equity and $155.2 billion of operating income, an interest burden of $3.1 billion is trivial; interest cover is roughly 51. This is not a leverage problem. It is a perception problem: anyone reading only the line marked "debt" sees $40.3 billion and misses the $66.6 billion one note further on — and the $329.1 billion that will only appear on any balance sheet over the next seven years.
Uncomfortable truth no. 4: the cash pile is shrinking while profit rises
A look at the balance sheet, because it ties the previous points together. Cash and short-term investments fell from $94.6 billion (June 30, 2025) to $76.8 billion (June 30, 2026) — a decline of $17.8 billion in a year in which Microsoft earned $133.7 billion.
The arithmetic becomes clear when you lay the outflows side by side: $115.9 billion of investment in property and equipment, $26.4 billion of dividends paid, $22.3 billion of share repurchases and $3.0 billion of debt repayment — $167.6 billion in total against $182.9 billion of inflow from operations. What the business brings in is impressive; the remaining gap was covered from the securities portfolio, into which funds were simultaneously being reallocated. Also notable is what did not happen: Microsoft issued no new bonds in fiscal 2026 and repaid $3.0 billion.
The headcount is striking too. It fell from roughly 228,000 to roughly 223,000 full-time employees (each as of June 30), of which 121,000 in the U.S. That fits the voluntary retirement programme and the severance costs named in the closing-quarter earnings release. A company that doubles its investment while reducing headcount is shifting its cost base noticeably from people to machines.
Uncomfortable truth no. 5: Microsoft owns a quarter of its own largest customer
This truth is readable for the very first time in the 2026 annual report, and it is the most important change from every earlier filing. The quarterly report as of March 31, 2026 essentially said that Microsoft held roughly 27 percent of OpenAI and booked gains from it. The fiscal 2026 annual report now explicitly classifies OpenAI as a related party under the U.S. accounting standard ASC 850 — and must therefore disclose how much business flows between the two.
"We have an investment accounted for under the equity method that represents an approximate 25% interest on an as-converted basis. As an equity method investee, OpenAI is a related party as defined in Accounting Standards Codification Topic 850, Related Party Disclosures … For fiscal year 2026, we recorded revenue from commercial arrangements with OpenAI, inclusive of revenue-sharing payments, of $24.1 billion, and accounts receivable from OpenAI as of June 30, 2026 was $6.0 billion."
— Microsoft Corporation, SEC Form 10-K for fiscal year 2026, Note 1 "Accounting Policies", Investments section
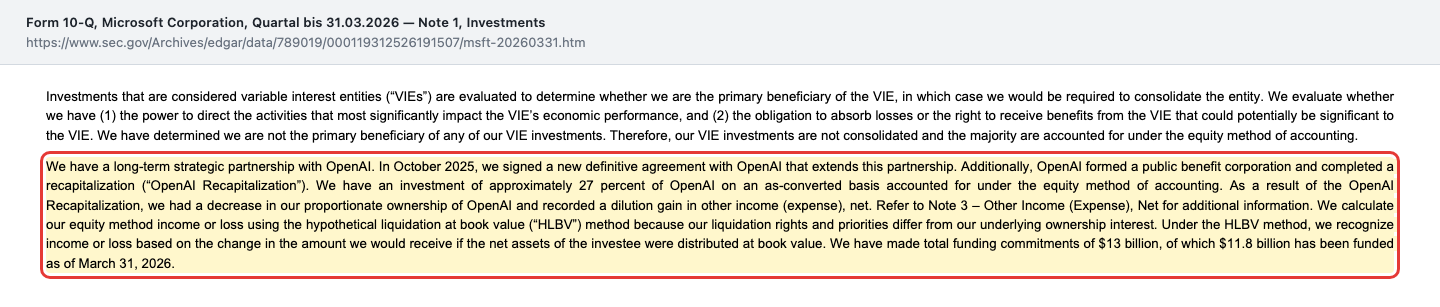
Run the arithmetic: $24.1 billion out of $331.8 billion of group revenue is 7.3 percent — earned with a company in which Microsoft itself holds roughly a quarter, to which it has extended funding commitments of $13.0 billion ($11.9 billion funded), and whose revaluation contributed $5.0 billion to net income in the same year. Add $6.0 billion of outstanding receivables.
This is not an accusation — the structure is disclosed, audited and properly accounted for. It is a concentration risk with feedback: Microsoft invests in OpenAI, OpenAI buys Azure capacity from Microsoft, the resulting revenue justifies more datacenters, and the cost of those datacenters lands in the cash flow statement we read above. As long as OpenAI grows and pays, the loop is a flywheel. Should it stall, it would hit Microsoft in three places at once: revenue, the carrying value of the stake, and utilisation of the new capacity.
Uncomfortable truth no. 6: from fiscal 2027 the measuring stick changes
This truth is not in the annual report but in the transcript of the earnings call of July 29, 2026 — and it affects precisely the metric this entire analysis turns on. CFO Amy Hood announced two changes that work together.
First, from fiscal year 2027 Microsoft is extending the assumed useful life of its datacenters and office buildings from 15 to 25 years. Depreciating a server hall over 25 rather than 15 years charges less to each individual year. Hood herself called the effect on operating income "minimal".
Second — and this is the real point — the same change shifts how future leases are classified. Hood, verbatim:
"The greater impact is on capital expenditures as more of our future datacenter leases will shift from finance leases to operating leases as a result of this update. Finance leases are included in capital expenditures while operating leases are not. Outside of this useful life impact, our calendar year 2026 CapEx investment expectations remain unchanged. However, the shift from finance to operating leases adjusts our expectation to approximately $175 billion."
— Amy Hood, Chief Financial Officer, Microsoft fiscal 2026 fourth-quarter earnings call, July 29, 2026
Translated into plain terms: part of the datacenter commitments moves out of the investment account — not because less is being built, but because the contracts are classified differently. Since free cash flow is calculated as cash flow from operations minus investment, this change will automatically make free cash flow look larger and investment smaller, without anything changing economically in the slightest. Hood says so herself: absent this effect, investment expectations are unchanged.
This is compliant, transparently announced and defensible on the merits — datacenters genuinely last longer than 15 years. For you as a reader it nevertheless means: anyone comparing fiscal 2027 numbers with fiscal 2026 is comparing two different measuring sticks. The improvement in free cash flow that will presumably lead the headlines is, to an unknown degree, a definitional change. The more meaningful figure remains the sum of investment and lease commitments — which is to say precisely the $329.1 billion from truth no. 3, which should now grow faster still.
The cross-check: is this a peak profit that will not repeat?
We ask this in every analysis, and at Microsoft the answer is: partly, yes. Of the $133.7 billion of annual profit, $5.0 billion is a one-off book gain from the OpenAI recapitalisation, plus $3.2 billion from the Anthropic stake in the closing quarter. The adjusted figure of $128.8 billion is the more reliable base.
On the operating side, little suggests a peak: operating margin rose to 46.8 percent (prior year 45.6 percent), growth comes from subscriptions and consumption billing rather than one-time sales, and the order book has never been larger. The more honest risk path runs not through revenue but through depreciation: accumulated depreciation on property and equipment rose from $93.7 billion to $118.7 billion, and the annual depreciation charge from $22.0 billion to $34.3 billion. Every new server hall will weigh on future profits long before it is fully utilised — the useful life extended from 2027 dampens exactly that effect. For the other side of that same equation — the chips Microsoft is installing at scale — see our Nvidia analysis.
The counterweight: $678 billion already ordered
It would be unfair to stop here. Because the same page of the filing carries the number that justifies the whole mountain of investment:
"Commercial remaining performance obligation increased 84% to $678 billion."
— Microsoft Corporation, SEC Form 10-K for fiscal year 2026, Item 7 (MD&A), section "Highlights"

Commercial remaining performance obligation is the commercial order book — revenue already signed but not yet delivered. For scale: $678 billion is more than twice total fiscal 2026 revenue ($331.8 billion). The weighted average duration is roughly 2.3 years, and about 30 percent is expected to be recognised as revenue over the following twelve months. If you wonder why Microsoft builds $115.9 billion in a single year: that is the answer. The capacity is sold before it is built.
Only — and this belongs in the same breath — this figure carries the same feedback loop as truth no. 5. On the earnings call of July 29, 2026, Amy Hood volunteered the cross-check herself: "RPO increased 25% when excluding OpenAI." Excluding OpenAI's Azure commitments, the order book grew 25 percent rather than 84. The same pattern shows in bookings: "Commercial bookings grew 18% when excluding the impact from OpenAI" — including OpenAI it was only 10 percent, because the prior-year period already contained large OpenAI commitments. Both numbers are strong. But the difference between 84 and 25 percent is exactly the difference between a broad wave of demand and one very large order.
Valuation: what you pay for this company
Microsoft was worth roughly $3,713 billion on the market in early August 2026 (data as of August 9, 2026). At earnings per share of $17.95 that gives a price/earnings ratio of roughly 27.9, a price/sales ratio of roughly 11.2 and a price/book ratio of roughly 8.4. Using adjusted earnings of $17.28, the price/earnings ratio is roughly 28.9. For scale: a P/E of 28 sits in the upper-middle range for a company with a 47 percent operating margin and 18 percent revenue growth — clearly above a utility, but below what growth stocks cost in phases of euphoria.
More interesting than the P/E, at Microsoft, is the view on free cash flow. At $67.0 billion in fiscal 2026, the market is currently paying roughly 55 times free cash flow. That is the price of the bet: anyone buying today is paying for the $115.9 billion invested in a single year to come back later as cash flow. A year earlier the same multiple was roughly 40.
The dividend plays almost no part in this valuation: $3.64 per share in fiscal 2026 corresponds to a yield of roughly 0.7 percent. Together with buybacks, $48.7 billion flowed to shareholders — against $67.0 billion of free cash flow that is a payout of roughly 73 percent of the money genuinely available. Two years ago that share was markedly lower.
The professional view is considerably friendlier. Sixty-one estimates produced an average price target of roughly $563 as of August 9, 2026, with 41 "strong buy", 15 "buy", 5 "hold" and no sell recommendation. A chorus without a single dissenting voice is rarely an independent second opinion, though — among the largest index heavyweights it is almost the normal state.
One dated anchor from the filings themselves, because it is more honest than any daily price: Microsoft repurchased 36 million of its own shares for $16.7 billion under the repurchase programme in fiscal 2026 — an average of roughly $464 per share. Of the $60 billion programme, $40.6 billion remained as of June 30, 2026.
Opportunities and risks at a glance
What speaks for Microsoft:
- An order book of $678 billion as of June 30, 2026, up 84 percent — more than twice annual revenue.
- An operating margin of 46.8 percent alongside 18 percent revenue growth; net margin 40.3 percent.
- Azure grew 41 percent in fiscal 2026, after 34 percent the year before, and passed $100 billion of annual revenue for the first time.
- A balance sheet with $442.4 billion of equity, $76.8 billion of liquidity and only $40.3 billion of bond debt, at an interest cover of roughly 51.
- Unusual transparency: Microsoft voluntarily strips its own OpenAI book gain out of earnings and, for the first time, discloses its dealings with OpenAI as a related-party relationship.
- Shareholder returns: $26.4 billion of dividends and $22.3 billion of buybacks in the fiscal year, with $40.6 billion of repurchase authorisation remaining.
What speaks against it:
- Free cash flow fell for the second year running: $67.0 billion after $71.6 billion and, before that, $74.1 billion.
- Investment of $115.9 billion in a single year ties up capital whose return builds only over years; a further $26.7 billion was still unpaid at the reporting date.
- $329.1 billion of leases had not yet commenced as of June 30, 2026 and appear in no balance sheet line — up from $92.7 billion a year earlier.
- Excluding OpenAI's Azure commitments, the order book grew only 25 percent rather than 84; $24.1 billion, or 7.3 percent of group revenue, comes from a company in which Microsoft holds roughly 25 percent.
- Cloud gross margin fell to 66 percent; cost of revenue in Intelligent Cloud rose 44 percent against a 30 percent revenue increase.
- $5.0 billion of annual profit is a one-off, non-cash book gain from the OpenAI dilution, and a further $3.2 billion a valuation gain on the Anthropic stake.
- From fiscal 2027 Microsoft extends the useful life of its datacenters from 15 to 25 years and shifts leases out of the investment account — free cash flow will look better without being better.
The fiscal 2026 results — and what the closing call revealed
On July 29, 2026 Microsoft filed both at once: the annual report (Form 10-K) for the fiscal year ended June 30, 2026, and the earnings release (Form 8-K) for the fourth fiscal quarter, April through June 2026. Anyone who read that day's news as "second quarter 2026 results" was six months out — it was the annual accounts.
The closing quarter in numbers: revenue $90.0 billion (up 18 percent), operating income $40.6 billion (up 18 percent), net income $35.8 billion (up 31 percent), diluted earnings per share $4.81. Adjusted for the OpenAI effects it was $35.3 billion and $4.74, up 22 and 23 percent respectively. Microsoft Cloud reached $59.3 billion for the quarter (up 27 percent), and Azure grew 43 percent — faster than the full-year average.
And the cash flow figures for that same quarter make the point of this analysis exactly. Amy Hood on the call: "Cash flow from operations was $55.4 billion, up 30% … And free cash flow was $19.6 billion reflecting higher capital expenditures." So $55.4 billion of operating inflow became $19.6 billion of free cash — in a single quarter, roughly $35.8 billion flowed into property and equipment.
Satya Nadella described on the same call what it was for: "We added 31 new datacenters across 5 continents this quarter, bringing the total to 88 this year", and further: "All up, we added another gigawatt of capacity this quarter and remain on track to roughly double our overall capacity in just two years." Doubling total computing capacity in two years — that is the physical counterpart of the $329.1 billion from truth no. 3.
On the demand side Nadella reported two solid figures: Azure passed $100 billion of annual revenue for the first time in the fiscal year, and Microsoft 365 Copilot reached over 30 million paid seats, with net seat additions more than doubling against the prior quarter. That is notable because Microsoft had not disclosed this Copilot figure at all for over two years — it reappeared only in 2026, first at 15 million, then over 20 million, and now over 30 million.
The outlook for fiscal 2027 is where this gets concrete for investors. For the first quarter, Hood guided to $89.85 to $90.95 billion of revenue (up 16 to 17 percent) and to roughly 45 percent growth for Azure in constant currency — more again than in the closing quarter. For the full year she announced double-digit revenue and operating income growth, an operating margin "down less than a point", and an effective tax rate of roughly 20 percent.
Two sentences from that outlook deserve particular attention. The first concerns investment: "We expect FY27 capital expenditures will grow year-over-year given demand signals across our portfolio" — for the first quarter alone Hood named "over $50 billion", against roughly $35.8 billion in the quarter just ended. The second is a clause you would hardly expect from a company of this earnings power: "In addition, we expect to remain free cash flow positive in FY27." A business earning $133.7 billion considers it worth mentioning that anything will be left over at all. That is what this analysis is about.
On whether capacity will ever be sufficient, Hood stuck to the answer she has given for quarters: "there are still constraints in the system. I think we've continued to say, I think now, for a number of quarters, that demand continues to exceed available supply, and that certainly remains true." Asked what would happen in a demand slump, she offered an argument worth knowing: a growing share of investment now goes into short-lived assets — CPUs and GPUs with relatively short lead times. If conditions turn, that largest cost block can simply be slowed. This is plausible; it does not, however, apply to buildings, power and the $329.1 billion of leases running up to twenty years.
What the conference calls reveal
We have read the eleven transcripts of Microsoft's quarterly calls from fiscal 2024 Q2 to fiscal 2026 Q4. All quarter references are fiscal quarters; Microsoft's fiscal year ends in June. We were less interested in the quarterly result than in the question of what management announces and how much of it actually arrives in later calls. The picture is split: the earnings guidance is delivered, the planning commitments are not — and the metrics that would let outsiders test the AI business appear and disappear rather than forming a continuous series.
First the credit side, because it is strong. The commitment given on the FY24 Q4 call that Azure growth would accelerate in the second half of fiscal 2025 was honoured: 34 and 31 percent in the first half became 35 and 39 percent in the second. The margin announced for fiscal 2025 — "only about a point" lower — was not merely held but beaten. Since FY26 Q1, Azure has come in above the company's own guidance every quarter; in the closing quarter, FY26 Q4, it was 43 percent. Weaknesses are named rather than avoided, too: on the FY25 Q2 call, CFO Amy Hood openly acknowledged sales execution problems in the indirect channel and confirmed on the FY25 Q3 call that the repair was not yet complete.
The dated planning commitments look different. Two were broken, and neither has been made good:
- On the FY25 Q2 call, management committed to AI compute capacity being roughly in balance with demand by the end of fiscal 2025. That became "beyond June" (FY25 Q3), then December (FY25 Q4), then fiscal year end (FY26 Q1) and most recently "at least through the end of 2026" (FY26 Q3). Amy Hood on the FY25 Q4 call: "I thought we'd be in better supply demand shape by June. And now I'm saying I hope I'm in better shape by December." A quarter later: "I thought we were going to catch up, we are not." On the FY26 Q4 closing call the position was unchanged: demand continues to exceed available supply.
- Also on the FY25 Q2 call, it was announced that investment would grow more slowly in fiscal 2026 than in the prior year. The statement was confirmed verbatim in FY25 Q3, reaffirmed in FY25 Q4 — and reversed in FY26 Q1. In the event, investment rose in fiscal 2026 from $64.6 billion to $115.9 billion, an increase of 80 percent. For fiscal 2027, Hood announced a further increase on the closing call.
In both cases the justification is the same and plausible: demand is growing faster than expected. For investors the lesson stands nonetheless — figures from this company's multi-year planning currently hold for only a few months. We find the second finding less comfortable: the disappearance of metrics. From FY24 Q2 to FY25 Q3, Microsoft stated in every call how many points of Azure growth came from AI services — 6, 7, 8, roughly 12, 13 and finally 16. From FY25 Q4 the disclosure was dropped without replacement, foreshadowed a quarter earlier in FY25 Q3 with the line: "It's getting harder and harder to separate what an AI workload is from a non-AI workload." AI revenue on an annual run rate was announced in FY25 Q1 for the following quarter at $10 billion, quantified in FY25 Q2 at $13 billion, then not mentioned at all for four quarters, and picked up again only in FY26 Q3 at $37 billion. The calls give no support for the idea that weak numbers were being buried — both disclosures ended on their respective highest values. What is missing is the continuous yardstick. The same applies to the simple question of how many Microsoft 365 Copilot seats are paid for: it went without an absolute number from FY24 Q2 to FY26 Q1; the first hard figure came in FY26 Q2 at 15 million, then over 20 million in FY26 Q3 and over 30 million in FY26 Q4.
The FY26 Q4 closing call added a new item to this list — with the opposite sign, however. For the first time, Amy Hood volunteered the cross-check on the order book: 84 percent growth with OpenAI, 25 percent without. That very figure had been missing from earlier calls, even though on the FY26 Q2 call roughly 45 percent of the then $625 billion order book was attributable to a single partner. At the time, Hood pointed to the other 55 percent and called the partnership durable, without addressing the risk of the partner itself. That she now supplies the split unprompted is progress in disclosure — and simultaneously confirmation that the question was justified.
Our reading: anyone buying Microsoft is buying a company that keeps its quarterly promises and tends to beat its own earnings targets. They must, however, accept that multi-year investment planning is currently not reliable, that the measures change from fiscal 2027, and that a substantial part of order growth hangs on a single partner.
A human conclusion
Remember the familiarity trap from the opening? At Microsoft it has a particular twist. Read the filing properly and you do not find the hidden catastrophe such analyses sometimes lead you to expect. You find an exceptionally profitable company that reports unusually honestly — down to a voluntary reconciliation that talks its own profit down, and a disclosure that names its largest customer as a related party.
What you also find is a shift that gets no headline. Four years ago, Microsoft kept roughly 73 cents of every dollar taken in from operations as free money. In fiscal 2025 it was 53 cents; in fiscal 2026, 37 cents. The rest goes into buildings, servers, cable and lease instalments — and into a further $329.1 billion of leases that have not even commenced. Whether that turns out to be a magnificent investment or one described in five years as overbuild will not be settled at the profit line — but by whether the $678 billion of ordered revenue is actually delivered and paid for. And by who ordered it.
That is precisely the question you have to answer for yourself, and nobody can take it off your hands. If you believe the capacity will be fully utilised in five years at today's margins, you are buying one of the best companies in the world at a price that is not historically absurd. If you doubt it, you see a company letting its profit grow while the money left over shrinks — and which will measure with a different stick from next fiscal year. Both readings sit in the same document. What you make of it is your decision. And that is exactly as it should be.
Sources
- Microsoft Corporation, SEC Form 10-K for fiscal year 2026 (filed July 29, 2026, accession 0001193125-26-323660) — Item 1 (Business, headcount), Item 7 (MD&A) including the non-GAAP reconciliation and contractual obligations, income statement, balance sheet, cash flow statement, Note 1 (Accounting Policies / OpenAI as a related party), Note 3 (Other Income), Note 6 (Property and Equipment), Note 10 (Debt), Note 13 (Leases), Note 15 (Stockholders’ Equity), Note 18 (Segment Information)
- Microsoft Corporation, SEC Form 8-K of July 29, 2026, Items 2.02 and 9.01 (accession 0001193125-26-323632) carrying the earnings release as Exhibit 99.1 — fiscal 2026 fourth-quarter figures, the Anthropic book gain, and statements by Satya Nadella and Amy Hood
- Microsoft Corporation, SEC Form 10-Q as of March 31, 2026 (filed April 29, 2026) — interim values for the trajectory of leases not yet commenced and of the OpenAI stake
- Microsoft Corporation, SEC Form 10-K for fiscal year 2025 (filed July 30, 2025) — comparatives for fiscal years 2022 through 2025
- SEC EDGAR, filing index for Microsoft Corporation (CIK 0000789019) — every filing dated on or after July 29, 2026 was reviewed; after the annual report and earnings release of that day, only proposed-sale notices (Form 144) and insider reports (Form 4) followed through August 9, 2026, none of which changes the numbers
- Transcript of the Microsoft fiscal 2026 fourth-quarter earnings call, July 29, 2026 (Microsoft Investor Relations) — statements by Satya Nadella and Amy Hood on capacity, investment, the order book excluding OpenAI, the useful life change and the fiscal 2027 outlook; supplemented by the transcripts of the FY24 Q2 through FY26 Q3 calls (fiscal quarters)
- Fundamental data (market capitalization, valuation metrics, analyst consensus), data as of August 9, 2026
This analysis is journalistic commentary on publicly available information and is not investment advice. It is not a solicitation to buy or sell securities. Shares can lose value substantially, up to the total loss of the capital invested. All figures come from the sources named and carry their respective cut-off dates; filings published after our editorial deadline are not reflected. Positions held by the operator are disclosed daily; where one exists, it appears as a notice at the top of this deep dive.
Key figures at a glance
All monetary figures in millions of $; earnings per share as reported.
| Metric | 2022 | 2023 | 2024 | 2025 | 2026 |
|---|---|---|---|---|---|
| Revenue | 198,270.0 | 211,915.0 | 245,122.0 | 281,724.0 | 331,839.0 |
| Operating Income (EBIT) | 83,383.0 | 88,523.0 | 109,433.0 | 128,528.0 | 155,237.0 |
| Net Income | 72,738.0 | 72,361.0 | 88,136.0 | 101,832.0 | 133,749.0 |
| Net Margin | 36.7% | 34.1% | 36.0% | 36.1% | 40.3% |
| Earnings Per Share | 9.65 $ | 9.68 $ | 11.80 $ | 13.64 $ | 17.95 $ |
Source: fundamental data & SEC filings (annual and quarterly reports, 10-K/10-Q)
Our Bottom Line at a Glance
- Demand and market position positive
- Commercial remaining performance obligation rose 84 percent to $678 billion as of June 30, 2026; Azure grew 41 percent for the year and passed $100 billion of annual revenue for the first time; Microsoft Cloud reached $214.4 billion, up 27 percent. One qualification: excluding OpenAI's Azure commitments, the order book grew only 25 percent (Form 10-K 2026, earnings call of July 29, 2026).
- Earnings power positive
- Operating margin of 46.8 percent in fiscal year 2026 (prior year 45.6 percent), net margin 40.3 percent, return on equity roughly 34 percent (data as of August 9, 2026). Even after stripping out the OpenAI book gain, $128.8 billion of profit remains for the year.
- Cash flow after investment negative
- Free cash flow fell in fiscal year 2026 from $71.6 billion to $67.0 billion even though net income rose 31 percent — the second decline in a row. The cause is additions to property and equipment (FY 2025: $64.6 billion; FY 2026: $115.9 billion). Of every dollar taken in from operations, 37 cents stayed free; in fiscal 2022 it was 73 cents.
- Earnings quality neutral
- $5.0 billion of the $133.7 billion of fiscal 2026 net income is a non-cash book gain from the dilution of the OpenAI stake. Microsoft discloses it transparently and strips it out itself — the adjusted increase is 22 percent rather than 31 (Form 10-K 2026, section Non-GAAP Financial Measures).
- Balance sheet and debt positive
- Stockholders' equity $442.4 billion, cash and short-term investments $76.8 billion, bond debt $40.3 billion as of June 30, 2026. Even including $66.6 billion of finance leases, leverage stays low relative to earnings power; interest expense of $3.1 billion sits against $155.2 billion of operating income, an interest cover of roughly 51.
- Off-balance-sheet commitments negative
- As of June 30, 2026, $329.1 billion of leases had not yet commenced — up from $92.7 billion a year earlier. That is roughly four times all recognised lease liabilities combined ($88.5 billion). Together with construction and purchase commitments, the filing reports $743.8 billion of contractual obligations (Form 10-K 2026, Note 13 and Item 7).
Microsoft remains one of the most profitable companies in the world: a 46.8 percent operating margin in fiscal year 2026, an order book of $678 billion and a cloud business that grew 27 percent to $214.4 billion. The price sits in the same cash flow statement: $115.9 billion of investment in a single year, free cash flow down for the second year running, and $329.1 billion of leases that have not even commenced. Add a $5.0 billion book gain from the OpenAI dilution that Microsoft strips out itself, and an order book whose growth falls from 84 to 25 percent once OpenAI is excluded. Not investment advice.
What Our Rating Means
Quality confirmed
Business model, numbers and balance sheet hold up to our review. Whether the current price supports an entry is a separate question — it hangs on the price, not on the company.
Company quality is documented: a profitable, high-margin core business, $442.4 billion of stockholders' equity, $76.8 billion of liquidity, interest cover of roughly 51, no accounting or governance breach, and unusually transparent reporting — Microsoft voluntarily strips out its own OpenAI book gain and, from fiscal 2026, discloses its dealings with OpenAI as a related-party relationship. Anyone buying in is nevertheless betting that the $115.9 billion invested in a single year will return later as cash flow; until then profit grows while the money actually left over shrinks. What you make of that is your decision.
A journalistic assessment by our editorial team at the time of the deep dive, based on public sources — not investment advice and not a solicitation to buy or sell. Your personal circumstances (investment goals, risk capacity, taxes) cannot be taken into account. What our levels mean, how verdicts are formed, and what conflicts of interest exist →
Worth Noting
- Origin of the first edition: ranking of the 100 largest U.S. stocks by market capitalization (as of July 28, 2026); Microsoft ranked fifth and had no analysis yet.
- Data basis: annual and balance sheet figures from the Form 10-K for fiscal year 2026 (filed July 29, 2026, accession 0001193125-26-323660); quarterly figures and the Anthropic book gain from the earnings release on Form 8-K of July 29, 2026 (accession 0001193125-26-323632, Exhibit 99.1); management statements from the transcript of the earnings call of July 29, 2026; valuation metrics as of August 9, 2026.
- Easily confused: Microsoft's fiscal year ends June 30. "Fiscal year 2026" means July 2025 through June 2026 — not calendar 2026. The filing of July 29, 2026 is therefore an annual report with a closing quarter, not a "second quarter 2026" report.
- Analyses are evergreen; a daily share price is not a reason to buy.
Stock Watch
This analysis is as of August 26, 2026. Stock Watch will tell you what's changed at MSFT since then.
Later $1 a month per stock — signing up is free, and you'll be the first to know when it launches.
The full analysis as a PDF for later
We will send you this analysis as a PDF — to print, file away, and read at your own pace. And we will add you to the free Stock Watch list for Microsoft Corporation (MSFT), so you hear about it when something material in this analysis changes.
Frequently Asked Questions
Two documents at once. First, the annual report (Form 10-K) for fiscal year 2026, which ended June 30, 2026; second, a current report (Form 8-K) carrying the earnings release for the fourth fiscal quarter, April through June 2026. It was explicitly not a "second quarter 2026" report: Microsoft's fiscal year ends June 30, so April through June 2026 was the closing quarter of fiscal 2026, not the second quarter of a calendar year.
Microsoft reports in three segments. In fiscal year 2026, Productivity and Business Processes (Microsoft 365, LinkedIn, Dynamics) delivered $140.0 billion of revenue, Intelligent Cloud (Azure, server products) $137.8 billion and More Personal Computing (Windows, devices, Xbox, search advertising) $54.1 billion. The largest single product line is server products and cloud services at $129.4 billion, followed by Microsoft 365 commercial at $102.0 billion.
Because investment is rising faster than operating cash flow. In fiscal year 2026, $182.9 billion came in from operations (prior year $136.2 billion) while $115.9 billion went out into property and equipment (prior year $64.6 billion). What was left was $67.0 billion instead of $71.6 billion — a decline of 6.5 percent alongside 31 percent profit growth. On top of that, $26.7 billion of property and equipment purchases were still unpaid at the reporting date (prior year $6.9 billion).
Roughly 25 percent on an as-converted basis, accounted for under the equity method; in the quarterly report as of March 31, 2026 it was still roughly 27 percent. Microsoft has made funding commitments of $13.0 billion in total, of which $11.9 billion had been funded as of June 30, 2026. New in the fiscal 2026 annual report: Microsoft identifies OpenAI as a related party and discloses $24.1 billion of revenue from commercial arrangements with OpenAI, plus $6.0 billion of receivables.
It is the commercial order book: revenue already contracted but not yet recognised. As of June 30, 2026 it stood at $678 billion, 84 percent higher than a year earlier, with a weighted average duration of roughly 2.3 years; about 30 percent is expected to be recognised as revenue over the following twelve months. One qualification matters: excluding OpenAI's Azure commitments, the same order book grew only 25 percent, according to the earnings call of July 29, 2026.
Bond debt stood at $40.3 billion as of June 30, 2026, down from $43.2 billion a year earlier. Larger are the finance lease liabilities behind the datacenters: $66.6 billion, up from $46.2 billion. Add $21.9 billion of operating leases and $329.1 billion of leases that have not yet commenced and therefore appear in no balance sheet line. Against that stand $76.8 billion of cash and short-term investments and $442.4 billion of stockholders' equity.
41 percent in fiscal year 2026 and 43 percent in the closing quarter, each against the prior-year period; in fiscal 2025 it was 34 percent. Azure passed $100 billion of annual revenue for the first time. For the first quarter of fiscal 2027 management guided to roughly 45 percent growth. At the same time, Microsoft Cloud gross margin fell to 66 percent; the filing attributes this to investment in AI infrastructure.
Yes. In fiscal year 2026 the board declared $0.91 per share four times, $3.64 in total or $27.0 billion. $26.4 billion was paid during the fiscal year, alongside $22.3 billion of share repurchases. The most recently declared quarterly dividend dates from June 10, 2026 and is payable September 10, 2026. Of the $60 billion repurchase program, $40.6 billion remained as of June 30, 2026.
Found an error?
Did you spot a factual error, an outdated number, or a typo in this deep dive? Let us know briefly — your report goes straight to the editorial team.