Micron: 86.8% Margin in a Record Quarter — and the First Margin Guide-Down Since March 2025
Our value scanner finds Micron cheap — which is exactly what makes us suspicious. In the fourth quarter (through September 3, 2026) the memory-chip giant posted $54.2 billion in revenue at an 86.8 percent gross margin; but a third of the growth over the prior quarter is an extra calendar week, and for the next quarter management guides to a slightly lower margin for the first time since March 2025. Not investment advice — just an attempt to tell a ruler from a roller coaster.
 Thomas Mücke
Founder & Publisher
As of Today
As of: October 30, 2026
- Closing price
- 884.70 $ -5.30%
- Market Capitalisation
- 1,149.3 $B
- P/E
- 18.4
- Growth Score
- 9/10
- AAQS
- 8/10
Price change since September 29, 2026: -16.9%
This analysis has a cut-off date. The Stock Guard tells you when something material changes in the numbers. Reserve your free spot

Chart
Interactive price chart (TradingView).
52-week range: 201.40 $ to 1,213.60 $ · Last price: 884.70 $ (As of: October 30, 2026)
Note: pure fact-based analysis, not investment advice and not a solicitation to buy or sell. All figures without guarantee.
Updated on September 30, 2026 with the annual results: on that day Micron reported its results for the fourth quarter and for the fiscal year that ended on September 3, 2026. Figures, valuation, balance sheet and outlook reflect that state; the chapter "Update of September 30, 2026" puts the quarter in context, and the prepared remarks for the earnings call held that evening are evaluated there and in the earnings-call chapter. The full annual report (10-K) for the year had not been filed as of October 1, 2026; statements from the prior-year report therefore carry their date. The earnings-call chapter was added on August 2, 2026.
There is a tool every investor always carries and almost always uses wrong: the ruler in the head. You see three points climbing steeply, lay the ruler against them — and extend the line into the future. Psychologists call it extrapolation; on the stock market it usually goes by "this time it's different". In 2026, hardly any stock invites the mental ruler as much as Micron Technology (Nasdaq: MU), one of the world's three big memory-chip makers: $133.2 billion in revenue and $85.0 billion in net income in the fiscal year ended September 3, 2026 — after $37.4 billion in revenue the year before —, with $54.2 billion in revenue at an 86.8 percent gross margin in the fourth quarter alone. Numbers Micron has never reported in its history. And this time the impulse doesn't even come from a hot tip but from a serious tool: our in-house stock scanner for Joel Greenblatt's Magic Formula — a value filter, not a warning system — lists Micron among its hits. Quality at a fair price, says the formula. So let's make a deal: before you lay down the ruler, we read together what Micron itself reported to the U.S. securities regulator, the SEC — in the annual report (10-K, the yearly mandatory filing) and in the quarterly reports (10-Q). False statements in an SEC filing carry legal penalties. And this one contains a sentence about the past five years of memory prices that makes the ruler look rather old. In the end, you decide for yourself.
What Micron actually does
If the processor is a computer's brain, then Micron sells the memory: DRAM is the working memory — lightning-fast, but forgetful the moment the power goes; in fiscal year 2025 it stood for $28.6 of $37.4 billion in revenue, a good three quarters. NAND is the long-term memory — the storage cells in SSDs and smartphones that remember even without power ($8.5 billion in revenue). And then there is the product everything in the AI boom revolves around: HBM, "High-Bandwidth Memory" — DRAM chips stacked like a high-rise and mounted right next to the AI processor so the data doesn't have to commute. Every big AI accelerator needs this turbo memory, and only three companies in the world can build it at scale: Samsung, SK hynix — and Micron, the only one of them headquartered in the United States (Boise, Idaho, about 53,000 employees per the annual report as of August 28, 2025, plants from Taiwan via Singapore and Japan to Virginia).
So much for the story. Now the property that explains everything else in this analysis: memory chips — unlike processors — are largely commodity goods. A gigabyte of DRAM from Micron does the same as one from Samsung. Memory is the wheat harvest of the digital economy: the price is set not by the maker but by the balance of supply and demand — and because new fabs take years to build and then deliver all at once, that balance has swung in brutal cycles for decades. Remember this central tension, it is the connecting thread: Micron is living the best year of its history — and the market prices it as if this best year were the new normal. One important detail for all figures in this text: Micron has an offset fiscal year ending in late August/early September. "Fiscal year 2026" thus means: August 29, 2025 through September 3, 2026. It exceptionally had 53 weeks instead of 52, and the extra week sits in the fourth quarter (14 weeks instead of 13) — that will matter when comparing quarters.
Company history for investors
-
2023
China's CAC bans Micron products for critical infrastructure
Part of the China business disappears while Beijing builds its own memory makers — a lasting risk to revenue and prices.
-
2023
Fiscal year with a minus 9 percent gross margin
Micron sells below manufacturing cost and loses $5.8 billion — the trough of the last memory cycle.
-
2025
Record year with $37.4 billion in revenue
The AI upswing begins: $8.5 billion in profit and, for the first time, several billion dollars of HBM revenue.
-
2026
Take-or-pay contracts with price floors
For the first time, large customers commit to volumes for years and place billions in deposits — Micron's argument against the old cycle.
-
2026
Leadership reshuffle (August 26)
Manish Bhatia, until then head of Global Operations, becomes President and COO, technology chief Scott DeBoer also becomes a President.
-
2026
Fiscal year with $133.2 billion in revenue
Profit rises tenfold to $85.0 billion; for the following quarter Micron guides to a slightly lower margin for the first time since March 2025.
Where the stock shows up in our scanner
Every day we run about 3,500 stocks through our scanners. When we wrote this analysis in July 2026, Micron lit up in 6 scanners (data as of July 8, 2026) — and not a single warning scanner was among them. As of September 30, 2026, nothing fundamental has changed: the stock is still in the Magic Formula, additionally in growth screens such as "Top High-Growth Stocks" and "Jim Roppel: 20/20 Screen", and still in no warning scanner. The most interesting hit is the Magic Formula of value investor Joel Greenblatt. His idea, in plain words: buy good companies at a fair price — measured by exactly two numbers. First, the return on capital: how much operating profit comes out per dollar of working capital employed? Second, the earnings yield: how much operating profit do I get per dollar of enterprise value? Micron shines in both disciplines — the operating margin was 74.6 percent in fiscal year 2026 and 80.7 percent in the fourth quarter alone, which is why the stock also sits in our EBIT-margin ranking. Add hits in the scanners "Quality Stocks", "Buffett criteria", "Martin Zweig: Growth with Reason" and the Levermann ranking. Half a dozen seals of quality at once — sounds like an open-and-shut case.

Before you reach for the ruler, you need to know the best-known weakness of this formula — Greenblatt himself never concealed it: with cyclicals, the Magic Formula preferentially fires at the earnings peak. The formula computes with the most recently reported profits. When a memory maker is collecting record prices, return on capital and earnings yield look fantastic — not because the company suddenly got better, but because the cycle stands at its top. When the cycle turns, both metrics vanish as fast as they came. A cyclical typically looks cheapest at the peak. The remaining metrics carry the same double face: the Piotroski F-Score, a nine-point test of balance-sheet quality, stands at a solid 6 of 9 — okay, not outstanding. The Altman Z-Score, a classic early warning of insolvency, sits at a thoroughly healthy 11.7 (danger begins below 1.1) — insolvency really is not the issue here (both values: data as of July 2026). And the relative strength of 99 (master data as of July 2026) already said back then: hardly any stock in the market had run better over the preceding twelve months. Since then the climb has continued: from the close on September 30, 2025 ($167.32) to September 29, 2026 ($1,065.10), the stock gained about 537 percent. This is not an overlooked value gem. This is the star of the market, waved through by a value filter because of its record profits.
The numbers over the years — honestly appraised
First, what genuinely impresses — and here that is a lot. The number series of fiscal year 2026 (August 29, 2025 through September 3, 2026) reads like a rocket launch: revenue of $13.6 billion in the first quarter (through November 27, 2025), $23.9 billion in the second (through February 26, 2026), $41.5 billion in the third (through May 28, 2026) and $54.2 billion in the fourth (through September 3, 2026) — four times the first quarter and almost five times the prior-year quarter ($11.3 billion). The gross margin climbed over the same span from 56.0 via 74.4 and 84.6 to 86.8 percent — for context: a software company would be content with that, and for Micron itself it is a multiple of earlier years — in the record year 2022, the gross margin was about 45 percent. For the full year the books show $133.2 billion in revenue (prior year: $37.4 billion), $85.0 billion in net income (prior year: $8.5 billion), an 80.7 percent gross margin and $89.7 billion in operating cash flow; after net capital expenditures of $27.4 billion, adjusted free cash flow came to $62.3 billion (earnings release of September 30, 2026). The driver already stood in the very first sentence of the management discussion in the quarterly report as of May 28, 2026: "AI-driven memory and storage growth is outpacing industry supply." Per that report, the AI companies' data centers were buying faster than the industry could build; Micron was actively rationing the scarce goods ("supply allocation") and with the windfall has, in passing, repaid $10.0 billion of debt during the fiscal year. What remains of the debt load: $5.2 billion — against $73.5 billion in cash, securities and restricted cash (September 3, 2026). Equity grew from $54.2 billion to $138.4 billion within a single year.

And now the same company, just three years earlier. Fiscal year 2023 (through August 31, 2023): revenue of $15.5 billion — a gross margin of minus 9 percent, meaning Micron sold its chips below manufacturing cost — and a net result of minus $5.8 billion. One year before that, in fiscal year 2022: $30.8 billion in revenue, a gross margin of about 45 percent and $8.7 billion in profit. From record to loss and back, this market needed only twelve months each way. Exactly this roller coaster is what the next picture shows — and it is the reason why, with all respect for the 2026 numbers, we read the filings especially thoroughly:

Update of September 30, 2026: the fourth quarter and the record year
On September 30, 2026, Micron reported the results of the fiscal year that ended on September 3 — via a mandatory filing with the SEC (an 8-K, the form for market-moving events, with the earnings release attached as Exhibit 99.1). The headline first: Micron once again beat its own guidance by a wide margin. For the fourth quarter, management had guided in June to $50.0 billion in revenue (plus or minus $1.0 billion), a gross margin of about 86 percent and earnings of $30.73 per share (plus or minus $1.00). It delivered $54.2 billion in revenue, an 86.8 percent gross margin and $32.87 in earnings per share — revenue landed $3.2 billion above the top of its own range. Net income for the quarter: $37.7 billion, more than four times the entire prior year.
Now the context that no headline carries: the fourth quarter had 14 weeks, the third 13 — that is what the quarterly report as of May 28, 2026 states. Broken down per week, revenue rose from about $3.19 billion to about $3.87 billion, or roughly 21 percent instead of the 31 percent the raw quarter-over-quarter comparison shows. Still an enormous jump — but a third of the apparent sequential growth is calendar, not demand. Details like this decide whether you lay the mental ruler down correctly.
Where the growth came from is shown by the four business units: the business with enterprise data centers grew fastest (Core Data Center, $18.0 billion after $11.5 billion in the prior quarter, up $6.5 billion). Behind it come cloud memory for the large data-center operators ($16.3 billion after $13.8 billion), automotive and industrial customers ($6.8 billion after $4.6 billion — at plus 47 percent the second-fastest growth in percentage terms) and smartphones and PCs ($13.1 billion after $11.5 billion). Gross margins in all four units ranged between 83 and 90 percent — the price boom has long since reached the entire product range, not just AI memory. Micron again gives no HBM revenue figure; per the prepared remarks, HBM revenue grew faster than total revenue in the fourth quarter, and the vast majority of calendar 2027 HBM bit supply is already contracted "with significant price increases year over year".
The balance sheet as of September 3, 2026 is that of a fortress: $73.5 billion in cash, securities and restricted cash against $5.2 billion of debt, equity of $138.4 billion. Two items deserve a second look. First, the customer deposits: $12.7 billion flowed in during the fiscal year as cash deposits under the new multi-year contracts; noncurrent customer contract liabilities now stand at $12.9 billion on the balance sheet (prior quarter: $0.6 billion). The cash flow statement books this money as financing, not as operating inflow — and per the CFO's prepared remarks, customers get it back over time, "toward the latter half of each agreement's term", provided they meet their minimum purchases. Part of the fortress treasury is therefore borrowed customer money, a kind of security deposit for guaranteed supply. Second, receivables: they rose to $36.2 billion — a year earlier they were $9.3 billion. And the look ahead: for the first quarter of fiscal year 2027 (through early December 2026), Micron guides to $61.5 billion in revenue (plus or minus $1.5 billion), a gross margin of about 85.95 percent and earnings of $37.84 per share. Per week (13 weeks), that would be about $4.73 billion in revenue — a good fifth more than the $3.87 billion of the fourth quarter; adjusted growth is thus not slowing. What is notable is something else: for the first time since March 2025, the guided margin sits below the one most recently achieved — after 86.8 percent, management expects about 85.95 percent. The explanation is in the prepared remarks for the earnings call: Micron raised fiscal 2026 incentive compensation in the fourth quarter, the manufacturing-related part was absorbed into inventories and weighs on the margin as that inventory is sold. And CFO Mark Murphy committed himself:
"We anticipate fiscal Q1 to be the floor for gross margins in fiscal 2027."
— Mark Murphy, CFO, prepared remarks for the earnings call of September 30, 2026 (Micron Investor Relations)
The same paragraph contains the half-sentence worth remembering: margins are to rise afterwards "with a more moderate rate of price increases". In the fourth quarter itself, DRAM prices per the prepared remarks still rose in the high teens percent over the prior quarter, while DRAM bit shipments grew only in the mid-single digits — this quarter, too, was a price quarter. That is not a break. But management has set its own bar: if the margin in any later quarter of fiscal 2027 falls below the first quarter's, the word "floor" was wrong.
Management's tone, meanwhile, stays tuned to superlatives. CEO Sanjay Mehrotra in the earnings release:
"AI is becoming Super Intelligence (SI), and memory enhances this intelligence and the competitiveness of our customers’ platforms. We are increasing our investments in technology, products and manufacturing to help drive SI forward with our customers, and our Strategic Customer Agreements provide added confidence in the durability of Micron’s financial performance."
— Micron Technology, earnings release for the fourth quarter and fiscal year 2026, Exhibit 99.1 to the 8-K of September 30, 2026
Read the last clause twice: "durability" is exactly the word this entire analysis revolves around. Management asserts it — the proof only comes once memory prices stop rising. Two more items from the weeks before year-end belong in the picture: on August 26, 2026, Micron reshuffled its leadership — Manish Bhatia, until then Executive Vice President, Global Operations (manufacturing, fab construction, supply chain, procurement), became President and Chief Operating Officer, and technology chief Scott DeBoer also became a President; former Chief Business Officer Sumit Sadana moved into the role of senior advisor to the CEO (8-K Item 5.02). And capital allocation remains cautious: only $0.65 billion went into share buybacks and $0.61 billion into dividends during the fiscal year — against $62.3 billion of adjusted free cash flow. So far, Micron is keeping most of the money in the company. That is set to change: per the prepared remarks, Micron intends to increase its capital return from December 9, 2026, the second anniversary of its definitive CHIPS agreements, and over time to return 100 percent of its excess cash to shareholders. How much counts as "excess" when part of the cash is repayable customer deposits and capex keeps rising will be the next yardstick.
What the filings say — the uncomfortable truths
Uncomfortable truth no. 1: it is a price boom, not a volume explosion — and the prices, per the company's own filing, are a roller coaster
Break the third quarter's 346 percent revenue jump into its parts, as the quarterly report itself does: in DRAM, selling prices rose about 260 percent, the volume sold only about 20 percent; in NAND, prices rose about 310 percent on a low-double-digit volume gain. Almost the entire boom thus sits in the price — the one variable Micron controls least. (For the fourth quarter, the prepared remarks for the earnings call give the direction versus the prior quarter: DRAM prices up in the high teens percent on a mid-single-digit volume gain, NAND prices up about 30 percent on roughly 10 percent more bits. The year-over-year breakdown will only come with the 10-K annual report for 2026, which had not been filed as of October 1, 2026.) How little, the annual report describes in a paragraph you should have read before laying down the mental ruler:
"We have experienced significant volatility in our average selling prices and may continue to experience such volatility in the future. In the past five years, annual percentage changes in DRAM average selling prices have ranged from plus low 40% to a minus high 40% range. In the past five years, annual percentage changes in NAND average selling prices have ranged from plus low 30% to a minus low 50% range. In some prior periods, average selling prices for our products have been below our manufacturing costs and we may experience such circumstances in the future."
— Micron Technology, SEC annual report 10-K, fiscal year 2025, Item 1A "Risk Factors"

Add the second ingredient of every memory cycle: supply. The report names it soberly — Micron and its competitors are building new fabs and ramping up existing ones, and if worldwide supply grows faster than demand, it "could lead to declines in average selling prices". Exactly that script ran in 2022/2023: first record prices, then overcapacity, then a gross margin below zero. The AI demand is real, and it can stretch the cycle. But a commodity market remains a commodity market: growth that comes almost entirely from price can leave with the price.
Uncomfortable truth no. 2: "this time it's different" now stands verbatim in the mandatory filing — as a margin promise
And here it gets genuinely exciting, because in the quarterly report as of May 28, 2026 Micron claims, in effect, exactly that — with a construction that did not appear in Micron's earlier filings: multi-year "take-or-pay" contracts with the big buyers. Take-or-pay means literally what it says: the customer commits bindingly to fixed volumes over several years — and if it doesn't take delivery, it has to pay anyway. Add price bands with floors and ceilings and, per the report, expected customer funds of $22 billion, about $18 billion of it as cash deposits (as of the quarterly report for May 28, 2026). The total has grown since: for 26 signed agreements and extensions, management cited financial commitments from customers of $32 billion on September 30, 2026, "the vast majority of which are cash deposits". By the end of the fiscal year on September 3, 2026, $12.7 billion of it had flowed in, roughly two fifths. And the money sits in the till only for a time: the deposits go back to customers over time, mostly toward the end of each term, once they have taken their minimum volumes. Without them, net cash as of September 3, 2026 would be about $55.6 billion instead of $68.3 billion. Per management, the 26 agreements cover an estimated more than 35 percent of revenue through 2030 — read the other way, the larger part still depends on the open market. The decisive sentence stands in the middle of the management discussion:
"Strategic customer agreements are structured as take-or-pay agreements, with binding commitments for specific volumes over the multi-year contract terms. Pricing for most agreements is either fixed, or is subject to minimum and maximum pricing. […] We expect gross margins from our strategic customer agreements with price bands, even at floor pricing levels, to yield gross margins well above our peak quarterly margins in any past cycle."
— Micron Technology, SEC quarterly report 10-Q as of May 28, 2026, Item 2 MD&A "Industry Conditions — Strategic Customer Agreements"

Be fair to both sides here. In favor: contracts like these are a structural break with memory history — the prior year's annual report still noted that customers were generally reluctant, given volatile industry conditions, to enter into long-term fixed-price contracts. If buyers are now depositing billions and binding themselves for years, the fear of memory scarcity is evidently greater than the fear of overcapacity. Against: part of the contracts has no price bands at all, for the largest agreements the ceilings are generally anchored to the market price of the second calendar quarter of 2026 of all things — that is, the price level in the middle of the current boom (10-Q as of May 28, 2026) —, and a promise about future margins is a management forecast, not a balance-sheet item. And whether such contracts hold or get renegotiated in a downturn is so far untested in this industry — the ones negotiating would be precisely the big customers we are about to discuss. "This time it's different" has taken contract form here for the first time. Whether it holds will be decided exactly when it is needed: in the next downturn.
Uncomfortable truth no. 3: a single customer accounted for 17 percent of revenue — and a good part of the record still sits in the balance sheet as an unpaid bill
Who actually buys all these chips? The annual report answers that in two terse sentences — and they pack a punch:
"Revenue from one customer was 17% (primarily included in the CMBU segment) of total revenue for 2025. […] In each of the last three years, approximately one-half of our total revenue was from our top ten customers."
— Micron Technology, SEC annual report 10-K, fiscal year 2025, Note 28 "Certain Concentrations" and Item 1 "Business"

Customer concentration, translated: if your market stall makes half its revenue with ten regulars and a single one of them brings almost a fifth — how firm is your pricing power once that guest is less hungry? Micron's big customers are the hyperscalers and AI-chip companies, precisely the names whose data-center budgets carry the boom. They have recently been ordering more than could be delivered — the quarterly report as of May 28, 2026 speaks openly of Micron allocating the goods. But the same concentration works in reverse, too: a single throttled investment plan immediately hits a fifth of the business. And one more detail from the balance sheet belongs in this picture: receivables — mostly revenue already booked that the customers have not yet paid — swelled within a year from $9.3 billion to $36.2 billion, almost fourfold (balance sheet as of September 3, 2026). How much of that is pure trade receivables only the annual report will break down; as of May 28, 2026 it was $26.9 billion of $31.0 billion, the rest mainly outstanding government incentives. With exploding revenue that is arithmetically normal (payment terms simply lag behind), but it also means: a substantial part of the record year exists so far as an open invoice — and because about half of revenue comes from ten customers (FY 2025), collection also depends on a few names. It turns into cash only once it is paid.
Uncomfortable truth no. 4: China has partly banned Micron — and is breeding tomorrow's competition at the same time
The fourth truth is geopolitical, and it has stood in every Micron filing for three years. In May 2023, China's cyberspace regulator CAC decided after a "cybersecurity review" that operators of critical information infrastructure in China may no longer buy Micron products:
"Following the May 2023 decision of its cybersecurity review of our products sold in China, the CAC determined that critical information infrastructure operators in China may not purchase Micron products, impacting our revenue with companies headquartered in mainland China and Hong Kong, including direct sales as well as indirect sales through distributors."
— Micron Technology, SEC annual report 10-K, fiscal year 2025, Item 1A "Risk Factors"

The ban is only half the China story. The other half is called CXMT and YMTC — China's state-financed memory makers, which the annual report explicitly names as a growing threat: massive state capital, aggressive prices, growing market shares first in the home market. YMTC is by now fighting the conflict in court as well and is suing Micron for alleged patent infringement twice over — before a U.S. federal court in California and before the Beijing Intellectual Property Court, including a demand for sales bans in China. For the ruler in your head this means: today's supercycle lives on the fact that only three suppliers in the West can deliver. China's declared goal is that, in the long run, there will be more — with state money that does not have to earn the same return as private capital. That is not a 2026 problem. But memory fabs are built for decades — and so are stock valuations of $1.2 trillion.
Valuation: $1.2 trillion — the price of permanence
On September 29, 2026, the last trading day before the annual results, Micron stock closed at $1,065.10; at about 1.13 billion shares (1,129,393,151 per the cover of the quarterly report, as of June 17, 2026) that makes a market value of about $1.2 trillion — an approximation, since the share count may have shifted slightly since June through employee equity awards and buybacks. The highest close of the preceding twelve months was $1,213.56 (June 25, 2026); at the start of 2026 the stock still stood at $285.41. The exciting question is what you measure that price against. On fiscal 2026 earnings of $74.33 per share, the price-to-earnings ratio sits around 14 — low at first glance for the most profitable phase in company history. Take the company's own guidance for the first quarter of 2027 ($37.84 per share) and annualize it, and it would be about 7. You see the pattern: the further you extend the ruler, the cheaper the stock gets. The counter-test comes from the substance metrics: the price-to-sales ratio sits around 9 — the market pays $9 for every dollar of fiscal 2026 revenue — and the price-to-book ratio around 8.7. A correction on our part: the first edition of July 2026 cited a price-to-sales ratio of about 27 and a price-to-book ratio of about 12.7 here. Those figures rested on a market-value field in the fundamental data ($1,576 billion) that sat well above the product of share count and price; computed with the share count from the quarterly report, the market value then was about $1.07 trillion and the price-to-sales ratio about 12 on the four quarters reported at that time. But: measured against fiscal year 2023 revenue, the price-to-sales ratio would be about 77 — that is what the stock costs if prices ever fall back to where they stood three years ago. To be fair: about $68 billion in net cash (which includes the $12.7 billion of repayable customer deposits), a small quarterly dividend of $0.15 and an ongoing buyback program cushion the picture; on top of that, up to $6.4 billion in CHIPS grants from the U.S. government flow into the U.S. fab projects. But the $27.4 billion of net capital expenditures in fiscal year 2026 — $10.8 billion in the fourth quarter alone — are a reminder of how this cycle ends when it ends: per the annual report, Micron and its competitors are building new capacity. How differently the market prices perfection, by the way, is something we already dissected at the chip-equipment maker KLA — and at memory neighbor Western Digital we showed how quickly a record profit can turn into a book-gain riddle.
Opportunities and risks at a glance
What speaks for Micron:
- Structural scarcity with a genuine tailwind: per the quarterly report, AI demand exceeds industry supply and Micron is actively allocating the goods; only three suppliers worldwide master HBM at scale, and Micron is the only one headquartered in the United States (10-Q as of May 28, 2026; 10-K, fiscal year 2025).
- Historic earning power: $133.2 billion in revenue and $85.0 billion in net income in the fiscal year ended September 3, 2026, an 86.8 percent gross margin in the fourth quarter, $89.7 billion in operating cash flow and $62.3 billion in adjusted free cash flow for the year (8-K of September 30, 2026).
- Fortress balance sheet: $73.5 billion in cash, securities and restricted cash against $5.2 billion of debt (September 3, 2026), $10.0 billion repaid during the fiscal year, equity of $138.4 billion — plus up to $6.4 billion in CHIPS grants for the U.S. fabs.
- Contract security at Micron for the first time: multi-year take-or-pay contracts with price floors; per management, 26 such agreements cover an estimated more than 35 percent of revenue through 2030, and $12.7 billion in customer deposits already flowed in fiscal year 2026 — a structural break with Micron's previous business logic.
- High guidance accuracy so far: in nine of eleven quarters since early 2024, revenue and gross margin came in at the high end of or above the company's own guidance, and in none below it — most recently $54.2 billion instead of $49 billion to $51 billion in fourth-quarter revenue (earnings release of September 30, 2026).
What speaks against it:
- The boom is almost exclusively a price boom (DRAM prices +260 percent, volume +20 percent year over year in the third quarter) — and the company's own risk history cites annual price declines of up to close to 50 percent (DRAM) and a good 50 percent (NAND), at times below manufacturing cost (10-K, fiscal year 2025).
- The Magic Formula systematically rates cyclicals as "cheap" at the earnings peak: as recently as fiscal year 2023 the gross margin stood at minus 9 percent and the bottom line at minus $5.8 billion — the same market, three years earlier.
- The valuation prices in permanence: a market value of about $1.2 trillion, a price-to-sales ratio around 9, price-to-book around 8.7, plus about 537 percent in twelve months (close of September 29, 2026) — measured against 2023 revenue the price-to-sales ratio would be about 77. And the guidance for the first quarter of 2027 shows a slightly lower margin for the first time since March 2025 (about 85.95 after 86.8 percent).
- Concentration and upfront exposure: one customer stood for 17 percent of fiscal year 2025 revenue, the top ten for about half; receivables swelled from $9.3 billion to $36.2 billion within a year; $27.4 billion of net capital expenditures in fiscal year 2026 raise the stakes further.
- China twice over: a CAC purchase ban for critical infrastructure since May 2023, state-financed rivals CXMT/YMTC with aggressive prices — and YMTC patent suits in Beijing and California including demanded sales bans (10-K, fiscal year 2025; 10-Q as of May 28, 2026).
What the Earnings Calls Reveal
We reviewed Micron's earnings calls in chronological order, from fiscal quarter 2024-Q2 (call in March 2024) through 2026-Q4 (September 2026) — ten transcripts through June 2026, and management's prepared remarks for the fourth quarter. The most striking finding is the hit rate: in nine of eleven quarters, revenue and gross margin came in at the high end of or above the company's own guidance, and in none below it (checked against the guidance tables in the earnings releases). Toward the end of the period the gaps became extreme — for 2026-Q3, management had guided 33.5 billion dollars of revenue and delivered 41.5 billion at an 84.6 percent gross margin. The two exceptions: in 2025-Q1, revenue and gross margin hit only the middle of the range, and in 2025-Q2 the gross margin landed in the lower part of the range; EPS beat the range in both quarters.
Even more telling than quarterly guidance are the multiyear commitments. In March 2024 (2024-Q2), management committed to several hundred million dollars of HBM revenue in fiscal 2024, multiple billions in fiscal 2025, an HBM market share matching its DRAM share "sometime in calendar 2025", and a record fiscal 2025. Every item was checked off on schedule:
- 2024-Q4 confirmed the fiscal 2024 HBM target.
- 2025-Q2 reported over one billion dollars of HBM revenue in a single quarter for the first time.
- 2025-Q4 confirmed share parity with the DRAM share in calendar Q3 2025 — earlier rather than later versus the most recent framing — and the record year: 37.4 billion dollars of revenue, up 49 percent.
- The 2025-Q4 pledge to sell out the remaining calendar 2026 HBM supply "in the coming months" was completed by 2026-Q1; the HBM4 ramp promised for 2026 had already produced over one billion dollars of revenue per 2026-Q3.
The record is not flawless. On NAND, management misjudged 2024: the medium-term demand growth forecast slid from "low 20s" percent (2024-Q2) to "high teens" (2024-Q3) to "mid-teens" (2025-Q2) — when an analyst pressed the first cut in 2024-Q3, the answer was there is "not much of a difference", and the further reduction came without comment. Actual calendar 2024 NAND demand grew only about ten percent instead of the projected mid-teens, and the NAND price increases promised for all of 2024 flipped into output cuts by late 2024. The PC replacement cycle "starting in late 2024" with its Windows 12 catalyst also failed to appear on time: in 2025-Q1 management openly conceded the pushout, and Windows 12 silently vanished from the narrative afterward.
On HBM figures, Micron practices selective transparency: milestones are actively marketed, while regular quarterly numbers and share figures are repeatedly withheld (2024-Q4, 2025-Q1, 2026-Q1, 2026-Q2). This is openly declared policy rather than covert evasion — but it makes the most important growth pillar harder to measure. And from fiscal 2026 onward, late-cycle signals accumulate: the capex envelope rose in four consecutive calls from about 18 to about 27 billion dollars, each time with pledges of discipline; the language shifted to superlatives; at the margin peak, far-horizon narratives such as robotics as a "20-year growth vector" appeared. On the other hand, the new multiyear contracts (SCAs) per 2026-Q3 lock in floor prices with margins "well above our peak quarterly margins in any past cycle" — and in 2026-Q1 management quantified the shortage unusually concretely: for several key customers it can serve only "about 50 percent to two-thirds" of demand.
Our conclusion from the transcripts: an unusually robust track record — nine of eleven quarters at the high end of or above guidance and none below, multiyear commitments met on schedule, and misjudgments did occur (NAND, PC cycle): management openly conceded the PC pushout, while the last NAND cut and the Windows 12 topic disappeared without comment. Measured against the guidance streak, these remain edge cases. What remains open are the late-cycle signals from 2026 onward: the more perfect the streak, the greater the drop height.
The eleventh link in the streak is the fourth quarter of fiscal year 2026: $54.2 billion in revenue instead of the guided $49 billion to $51 billion, an 86.8 instead of about 86 percent gross margin, $32.87 instead of $29.73 to $31.73 in earnings per share (earnings release of September 30, 2026). Capital spending also landed right on the most recently stated envelope of about $27 billion, at $27.4 billion net. In the prepared remarks for the September 30 call, management raises the bar for 2027 even higher: "As strong as fiscal 2026 was, we expect fiscal 2027 to be even better" — with sequential revenue growth in every quarter. When supply and demand will balance again, Micron says it cannot tell ("we do not have line of sight"); capex is to rise above prior plans, to about $25 billion in the first half of fiscal 2027. And the late-cycle language has reached a new level: AI becomes "Super Intelligence", which is creating "the most compelling opportunity for Micron in its history".
A human conclusion
Back to the ruler in the head. The mean thing about it: it never feels like speculation, it feels like mathematics — three points, one line, done. Micron is the stress test for that feeling, in both directions. Whoever buys today extends the line of the last four quarters and gets real arguments for it: signed take-or-pay contracts, $12.7 billion in customer deposits on hand, about $68 billion in net cash, a product without which no AI data center runs. Whoever waves it off simply lays the ruler down earlier — against fiscal year 2023, with a gross margin below zero and a $5.8 billion loss — and extends that line instead. Both are using the same tool. That is exactly why the roller coaster was the most honest picture of this analysis: with a cyclical, every straight line is a bet on where on the curve you happen to be sitting. The Greenblatt scanner did its job — it found a highly profitable company at a price that is moderate relative to the current profit. What it cannot do and never could: say whether this profit is a new plateau or the top of the track. That answer is in no scanner and in no filing — it hangs on whether AI has truly turned memory from a commodity into a contract good. The filings hand you both halves of the truth; which one you give more weight is your decision. And that is exactly as it should be.
Sources
All original documents used in this analysis — to read for yourself:
- Micron Technology — earnings release for the fourth quarter and fiscal year 2026 (through September 3, 2026), Exhibit 99.1 to the 8-K of September 30, 2026
- Micron Technology — current report 8-K of August 26, 2026 (Item 5.02, leadership changes)
- Micron Technology — SEC annual report 10-K for fiscal year 2025 (ended August 28, 2025; filed October 3, 2025)
- Micron Technology — SEC annual report 10-K for fiscal year 2024 (ended August 29, 2024; filed October 4, 2024)
- Micron Technology — SEC quarterly report 10-Q as of May 28, 2026 (filed June 25, 2026)
- Micron Technology — SEC quarterly report 10-Q as of February 26, 2026 (filed March 19, 2026)
- Micron Technology — SEC quarterly report 10-Q as of November 27, 2025 (filed December 18, 2025)
- Micron Technology — SEC quarterly report 10-Q as of May 29, 2025 (filed June 26, 2025)
- Micron's complete SEC filing history: EDGAR overview (sec.gov)
- Earnings call transcripts, fiscal 2024-Q2 through 2026-Q3 (public transcripts, 10 calls) — analysis as of August 2, 2026
- Micron Technology — prepared remarks for the fiscal Q4 2026 earnings call of September 30, 2026 (Investor Relations, retrieved October 1, 2026)
- Guidance check 2024-Q2 through 2026-Q4: guidance tables ("Business Outlook") and actuals of the twelve earnings releases (8-K, Exhibit 99.1) from 12/20/2023 through 9/30/2026 (SEC EDGAR)
- Fundamental data (metrics, quarterly series; data as of July 8, 2026; closing prices through September 29, 2026), reconciled with the SEC filings. We computed market value and valuation ratios ourselves from the share count (10-Q) and closing price.
- Screener and rating data: in-house stock scanner (data as of July 8, 2026; scanner membership checked live on July 14 and September 30, 2026).
Transparency & disclaimer: This analysis is a journalistic contextualization of publicly available information and is not investment advice, not a financial analysis in the regulatory sense, and not a solicitation to buy or sell securities. Stock investments carry substantial risks up to total loss. All information without guarantee; the data cut-off is noted in the text in each case. Positions held by the operator are disclosed daily; where one exists, it appears as a notice at the top of this deep dive.
Key figures at a glance
All monetary figures in millions of $; earnings per share as reported.
| Metric | 2022 | 2023 | 2024 | 2025 | 2026 |
|---|---|---|---|---|---|
| Revenue | 30,758.0 | 15,540.0 | 25,111.0 | 37,378.0 | 133,188.0 |
| Operating Income (EBIT) | 9,702.0 | -5,745.0 | 1,304.0 | 9,870.0 | 99,340.0 |
| Net Income | 8,687.0 | -5,833.0 | 778.0 | 8,539.0 | 84,969.0 |
| Net Margin | 28.2% | -37.5% | 3.1% | 22.8% | 63.8% |
| Earnings Per Share | 7.74 $ | -5.34 $ | 0.70 $ | 7.59 $ | 74.34 $ |
Source: fundamental data & SEC filings (annual and quarterly reports, 10-K/10-Q)
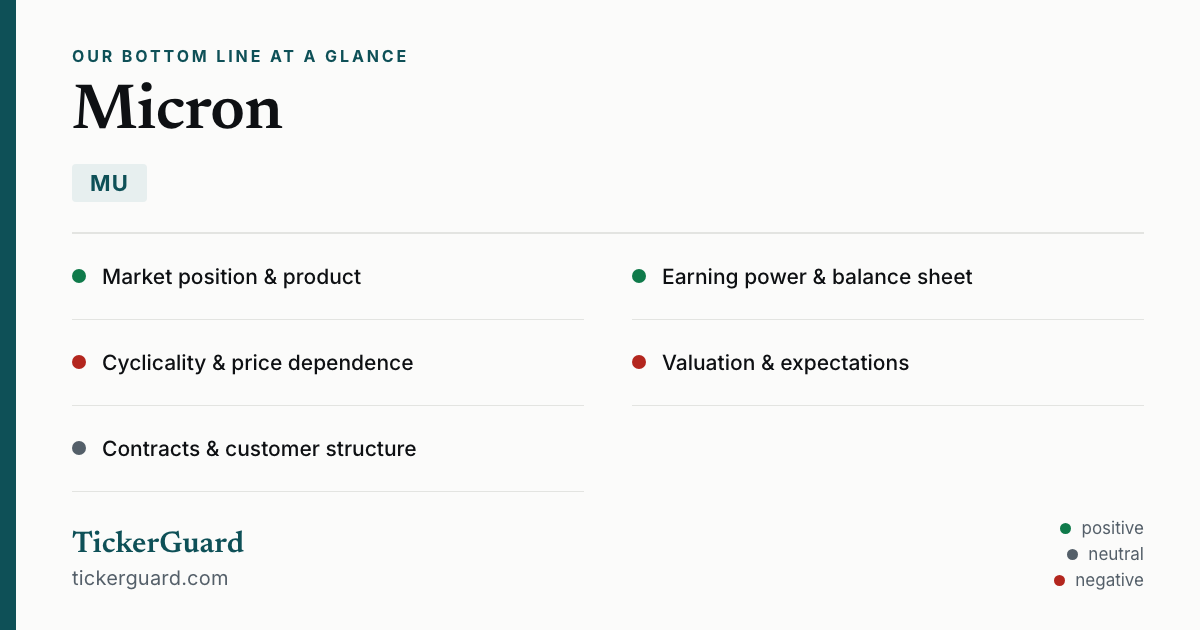
Our Bottom Line at a Glance
- Market position & product positive
- One of only three manufacturers worldwide able to build HBM high-performance memory for AI accelerators at scale — and the only one headquartered in the United States. Per the quarterly report, AI demand exceeds industry supply; Micron is actively allocating the scarce goods (10-Q as of May 28, 2026). All four business units posted gross margins of 83 to 90 percent in the fourth quarter.
- Earning power & balance sheet positive
- $133.2 billion in revenue and $85.0 billion in net income in the fiscal year ended September 3, 2026, $89.7 billion in operating cash flow; $73.5 billion in cash, securities and restricted cash against $5.2 billion of debt, equity of $138.4 billion (8-K of September 30, 2026).
- Cyclicality & price dependence negative
- The boom is almost entirely a price boom (DRAM prices +260 percent, volume +20 percent year over year in the third quarter of FY 2026). The company's own five-year history in the 10-K cites price swings down to minus a good 50 percent a year, at times below manufacturing cost; in FY 2023 the gross margin was negative.
- Valuation & expectations negative
- A market value of about $1.2 trillion, a P/E of about 14 on record 2026 earnings, price-to-sales around 9, plus about 537 percent in twelve months (close of September 29, 2026). Measured against 2023 revenue the price-to-sales ratio would be about 77: the price presumes that the highest margins in the company's own history become the permanent state.
- Contracts & customer structure neutral
- Multi-year take-or-pay contracts with price floors and $12.7 billion in customer deposits on hand are a genuine structural break — but one customer stood for 17 percent of FY 2025 revenue, the top ten for half, receivables grew to $36.2 billion within a year, and China remains a double risk (the CAC ban, state-financed rivals CXMT/YMTC complete with patent suits).
Micron is the opposite of a warning-scanner case: a cyclical in record form that closed fiscal year 2026 with $133.2 billion in revenue and $85.0 billion in profit, with a fortress balance sheet, a genuine scarcity position in the AI boom and, for the first time, contractually secured volumes. The stock costs about $1.2 trillion — 14 times record earnings, but 77 times 2023 revenue. Whether the peak is a new plateau is unproven: the boom sits almost entirely in prices whose own five-year history includes annual declines of about half. Not investment advice.
What Our Rating Means
Quality confirmed
Business model, numbers and balance sheet hold up to our review. Whether the current price supports an entry is a separate question — it hangs on the price, not on the company.
Quality, balance sheet and scarcity position are real and grew stronger with the fiscal 2026 close: about $68 billion in net cash, customer deposits in the billions, revenue and margin at the high end of or above its own guidance in nine of eleven quarters. What remains open is durability: a market value of about $1.2 trillion presumes that take-or-pay contracts and AI demand permanently dampen one of the strongest price cycles in the chip industry (price swings down to minus a good 50 percent a year per the FY 2025 10-K). That would only be firmly proven by quarters after prices normalize — and there have been none so far. The decision is yours.
A journalistic assessment by our editorial team at the time of the deep dive, based on public sources — not investment advice and not a solicitation to buy or sell. Your personal circumstances (investment goals, risk capacity, taxes) cannot be taken into account. What our levels mean, how verdicts are formed, and what conflicts of interest exist →
Worth Noting
- Micron reports on an offset fiscal year (ending on the Thursday closest to August 31); "FY 2026" denotes the period 29.08.2025 through 03.09.2026 with 53 weeks, and the fourth quarter had 14 weeks instead of 13. All periods are explicitly dated in the text.
- Update of 30.09.2026 based on the earnings release (8-K, Exhibit 99.1) and the prepared remarks for the earnings call; the 10-K annual report for FY 2026 had not been filed as of 01.10.2026. Statements from the FY 2025 10-K (customer concentration, price history, China) therefore carry their date.
- Price and valuation figures dated September 29, 2026 (close of $1,065.10); the market value is our own calculation from 1,129,393,151 shares per the quarterly report (as of 17.06.2026). The first edition of July 2026 cited a field value of $1,576 billion that sat above this product.
- The guidance for the first quarter of FY 2027 ($61.5 billion in revenue plus or minus $1.5 billion, a gross margin of about 85.95 percent, $37.84 in earnings per share) is a company statement, not a result.
Download the verdict card (traffic light and rating of this analysis as an image, PNG)
Stock Watch
This analysis is as of October 1, 2026. Stock Watch will tell you what's changed at MU since then.
Later $1 a month per stock — signing up is free, and you'll be the first to know when it launches.
The full analysis as a PDF for later
We will send you this analysis as a PDF — to print, file away, and read at your own pace. And we will add you to the free Stock Watch list for Micron Technology Inc (MU), so you hear about it when something material in this analysis changes.
Frequently Asked Questions
Micron (Nasdaq: MU) of Boise, Idaho, is one of the world's three big memory-chip makers. The company builds DRAM (working memory), NAND (data storage for SSDs and smartphones) and HBM — stacked high-performance memory mounted right next to AI processors, which only Samsung, SK hynix and Micron can build at scale. In fiscal year 2026 (through September 3, 2026) Micron posted $133.2 billion in revenue, after $37.4 billion the year before.
Joel Greenblatt's Magic Formula looks for companies with a high return on capital and a high earnings yield — that is, lots of operating profit per dollar of capital employed and per dollar of enterprise value. Micron's record profits in the AI boom (a 74.6 percent operating margin in fiscal year 2026) satisfy both criteria. The formula's known weakness: with cyclicals it preferentially fires at the earnings peak, because it treats current profits as a permanent state.
Extremely: per Micron's own annual report, DRAM selling prices swung between roughly plus 40 and minus close to 50 percent a year over the past five years, at times sitting below manufacturing cost. In fiscal year 2023 the gross margin was negative at minus 9 percent and the bottom line stood at minus $5.8 billion — three years before the record quarter with an 86.8 percent gross margin.
Since 2026 Micron has been signing multi-year supply contracts in which customers must take fixed volumes bindingly — or pay anyway ("take or pay"). Most carry fixed prices or price bands with floors and ceilings. In fiscal year 2026, customers already placed $12.7 billion in cash deposits for them, which they get back over time, mostly toward the end of the term, if they take their minimum volumes; per the quarterly report, gross margins even at the lower price band are supposed to sit above all previous cycle peaks.
That depends on the yardstick: at the closing price of $1,065.10 (September 29, 2026), the price-to-earnings ratio on fiscal 2026 earnings is about 14, the price-to-sales ratio about 9 and the price-to-book ratio about 8.7. Measured against revenue in the weak fiscal year 2023, the price-to-sales ratio would be about 77. With a cyclical, a low P/E at the peak is no proof of a bargain.
A double risk role: since May 2023, operators of critical information infrastructure in China may not buy Micron products (a CAC decision). At the same time China is building up state-financed memory makers in CXMT and YMTC, which per the annual report aim to win market share with aggressive prices — and YMTC is suing Micron over patents in Beijing and California, including demanded sales bans.
Micron has an offset fiscal year that ends on the Thursday closest to August 31. Fiscal year 2026 ran from August 29, 2025 through September 3, 2026 and had 53 weeks instead of 52; the extra week sits in the fourth quarter (14 weeks). When comparing with other chip companies you have to keep this shift in mind — which is why every period in this analysis is dated.
In nine of eleven fiscal quarters reviewed (2024-Q2 through 2026-Q4), revenue and gross margin came in at the high end of or above guidance; in 2025-Q1 they hit only the middle of the range and in 2025-Q2 the margin landed in the lower part, while EPS beat both times. Most recently: $54.2 billion in revenue against a maximum of $51 billion. We flag lowered NAND demand forecasts (2024/2025), the delayed PC cycle, four capex increases in a row and superlative rhetoric all the way to "Super Intelligence".
Found an error?
Did you spot a factual error, an outdated number, or a typo in this deep dive? Let us know briefly — your report goes straight to the editorial team.