Main Street Capital: Monthly Dividend Never Cut — but Buyers of New Shares Paid for 61 Percent of NAV Growth
Money in your account every month — but what did you pay for that payday? At Main Street Capital, about $1.60 for every dollar of net asset value (October 7, 2026). 61 percent of NAV growth from 2016 through 2025 came from new shares issued above NAV. First half of 2026: NAV per share up $0.59 — while the effect of the new shares alone was $0.72.
 Thomas Mücke
Founder & Publisher
Thomas Mücke
Founder & Publisher
As of Today
As of: October 7, 2026
- Closing price
- 54.20 $ -1.08%
- Market Capitalisation
- 5.1 $B
- P/E
- 10.9
- Growth Score
- 4/10
- AAQS
- 4/10
This analysis has a cut-off date. The Stock Guard tells you when something material changes in the numbers. Reserve your free spot
Chart
Interactive price chart (TradingView).
52-week range: 49.60 $ to 64.60 $ · Last price: 54.20 $ (As of: October 7, 2026)
Note: pure fact-based analysis, not investment advice and not a solicitation to buy or sell. All figures without guarantee.
There is one feeling that reliably softens investors: payday. Every month, money lands in the account, as punctual as a salary — and at some point you stop asking what you actually paid for that payday. Call it the payday effect. Main Street Capital could have been designed for it. The Houston-based company has paid a dividend every month since its IPO in October 2007 and, by its own account, has never cut that regular monthly dividend — not in the financial crisis, not in the pandemic. Since August 4, 2026, it is set: $0.265 per share for every month through December 2026, plus a $0.30 supplemental dividend in September.
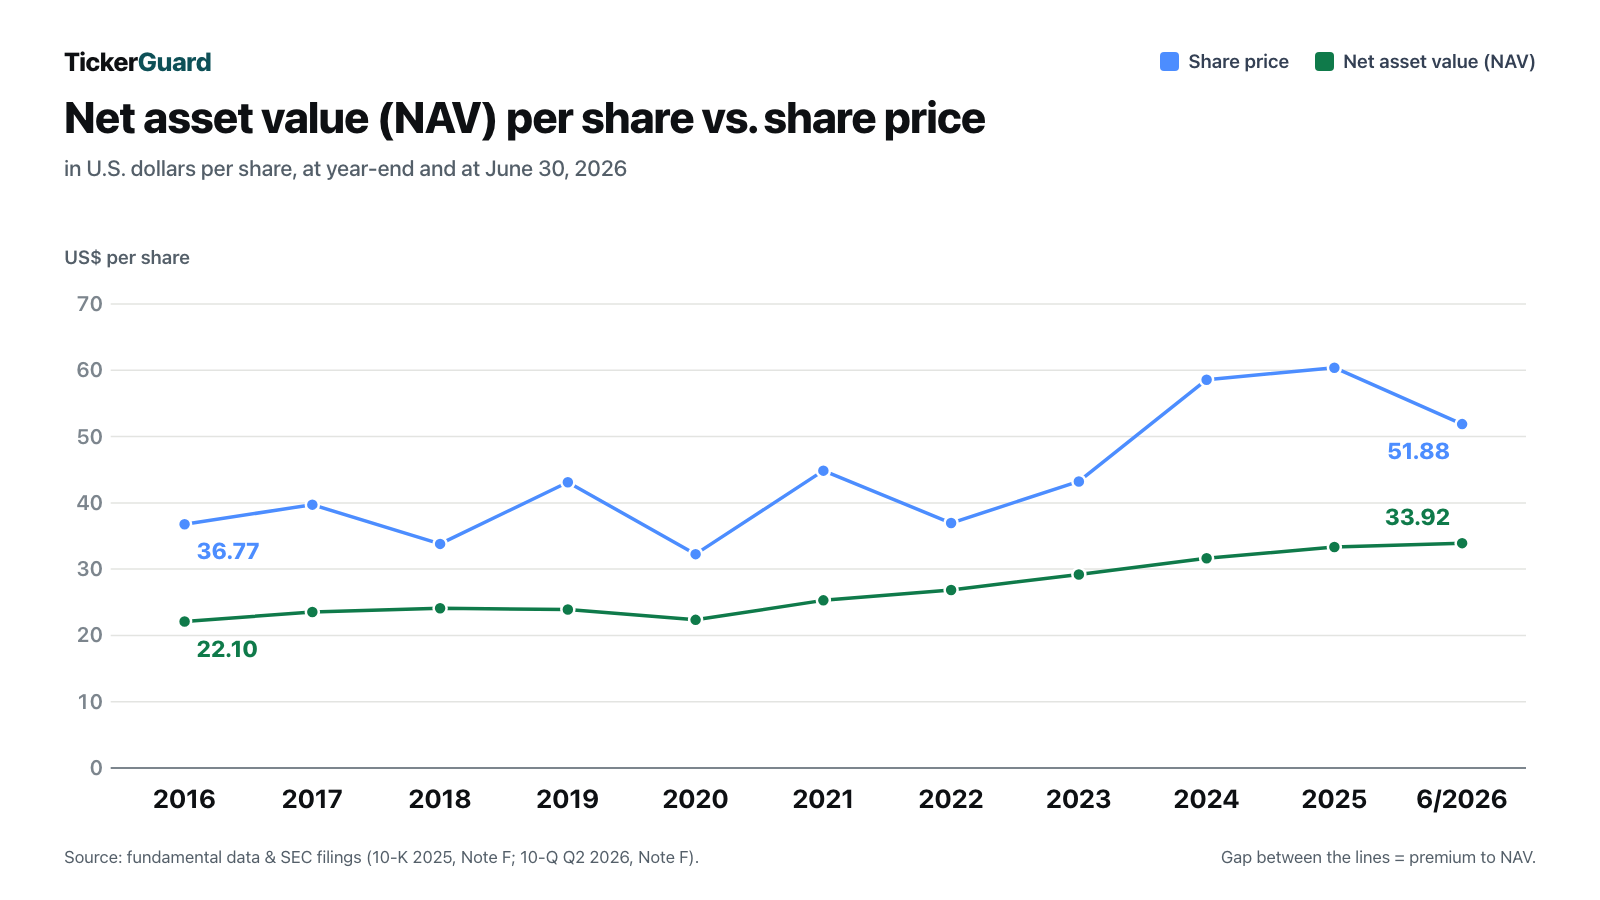
The price of that feeling is high. On October 7, 2026, the stock closed at $54.18. Net asset value per share — what would be left, based on the company’s own valuations, if every loan and equity stake were sold at its estimated value and every debt repaid — stood at $33.92 as of June 30, 2026. A buyer therefore pays roughly $1.60 for one dollar of net assets. That is the tension running through this analysis: is the premium the deserved reward for an unusually good business — or is it itself part of the engine that makes the business look so good? Let’s read the filings with the U.S. securities regulator, the SEC, together.
What Main Street Capital Does — a Bank Without Tellers for Small and Mid-Sized Companies
Main Street Capital is a business development company, or BDC. Picture a listed investment firm that lends to mid-sized companies like a small bank — just without savings accounts or branches, funded with shareholders’ money and with bonds. A BDC pays no corporate income tax in the U.S. as long as it distributes at least 90 percent of its taxable income. That is why two numbers matter most for such firms: net investment income (NII — interest, dividends and fees minus operating costs, interest expense and taxes, excluding changes in value) and net asset value per share (NAV). A price-to-earnings ratio is of little help here, because reported earnings swing mainly with revaluations.
As of June 30, 2026, Main Street held investments with an estimated value of $5.75 billion. Two businesses form the core. First, the so-called lower middle market: 94 companies with annual revenue between $10 million and $150 million, to which Main Street lends while also holding an equity stake — 36 percent on average. Those equity stakes were carried at 1.96 times their cost. Second, loans to 86 larger companies, usually owned by a private equity fund, 99 percent of them secured by a first lien, with a weighted-average effective yield of 10.2 percent. On top of that comes an asset management business for third parties with $1.8 billion under management, including the separately listed MSC Income Fund.
The distinctive part is right on the first pages of the annual report: Main Street is internally managed. Most BDCs pay an external manager a base fee on assets and an incentive fee. Main Street employs its people directly — 110 at the end of 2025, 57 of them investment professionals:
“Because we are internally managed, we do not pay any external investment advisory fees, but instead directly incur the operating costs associated with employing investment and portfolio management professionals.”
— Main Street Capital, SEC annual report 10-K for 2025, Item 1 (Business)
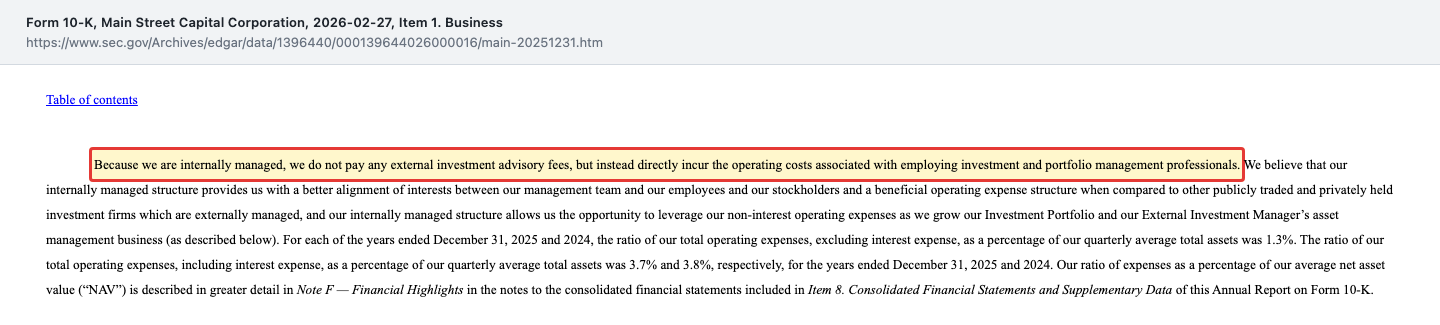
A comparison from Main Street’s own house shows what that means: as adviser to the externally managed MSC Income Fund, Main Street itself receives 1.5 percent of assets as a base fee alone, plus a 17.5 percent incentive fee (investor presentation of August 7, 2026). Main Street runs its entire operation on 1.3 percent. With about $5.75 billion of investments, every tenth of a percentage point is roughly $5.7 million a year that stays with shareholders.
Company history for investors
-
2007
IPO at $15
Listed in October 2007; net asset value at the end of 2007 was $12.85 per share, per the company. Since then, by its own account, the regular monthly dividend has never been cut.
-
2020
Pandemic year: NAV falls
Net asset value per share fell from $23.91 to $22.35, total payouts from $2.91 to $2.46 per share. The regular monthly dividend stayed uncut, per the company.
-
2022
More debt allowed
Shareholders approved the lower legal asset coverage ratio of 150 instead of 200 percent, effective May 3, 2022. Main Street uses the room cautiously: 244 percent in mid-2026.
-
2025
Premium above 100 percent
In the third quarter of 2025, the high price was 106 percent above net asset value; at year-end it was 81 percent. Buyers at the high paid more than twice the net assets.
-
2026
Cheap notes repaid, premium shrinks
In July, $500 million at 3 percent was repaid; in August, two new sales agents for new shares were added. The premium fell from 77 percent (February) to about 60 percent (October).
How the Stock Landed on Our Desk
Through the forum hot list of wallstreet-online, the German investor portal that ranks the stocks private investors in Germany are talking about most. Main Street showed up there in early October 2026. A list like that measures attention, not quality. And the attention went to a stock that has slipped this year: it closed 2025 at $60.39 and stood at $54.18 on October 7, 2026 — about 10 percent lower, excluding dividends. Net asset value per share rose from $33.33 to $33.92 (June 30, 2026) over the same period. What shrank was the premium, not the company.
How different the picture can look at an externally managed BDC — a premium of about 60 percent here, a discount of more than 40 percent there — is something we have examined before: our analysis of TriplePoint Venture Growth, which, as of our price date of October 2, 2026, traded at a discount of more than 40 percent to its net asset value and paid out more than it earned. Main Street is the mirror image — which is exactly why a close look is worthwhile.
The Numbers Over the Years — Given Their Due
First, what genuinely impresses. A BDC has to distribute almost everything it earns, so its net asset value per share usually barely grows. At Main Street it rose from $22.10 at the end of 2016 to $33.92 as of June 30, 2026 — even though a combined $28.58 per share was paid out as dividends over the nine years from 2017 through 2025. According to the preliminary release of July 16, 2026, the second quarter of 2026 was the sixteenth consecutive quarter of rising net asset value per share. Return on equity — total return including changes in value, measured against net asset value — came to 15.0 percent for the twelve months ended June 2026.
Recurring income is solid, although no longer growing per share. In 2025, Main Street generated total investment income of $566 million and net investment income of $352.7 million, or $3.95 per share. 2024 came in at $3.93 and 2023 at $4.04 — each in the version Main Street revised in 2025: since then, excise tax and income taxes are deducted within net investment income rather than below it. For 2024 this lowered the figure from an originally reported $4.09 to $3.93; the company itself calls it the voluntary correction of an immaterial presentation error. In the first half of 2026, net investment income was $1.90 per share, compared with $1.96 a year earlier. The per-share decline has a simple cause: the share count grew faster than income — in the second quarter of 2026, the weighted-average share count was 4.5 percent higher than a year earlier.
The balance sheet is conservative for a BDC. The law allows debt of up to twice equity (an asset coverage ratio of at least 150 percent); as of June 30, 2026, Main Street’s asset coverage ratio was 244 percent. The rating agencies Fitch and S&P rate the company BBB- with a stable outlook, i.e. investment grade.
Uncomfortable Truth No. 1: With the Supplemental Dividend, Main Street Pays Out More Than It Nets
The payday effect likes to add everything up: twelve monthly dividends plus four supplementals, divided by the share price. The filings draw a sharper line. The regular monthly dividend is well covered: in 2025, $3.03 of regular dividends compared with $3.95 of net investment income; in the first half of 2026 it was $1.56 against $1.90. Add the supplemental dividends and the picture changes:
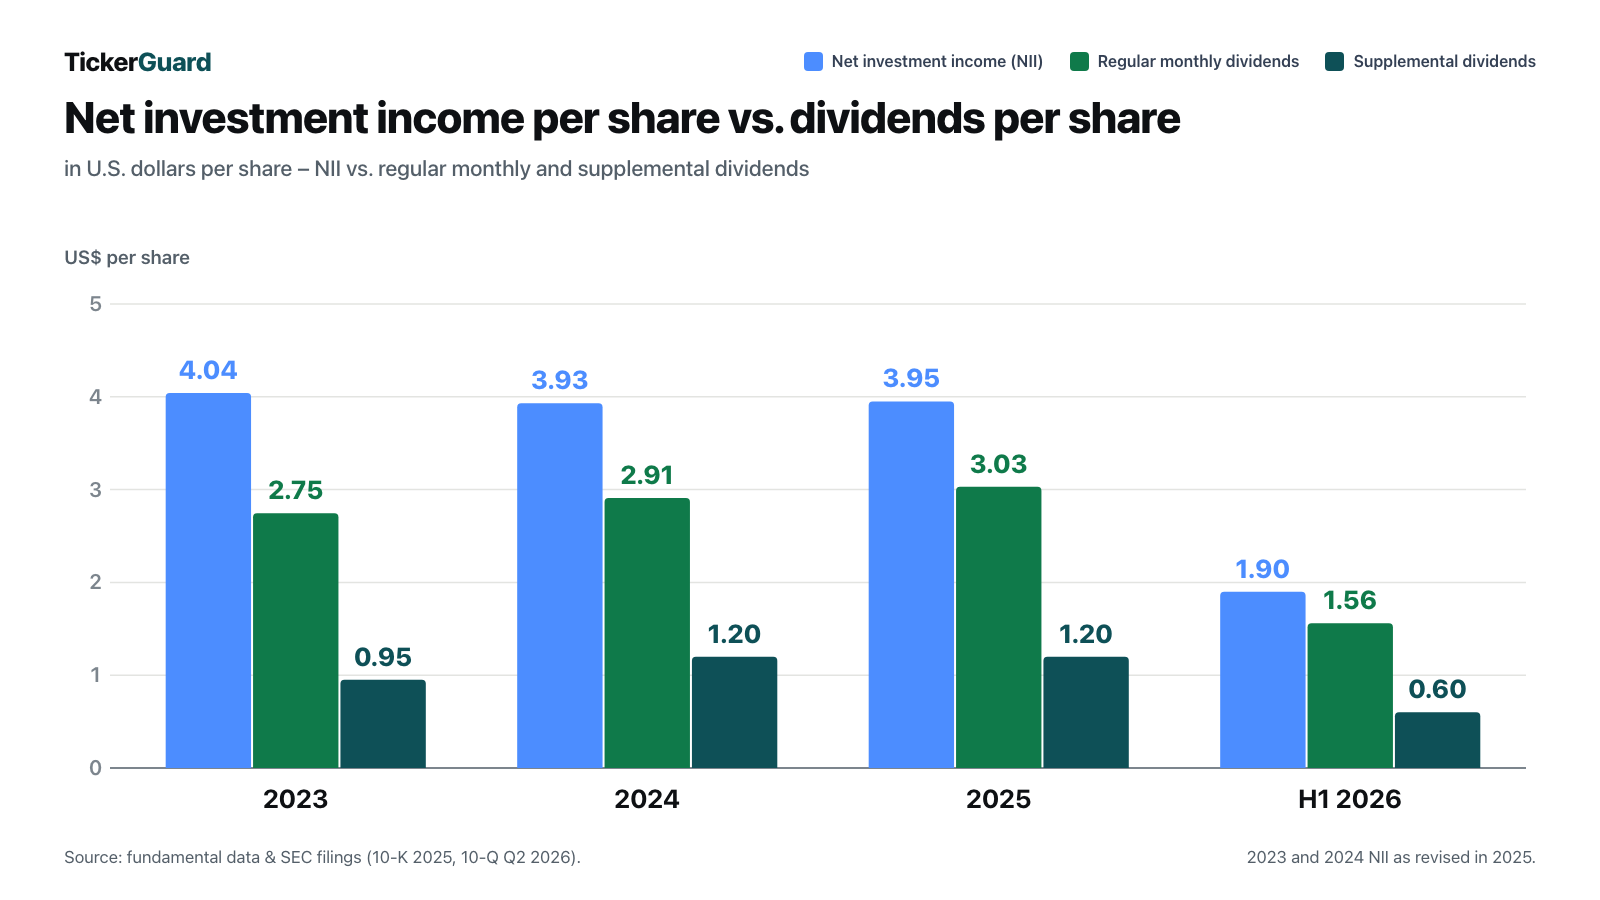
Since 2024, then, Main Street has paid out more in total than net investment income provides: in 2025, $4.23 per share against $3.95 of net investment income, coverage of 93 percent. Main Street itself prefers to measure against distributable net investment income, which does not deduct share-based compensation because it costs no cash: that came to $4.21 in 2025 and thus almost fully covered total payouts. In the first half of 2026, however, even that fell short: $2.05 against $2.16 of distributions. Where the rest comes from is stated in the dividend release of August 4, 2026:
“This supplemental cash dividend, which will be payable as set forth in the table below, will be paid out of Main Street’s undistributed taxable income (taxable income in excess of dividends paid) as of June 30, 2026.”
— Main Street Capital, current report 8-K of August 4, 2026, Exhibit 99.1

That cushion is taxable income earned in earlier periods in excess of distributions. As of December 31, 2025, Main Street put it at $103.4 million, or $1.15 per share, carried forward toward distributions in 2026. According to the investor presentation of August 7, 2026 (page 17), Main Street pays supplemental dividends to the extent distributable net investment income before taxes significantly exceeds the monthly dividends, or to manage this spillover, which arises from income in excess of dividends and from periodic realized gains — such as the $46.4 million gain from the full exit of Centre Technologies in the second quarter of 2026. The mechanism is legal, openly described and sensible for a firm with many equity stakes. But it means the supplemental dividend is not a fixed amount. It requires income to stay well above the monthly dividend or the cushion to be refilled. The monthly dividend is the salary — the supplemental dividend is more like the bonus.
Uncomfortable Truth No. 2: Buyers of New Shares Pay for Part of NAV Growth
This is the heart of the tension. As a rule, a BDC may not sell new shares below net asset value. Above net asset value it may — and Main Street does so continuously through an at-the-market program, which sells shares in small batches directly on the exchange. Picture a club with 100 members and $100 in the till that admits a new member who pays $1.60 to join. Afterwards, each member’s share of the till is worth just under $1.006 instead of $1 — without anyone having earned anything.
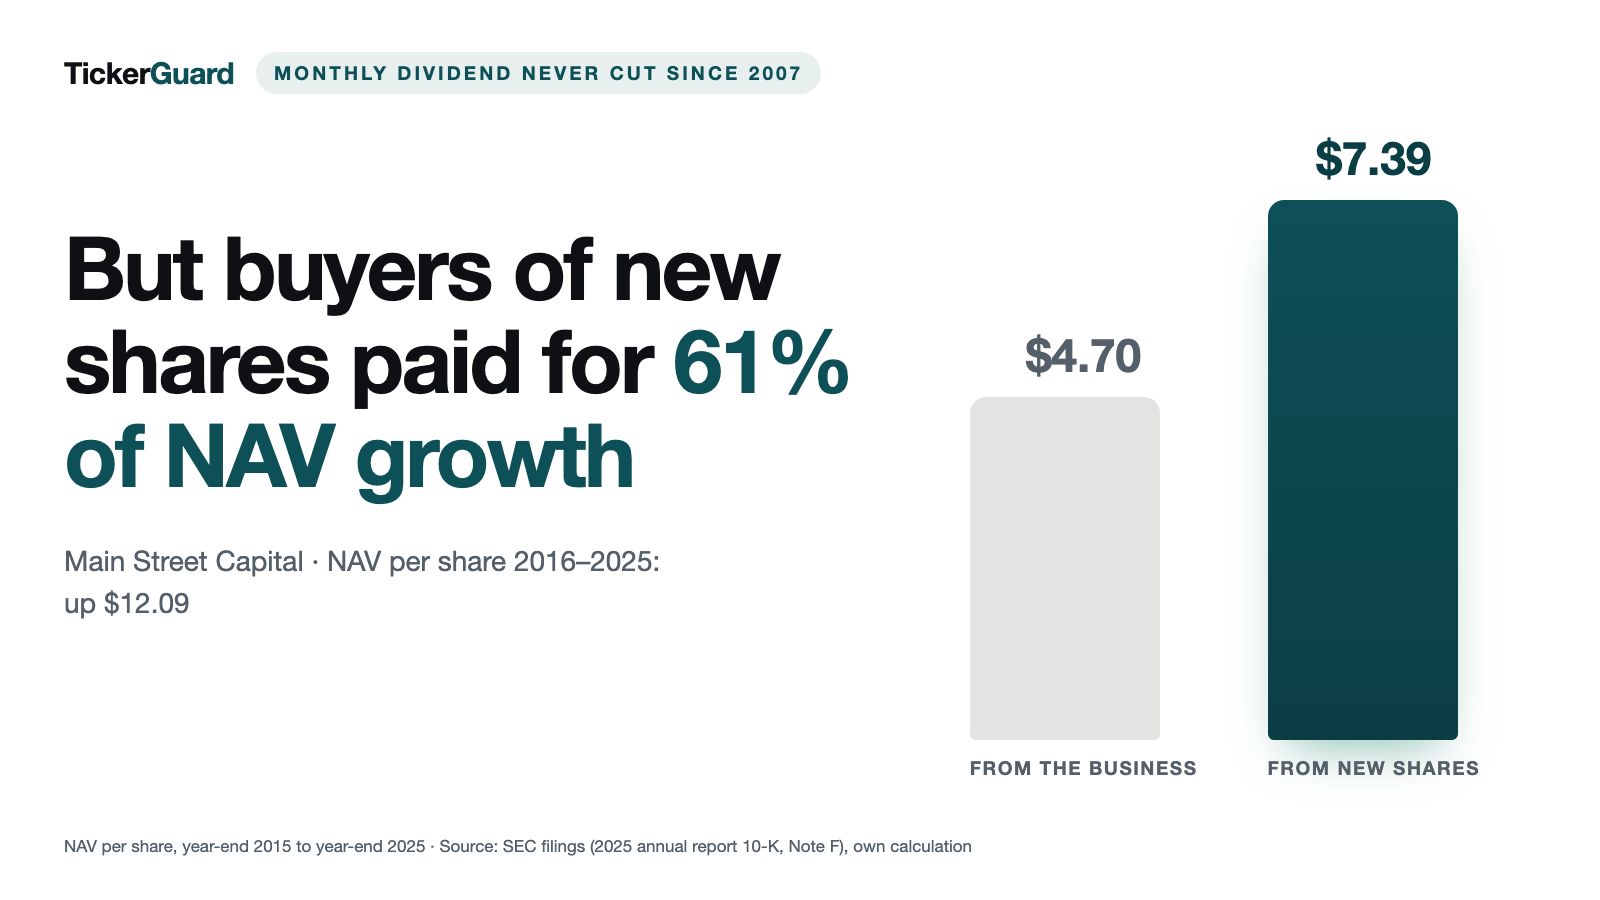
The annual report shows this effect year after year on its own line, “Accretive effect of stock offerings (issuing shares above NAV per share)”. The same effect arises from reinvested dividends issued as new shares. Added up over the ten years 2016 through 2025, that comes to $7.39 per share (our own sum from Note F of the 2025 annual report: $6.34 from stock offerings, $1.05 from dividend reinvestment). Net asset value rose by $12.09 over those ten years, from $21.24 (end of 2015, the start of the ten-year period) to $33.33. Strip that effect out and about $4.70 of growth remains over ten years. About 61 percent of the NAV growth therefore came not from the lending and equity business but from the premium paid by buyers of new shares — new investors on the exchange as well as existing shareholders reinvesting their dividends in new shares.
In the first half of 2026 this is even clearer. Main Street sold 2,790,683 new shares on the exchange at an average of $55.43 and raised $154.7 million in gross proceeds. Net asset value per share rose by $0.59 over the half year — but the effect of stock offerings and dividend reinvestment was $0.72 ($0.64 plus $0.08). Without new shares sold above net asset value, NAV per share would have edged down in the first half of 2026, because total distributions of $2.16 absorbed the half year’s earnings. Main Street upgraded the machine in August 2026: two new sales agents were added, and the program size of up to 20 million shares stays in place. The company itself warns in its annual report what this math rests on:
“The possibility that our shares of common stock will trade at a discount from NAV per share or at premiums that are unsustainable over the long term are separate and distinct from the risk that our NAV per share will decrease.”
— Main Street Capital, SEC annual report 10-K for 2025, Item 5

For you, that means the premium is not only a price you pay but also raw material the company processes. If it shrinks — and it already has, from 77 percent in February to about 60 percent in October 2026 — each new share adds less to net asset value. If it disappears altogether, this source dries up. Growth would then have to come from loans and equity stakes alone. That Main Street can do that too is shown by its 15 percent return on equity. That it would be slower is shown by the math above.
Uncomfortable Truth No. 3: Almost Everything Is an Estimate — and Some Loans Are Not Paying
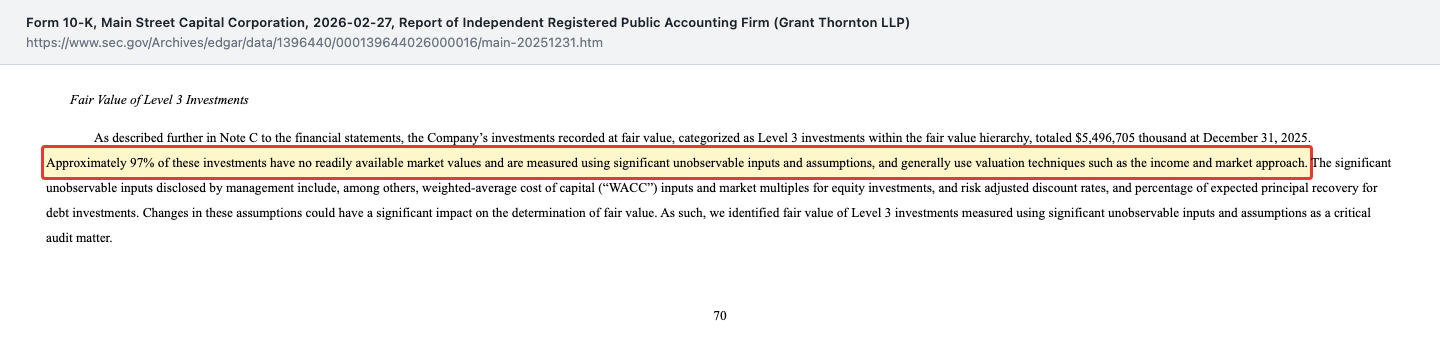
Net asset value of $33.92 is not a market price but an estimate. As of June 30, 2026, $5,723 million of $5,746 million in investments were classified as Level 3 — assets with no market price, valued using models and assumptions. That is 99.6 percent of the portfolio. (The 97 percent in the auditor’s report below refers to a different date and base: Level 3 investments as of December 31, 2025.) For a BDC lending to private companies, this is normal. Even so, the auditor, Grant Thornton, singled out the valuation as a critical audit matter:
“Approximately 97% of these investments have no readily available market values and are measured using significant unobservable inputs and assumptions, and generally use valuation techniques such as the income and market approach.”
— Grant Thornton LLP, auditor’s report in Main Street Capital’s SEC annual report 10-K for 2025
How much room such estimates leave becomes visible in the loans that have stopped paying interest (“non-accrual”). At cost, they made up 5.0 percent of the portfolio as of June 30, 2025, fell to 3.3 percent at the end of 2025 and rose back to 4.0 percent as of March 31 and June 30, 2026:
“As of June 30, 2026, investments on non-accrual status were $65.2 million at fair value and $198.5 million at cost and comprised 1.1% and 4.0% of our total Investment Portfolio at fair value and cost, respectively.”
— Main Street Capital, SEC quarterly report 10-Q for the second quarter of 2026, Item 2
The gap between the two figures — $133 million — has already been written down in net asset value. That is the good news: the problems are not hidden. The less good news: $198.5 million at cost equals about 6 percent of total equity of $3.17 billion, and in the second quarter of 2026 the restructuring of a single private loan cost $13.3 million in realized losses. Main Street has already written down its problem loans substantially — but whether the remaining $65.2 million of fair value holds is an estimate like all the others.
Uncomfortable Truth No. 4: The Cheap Money Has Run Out
Part of the strong income of recent years rested on very cheap debt from the low-rate era. The largest piece came due in the summer of 2026:
“In July 2026, we repaid the entire $500.0 million in aggregate principal amount of the July 2026 Notes at maturity at par value plus the accrued and unpaid interest.”
— Main Street Capital, SEC quarterly report 10-Q for the second quarter of 2026, Item 2
Those notes carried a coupon of only 3.00 percent. Liquidity of $1.153 billion as of June 30, 2026, was already reduced by the $500 million earmarked for the repayment — so the money was to come from the credit facilities. Those cost 5.5 and 5.6 percent according to the earnings release (rates as of the July 1, 2026, reset date); the $150 million of notes newly issued in April 2026 carry 6.93 percent. Our own rough estimate: if the 3 percent notes are fully replaced at about 5.5 percent, interest expense rises by about $12.5 million a year, roughly $0.13 per share — a little over 3 percent of 2025 net investment income of $3.95. Noticeable, but no collapse. The next notes mature in June 2027 ($400 million at 6.50 percent), and in the first quarter of 2027 the first government-guaranteed debentures of the two small business investment company subsidiaries (SBIC, 3.26 percent on average) come due.
Then there are benchmark rates. 61 percent of the debt investments (at cost) carry floating rates, while 91 percent of Main Street’s own debt is fixed. Falling rates therefore squeeze income: according to the table in the quarterly report, a benchmark rate one percentage point lower costs about $0.23 of net investment income per share per year; two points cost $0.46. Almost all floating-rate loans do have a contractual rate floor — but the math shows how much of the monthly dividend’s coverage depends on the rate level.
What the Stock Costs
At the closing price of $54.18 on October 7, 2026, and 93,508,461 shares (as of August 6, 2026), Main Street is worth about $5.07 billion on the stock market. Cross-check against a price from the filings: the new shares of the first half went out at an average of $55.43 — the current price is only a little over 2 percent below that.
The right yardstick for a BDC is the price-to-NAV ratio: $54.18 divided by $33.92 is about 1.60. It was 1.66 at the end of 2016, 1.38 at the end of 2022, 1.85 at the end of 2024 and at times 2.06 in the third quarter of 2025 (high price vs. net asset value per the annual report). Today’s figure is thus right in the middle of the range of the ten year-ends from 2016 to 2025 (1.38 to 1.85) — and far from the discount of more than 40 percent at which TriplePoint Venture Growth, which we have analyzed, traded. Measured from the share price, 2025 net investment income of $3.95 is an earnings yield of about 7.3 percent; the price-to-NII ratio is just under 14. The regular monthly dividend of $0.265 annualizes to a yield of about 5.9 percent; with four supplemental dividends of $0.30 each it would be about 8.1 percent — as long as income and the tax cushion keep stretching that far.
The key figures box above shows a much lower price-to-earnings ratio of about 11. That is not a contradiction: that metric divides the price by total results for the last four quarters including changes in value and realized gains (our own calculation from the filings: about $4.98 per share), while we use only recurring net investment income. Because changes in value swing widely from year to year, the P/E ratio is the less reliable yardstick for a BDC.
One last thought on returns: Main Street earns its 15 percent return on equity on net asset value. Someone buying at 1.60 times net asset value gets about 9.4 percent of that on their purchase price — still decent, but not 15.
Upside and Risks at a Glance
What speaks for Main Street Capital:
- Internal management: no external management fees, operating expenses excluding interest of 1.3 percent of assets (2024, 2025 and the twelve months to June 2026).
- Growing net asset value: from $22.10 (end of 2016) to $33.92 (June 30, 2026), up sixteen quarters in a row; return on equity of 15.0 percent over the twelve months to June 2026.
- Covered monthly dividend: net investment income of $1.90 vs. $1.56 of regular dividends in the first half of 2026; per the company, the regular monthly dividend has never been cut since 2007.
- Solid funding: asset coverage of 244 percent vs. the legal minimum of 150 percent, investment-grade ratings of BBB- with a stable outlook, liquidity of $1.153 billion after setting aside the note repayment.
- A second leg: the asset management business for third parties ($1.8 billion) contributed $8.7 million to net investment income in the second quarter of 2026.
What speaks against it:
- High premium: the price is about 60 percent above net asset value (October 7, 2026); in February 2026 the gap was 77 percent, and it can keep shrinking.
- NAV growth partly bought: about 61 percent of NAV growth from 2016 to 2025, and more than the entire gain in the first half of 2026, came from selling shares above net asset value.
- Total payout above income: $4.23 vs. $3.95 of net investment income (2025); in the first half of 2026, at $2.16, it also exceeded distributable NII of $2.05; the supplemental dividend depends on the tax cushion.
- Estimated values: 99.6 percent of investments have no market price; non-accrual loans at 4.0 percent of cost (June 30, 2026), up from 3.3 percent at the end of 2025.
- Costlier money, falling rates: $500 million at 3 percent repaid in July 2026; one percentage point lower benchmark rates cost about $0.23 of net investment income per share per year.
A Human Conclusion
Back to the payday effect. The feeling of being paid every month is backed by income at Main Street: the regular dividend is earned, costs are low, the balance sheet is solid, and net asset value per share has grown for years, which is not a given for BDCs. This is a good company — the filings offer little that argues against it.
But the filings also show that part of this success rests on the very premium investors pay for that good feeling. As long as buyers of new shares hand over $1.60 for one dollar of net assets, each of them mathematically raises net asset value per share for the existing shareholders. The next test is the third-quarter report, expected in early November 2026 (last year it came on November 7): it will show whether problem loans stay at 4.0 percent, how much the costlier replacement for the old notes weighs and how much cushion is left for supplemental dividends. Until then, one simple question helps against the payday effect: would you still like this company if it traded at net asset value? The decision is yours.
Sources
All original documents used — to check for yourself with the U.S. securities regulator, the SEC (EDGAR):
- Main Street Capital — Quarterly report 10-Q for the second quarter of 2026 (filed August 7, 2026)
- Main Street Capital — Second-quarter 2026 earnings release, 8-K Exhibit 99.1 (August 6, 2026)
- Main Street Capital — Second-quarter 2026 investor presentation (FWP, August 7, 2026)
- Main Street Capital — Dividend release, 8-K Exhibit 99.1 (August 4, 2026)
- Main Street Capital — 8-K on the at-the-market program (August 12, 2026) and prospectus supplement 424B3 (August 12, 2026)
- Main Street Capital — Preliminary second-quarter 2026 results, 8-K Exhibit 99.1 (July 16, 2026)
- Main Street Capital — Quarterly report 10-Q for the first quarter of 2026 (May 8, 2026)
- Main Street Capital — Annual report 10-K for 2025 (filed February 27, 2026, auditor Grant Thornton)
- Main Street Capital — Quarterly report 10-Q for the third quarter of 2025 (November 7, 2025) and for the second quarter of 2025 (August 8, 2025)
- Main Street Capital — Annual report 10-K for 2024 (February 28, 2025)
- Fundamental data (price history, as of October 7, 2026); market value, price-to-NAV ratio and yields calculated by us from the filings.
This analysis is a journalistic assessment based on publicly available company filings. It is not investment advice and not a solicitation to buy or sell securities. Stocks can lose value, up to and including a total loss. All figures carry the date of their source; prices are dated snapshots. Positions held by the operator are disclosed daily; where one exists, it appears as a notice at the top of this deep dive.
Key figures at a glance
All monetary figures in millions of $; earnings per share as reported.
| Metric | 2021 | 2022 | 2023 | 2024 | 2025 |
|---|---|---|---|---|---|
| Revenue | 411.2 | 331.2 | 612.5 | 724.7 | 644.5 |
| Operating Income (EBIT) | 363.6 | 343.2 | 451.1 | 538.7 | 520.2 |
| Net Income | 330.8 | 241.6 | 428.4 | 508.1 | 493.4 |
| Net Margin | 80.4% | 73.0% | 70.0% | 70.1% | 76.6% |
| Earnings Per Share | 4.80 $ | 3.24 $ | 5.23 $ | 5.74 $ | 5.52 $ |
Source: fundamental data & SEC filings (annual and quarterly reports, 10-K/10-Q)
Our Bottom Line at a Glance
- Business model and costs positive
- Internally managed, with no external management fees; operating expenses excluding interest of 1.3 percent of assets (2024, 2025). The second leg is an asset management business for third parties with $1.8 billion (June 30, 2026).
- Net asset value positive
- From $22.10 (end of 2016) to $33.92 per share (June 30, 2026), up sixteen quarters in a row; about 61 percent of the 2016–2025 increase, however, came from selling shares above net asset value.
- Payout neutral
- The regular monthly dividend is covered, at $1.56 against $1.90 of net investment income (first half of 2026). Including supplementals, Main Street has paid out more than recurring income since 2024 (2025: $4.23 vs. $3.95).
- Credit quality and valuation neutral
- 99.6 percent of investments have no market price (June 30, 2026). Non-accrual loans at 4.0 percent of cost, up from 3.3 percent at the end of 2025; at fair value 1.1 percent, the difference already written down.
- Funding positive
- Asset coverage of 244 percent vs. the legal 150 percent, investment grade (BBB-, stable). The $500 million of 3 percent notes was repaid in July 2026; by our rough estimate the replacement costs about $0.13 per share a year.
Main Street Capital is an internally managed BDC with low costs, a solid balance sheet and net asset value that has grown for years. The regular monthly dividend is earned; the supplemental dividend depends on a cushion of earlier excess income and realized gains. A large part of the NAV growth comes from selling new shares at a price about 60 percent above net asset value. Not investment advice.
What Our Rating Means
Quality confirmed
Business model, numbers and balance sheet hold up to our review. Whether the current price supports an entry is a separate question — it hangs on the price, not on the company.
Green, because the quality of the business is documented: the business model has worked for almost two decades, costs are low thanks to internal management, the balance sheet is solid with 244 percent asset coverage and investment-grade ratings, net asset value per share is growing, and the regular monthly dividend is covered by income. Problem loans (4.0 percent at cost) are visible and largely written down. The rating says nothing about price: buying at 1.60 times net asset value means paying a premium that has already shrunk from 77 to about 60 percent and on which part of the NAV growth itself depends. At this price the stock is no bargain — but the company behind it is a good one. The decision is yours.
A journalistic assessment by our editorial team at the time of the deep dive, based on public sources — not investment advice and not a solicitation to buy or sell. Your personal circumstances (investment goals, risk capacity, taxes) cannot be taken into account. What our levels mean, how verdicts are formed, and what conflicts of interest exist →
Worth Noting
- This analysis was prompted by the forum hot list of the German investor portal wallstreet-online (most-discussed stocks among German private investors), early October 2026. The common thread is the payday effect: the feeling of regular monthly dividends makes investors forget what they are paying for them.
- Evidence base: all company figures come from SEC filings (annual reports on Form 10-K for 2024 and 2025, quarterly reports on Form 10-Q through the second quarter of 2026, current reports on Form 8-K through August 12, 2026). There was no further 8-K between August 12 and October 8, 2026.
- Our own calculations: sum of the accretive effects from stock offerings ($6.34) and dividend reinvestment ($1.05) for 2016 through 2025 from Note F of the 2025 annual report; NAV growth from $21.24 to $33.33; market value of 93,508,461 shares times $54.18; added cost of the note refinancing at $500 million times about 2.5 percentage points.
- Net investment income for 2023 and 2024 is shown as revised in 2025 (taxes deducted within NII); Main Street left the figures for years before 2023 unchanged in the same table, so we compare net investment income only from 2023 on.
Stock Watch
This analysis is as of October 8, 2026. Stock Watch will tell you what's changed at MAIN since then.
Later $1 a month per stock — signing up is free, and you'll be the first to know when it launches.
The full analysis as a PDF for later
We will send you this analysis as a PDF — to print, file away, and read at your own pace. And we will add you to the free Stock Watch list for Main Street Capital Corporation (MAIN), so you hear about it when something material in this analysis changes.
Frequently Asked Questions
Houston-based Main Street Capital lends to small and mid-sized U.S. companies and holds equity stakes in many of them. As of June 30, 2026, it held investments with an estimated value of $5.75 billion, spread across 94 lower middle market companies with both debt and equity, 86 private loan borrowers and other holdings. It also manages $1.8 billion for third parties.
A BDC is a listed U.S. investment company that provides loans and equity to private companies. It pays no corporate income tax if it distributes at least 90 percent of its taxable income. Its debt may be at most twice its equity; as of June 30, 2026, Main Street’s asset coverage ratio was 244 percent.
Investors pay for internal management with low costs, years of rising net asset value and a monthly dividend that has never been cut. On October 7, 2026, the price of $54.18 was about 60 percent above net asset value of $33.92 (June 30, 2026). Main Street itself warns in its annual report that such premiums may be unsustainable over the long term.
The regular monthly dividend is: in the first half of 2026, $1.56 of regular dividends compared with $1.90 of net investment income. Including supplemental dividends of $0.30 per quarter, Main Street has paid out more than recurring income since 2024 (2025: $4.23 vs. $3.95). The rest comes from undistributed taxable income ($1.15 per share at the end of 2025), which arises from income in excess of dividends and periodic realized gains.
Its staff are employed by Main Street itself; there is no external adviser charging a base fee on assets and an incentive fee. Operating expenses excluding interest were 1.3 percent of average assets in 2024 and 2025. For comparison: as adviser to the externally managed MSC Income Fund, Main Street itself receives 1.5 percent as a base fee alone.
The quarterly report for the third quarter of 2026 is expected in early November 2026; last year Main Street filed it on November 7, 2025. The figures to watch are the share of non-accrual loans (most recently 4.0 percent at cost), net asset value per share (most recently $33.92) and interest expense after the repayment of the 3 percent notes in July 2026.
Found an error?
Did you spot a factual error, an outdated number, or a typo in this deep dive? Let us know briefly — your report goes straight to the editorial team.