Jentech: The Stock With Ten-Percent Days
Jentech Precision has more than tripled in twelve months, with single-day swings of over ten percent — the chart alone is enough to trigger the fear of missing out. We read the Taiwanese cooling-tech maker's investor presentations and quarterly figures: the business is genuinely growing fast and margins just hit fresh records — but two product lines keep shrinking, and the valuation is already stretched even by AI-cooling-story standards. Not investment advice.
 Thomas Mücke
Founder & Publisher
Thomas Mücke
Founder & Publisher
FOMO — the fear of missing out — is one of the most reliable triggers of bad investment decisions. It hits hardest when a chart looks exactly like what Jentech Precision Industrial has delivered over the past twelve months: a stock price climbing from TWD 1,905 (Aug. 28, 2025) to TWD 5,785 (Aug. 28, 2026) — more than tripling, with individual days moving over ten percent in either direction. A chart like that creates a pull: if you weren't in, you want in now, before "it's too late." That's exactly why it pays to step back and read the Taiwanese cooling-hardware maker's investor presentations and quarterly figures — before the chart alone makes the decision for you. All figures in this analysis are evergreen and carry their own as-of date; the price of TWD 5,785 serves only as a valuation anchor from Aug. 28, 2026, the same day the stock hit its 52-week high.
What Jentech actually does
Any high-performance electronics generate waste heat that has to be carried away — otherwise the chips inside throttle or fail. Jentech Precision, founded as a tooling shop in Taiwan in 1987 and listed on the Taiwan Stock Exchange since Nov. 18, 2009, has built its business around exactly that problem: heat spreaders and vapor chamber lids at the package level, plus air- and liquid-cooling modules at the system level for servers and electric vehicles. The company also makes IC sockets and loading mechanisms, RF connectors, cold plates for EV batteries and controllers, and semiconductor and LED leadframes. By its own account, Jentech ranks among the world's three largest vapor-chamber suppliers, with long-standing supply relationships to AMD, Intel and Nvidia — backed up by documented recognitions such as AMD's "Best Service Award," TSMC's 2025 "Excellence in Production Support" award, and Amkor's "Supplier Excellence Award."
Production runs across six sites in two countries: the Huaya headquarters plus Dayuan Plant 1 and 2 in Taoyuan City, Taiwan, and two plants in Wuxi plus one in Nantong, China. Sales and customer-support offices exist in Phoenix, Arizona (USA), Munich (Germany), Kumamoto (Japan) and Penang (Malaysia). As of Nov. 28, 2025, Jentech employed 2,711 people in Taiwan and 892 in China — 3,603 combined, up from 3,196 a year earlier (2,385 plus 811, as of Dec. 4, 2024). In capital terms, the company is fairly modest — registered capital of about TWD 1.43 billion (as of December 2024) and 147,203,878 shares currently outstanding — meaning the roughly $27 billion market capitalization comes almost entirely from the run-up in share price, not from a particularly large share count.
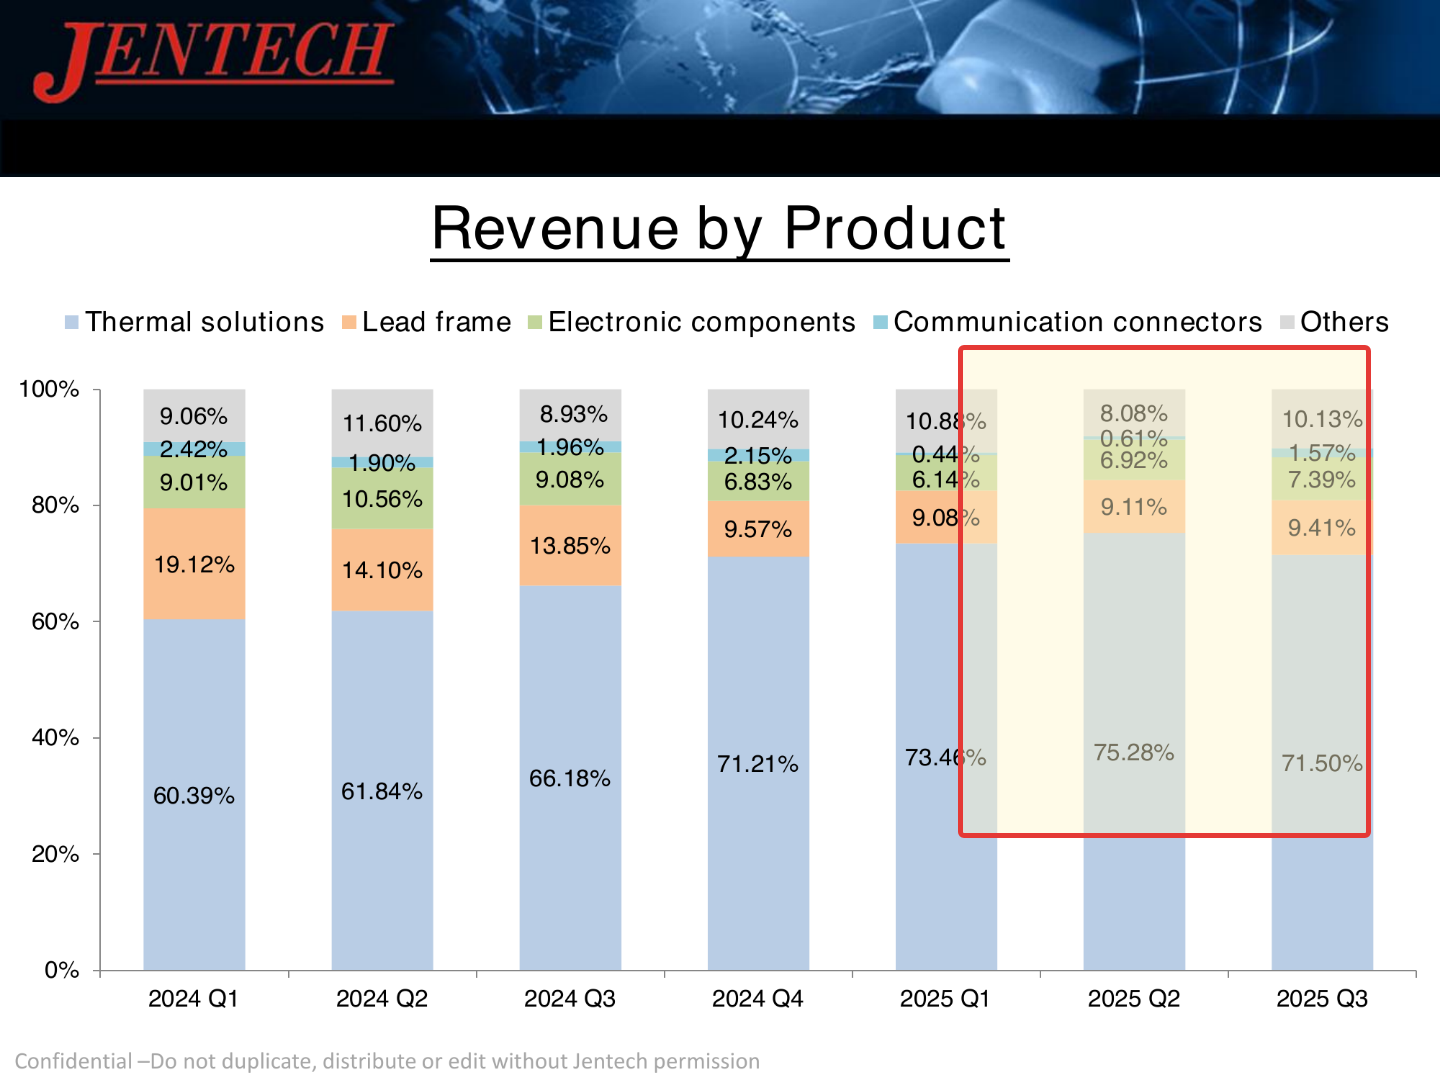
By revenue, the business is now clearly weighted toward Thermal Solutions: in Q3 2025, 71.5 percent of revenue came from heat spreaders and liquid cooling, 9.4 percent from leadframes, 7.4 percent from other electronic components, 1.6 percent from communication connectors, and 10.1 percent from other business lines (Investor Conference, Nov. 28, 2025, p. 23). If you already know a comparable Taiwanese cooling-tech supplier: we've previously analyzed Sunonwealth, a direct competitor serving the same server market with fans rather than heat spreaders — both companies show the same underlying pattern of a fast-growing AI-server business sitting next to an older, slower-growing core.
Company history for investors
-
1987
Founded in Taiwan
Jentech starts as a tooling shop — nearly four decades before today's AI-cooling story.
-
2009
Listed on the Taiwan Stock Exchange
The stock begins trading on the TWSE on Nov. 18, 2009.
-
2019
Stake in struggling rival Kenly
Jentech invests TWD 314 million for a 37.78% stake in Kenly Precision — a competitor with five straight years of losses.
-
2024
Full stock-swap acquisition of Kenly
The consolidation of the rival, begun in 2019, is completed via a share exchange.
-
2025
Capacity plan revised
The Nov. 28, 2025 investor conference pushes Dayuan Plant 1's completion back one quarter to early 2026, while pulling forward the timeline for the larger Aerotropolis plant.
Where this stock landed on our desk
The trigger for this analysis is the price chart itself: a stock that has tripled within a year, with single-day swings of more than ten percent — including Aug. 17, 2026, when the price jumped roughly ten percent in a single print with essentially no intraday trading range. A chart like that creates exactly the psychological pressure that defines FOMO: the worry of missing a move that's already underway. We wanted to know whether a business stands behind the fireworks that justifies the move — or whether the chart has already outrun the story.
The numbers over the years
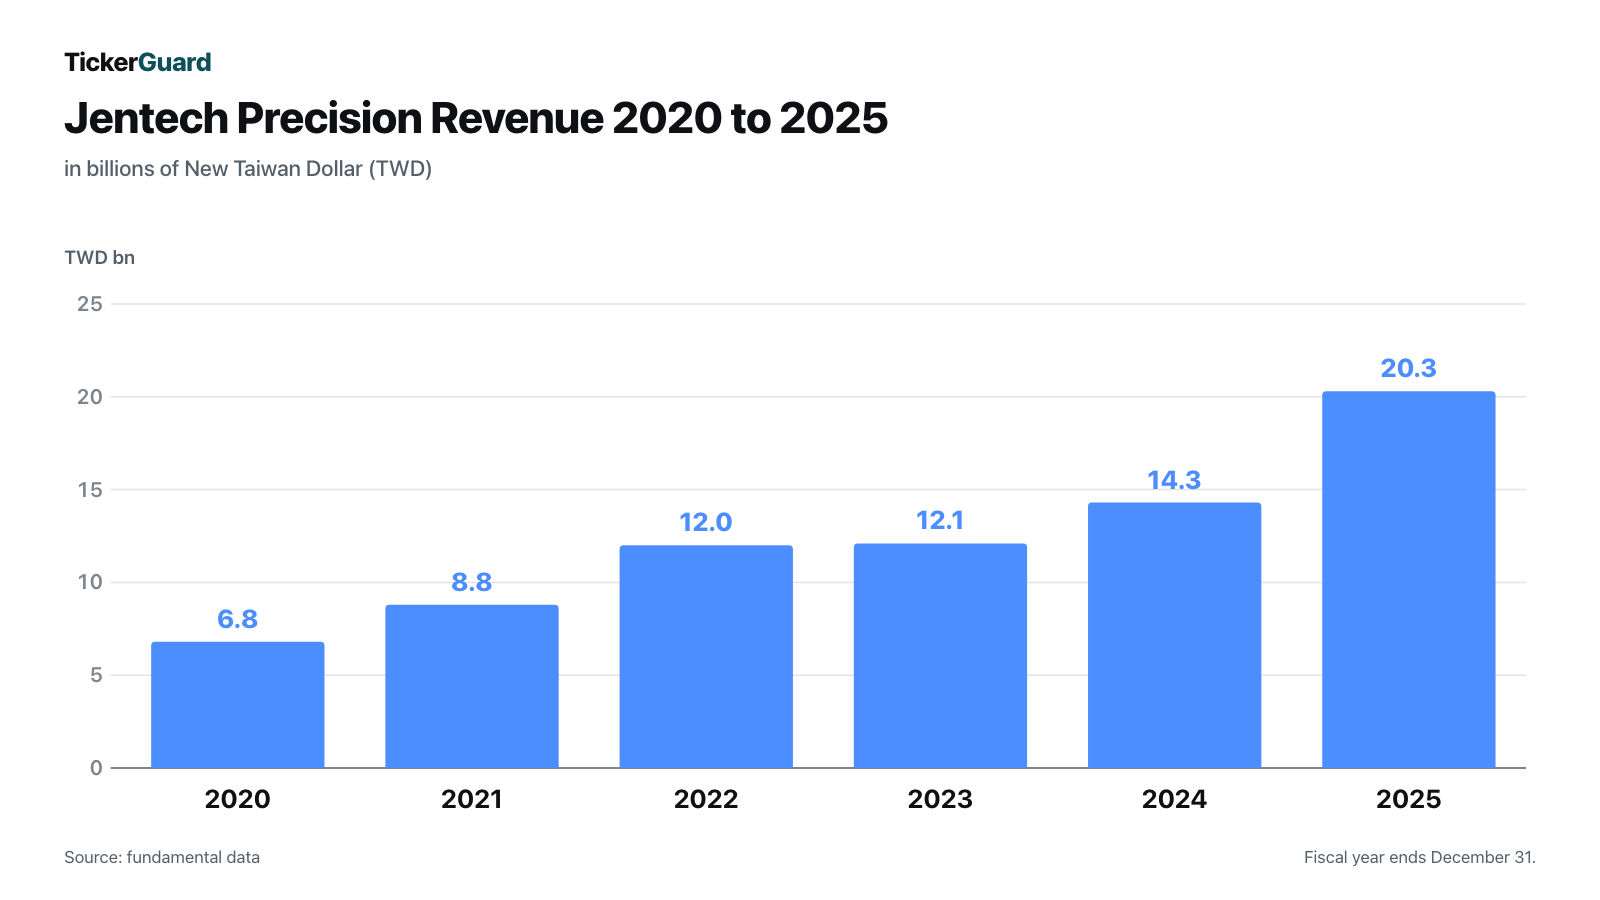
Jentech's revenue nearly tripled between 2020 and 2025: from TWD 6.85 billion, through TWD 8.80 billion (2021), TWD 12.03 billion (2022) and TWD 12.06 billion (2023, essentially flat), to TWD 14.28 billion (2024) and finally TWD 20.28 billion in 2025 — up 42 percent year over year. Net income grew from TWD 1.00 billion to TWD 5.28 billion over the same period, with a temporary dip in 2023 (TWD 2.30 billion versus TWD 2.61 billion a year earlier), when profit fell even though revenue was flat. In the first half of 2026, the pace accelerated further: TWD 5.31 billion in revenue in Q1, TWD 7.27 billion in Q2 — up roughly 40 percent year over year (our own calculation from fundamental data: TWD 7,274.516 million versus TWD 5,181.404 million in Q2 2025).
The balance sheet has stayed essentially debt-free through this growth: as of Dec. 31, 2025, the company held TWD 9.13 billion in cash against only about TWD 100 million in short- and long-term bank debt — a net cash position of roughly TWD 9.03 billion. The equity ratio stood at about 82 percent, and free cash flow (operating cash flow minus capital expenditure) reached TWD 3.58 billion, up from TWD 2.26 billion a year earlier — despite capital expenditure that nearly doubled, from TWD 632 million (2024) to TWD 1.19 billion (2025), as the company builds two new plants in parallel.
What the investor conferences show
An honest note up front: for Jentech, there are no publicly available word-for-word transcripts with a question-and-answer section — an automated check of our transcript database (as of Aug. 31, 2026) found no entry at all for ticker 3653.TW. Instead, we reviewed the official investor conference presentations from Nov. 28, 2025 and Dec. 4, 2024 — slide decks with capacity, segment, and balance-sheet detail, but no word-for-word recorded exchange with analysts. That's weaker evidence than a transcript, and we flag it deliberately rather than gloss over it.
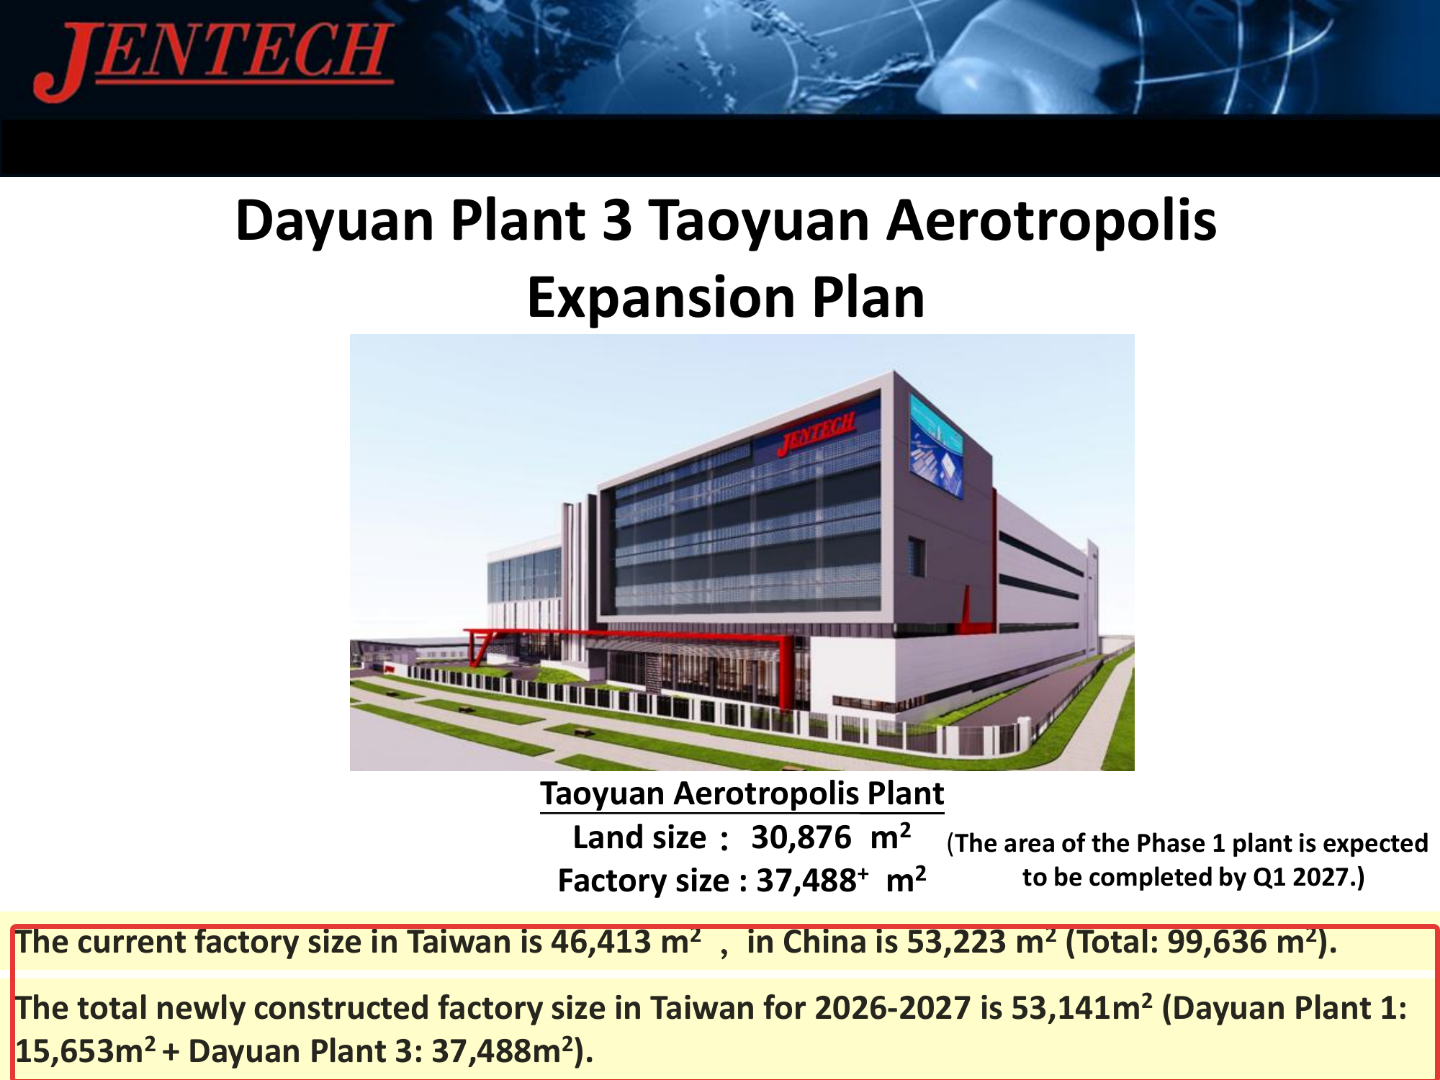
Comparing the two presentations shows a company revising its own timelines: in December 2024, Jentech said the expansion of Dayuan Plant 1 was "expected to be completed by Q4 2025." A year later, in November 2025, the same (by then enlarged) project read "expected to be completed by Q1 2026" — a one-quarter slip. At the same time, the timeline for phase 1 of the larger Aerotropolis plant moved up from "Q4 2027" to "Q1 2027." Together, the two projects are meant to more than double Taiwan floor space from 46,413 to roughly 99,554 square meters.
"The current factory size in Taiwan is 46,413 m², in China is 53,223 m² (Total: 99,636 m²). The total newly constructed factory size in Taiwan for 2026–2027 is 53,141m² (Dayuan Plant 1: 15,653m² + Dayuan Plant 3: 37,488m²)."
— Jentech Precision Industrial, Investor Conference, Nov. 28, 2025, p. 8
On 2026 growth prospects, the company itself draws a clear line between product lines: heat spreaders and liquid-cooling modules (whose application the company's own slide labels explicitly as "AI Server") get the highest confidence rating in the deck, while server loading mechanisms/sockets and leadframes get noticeably less. That's a detail that never shows up in a pure price-chart story but comes straight from the company's own presentation — more on that in the next section.
What the numbers reveal — the uncomfortable truths
Uncomfortable truth #1: Near-zero beta despite record volatility — the swings are homemade
Jentech stock swings hard: annualized 30-day volatility stands at 86.4 percent per fundamental data, and 250-day volatility at 72.9 percent — numbers you'd expect from a speculative biotech name, not a cooling-hardware supplier. Yet the same data source shows a beta of just 0.063, essentially no correlation with the broader market. That combination is the real FOMO engine: the price action is driven almost entirely by company-specific factors, not by a broad market move you could contextualize. A look at the ownership structure offers a plausible explanation: only about 59 percent of the 147.2 million shares are considered free float (86.3 million shares), against an insider ownership rate of roughly 38 percent. That concentrated a shareholder base means relatively modest trading volume can move the price sharply — on Aug. 17, 2026, the stock traded, per price history, with essentially no intraday range at all (open, high, low, and close identical), a pattern more consistent with thin liquidity than a widely traded stock.
Uncomfortable truth #2: Two product lines shrink in the middle of an AI boom — and Jentech says so itself
The Nov. 28, 2025 investor conference presentation breaks revenue into five product lines: while Thermal Solutions grew 77 percent year over year in Q3 2025, communication connectors shrank 35 percent and leadframes 9 percent in the same period. Both used to be far larger segments — leadframes alone made up 19.1 percent of revenue in Q1 2024, versus just 9.4 percent most recently. Notably honest: the company itself gives these two segments the lowest confidence rating anywhere in its own 2026 growth outlook (3 out of 5 and 4 out of 5 "smileys"), while heat spreaders and liquid cooling score 4 to 5 out of 5. The AI-cooling story, in other words, doesn't lift the entire company equally — it's concentrated in a growing but not exclusive part of the business.
Uncomfortable truth #3: Margin fell for two straight quarters — before turning to a fresh record
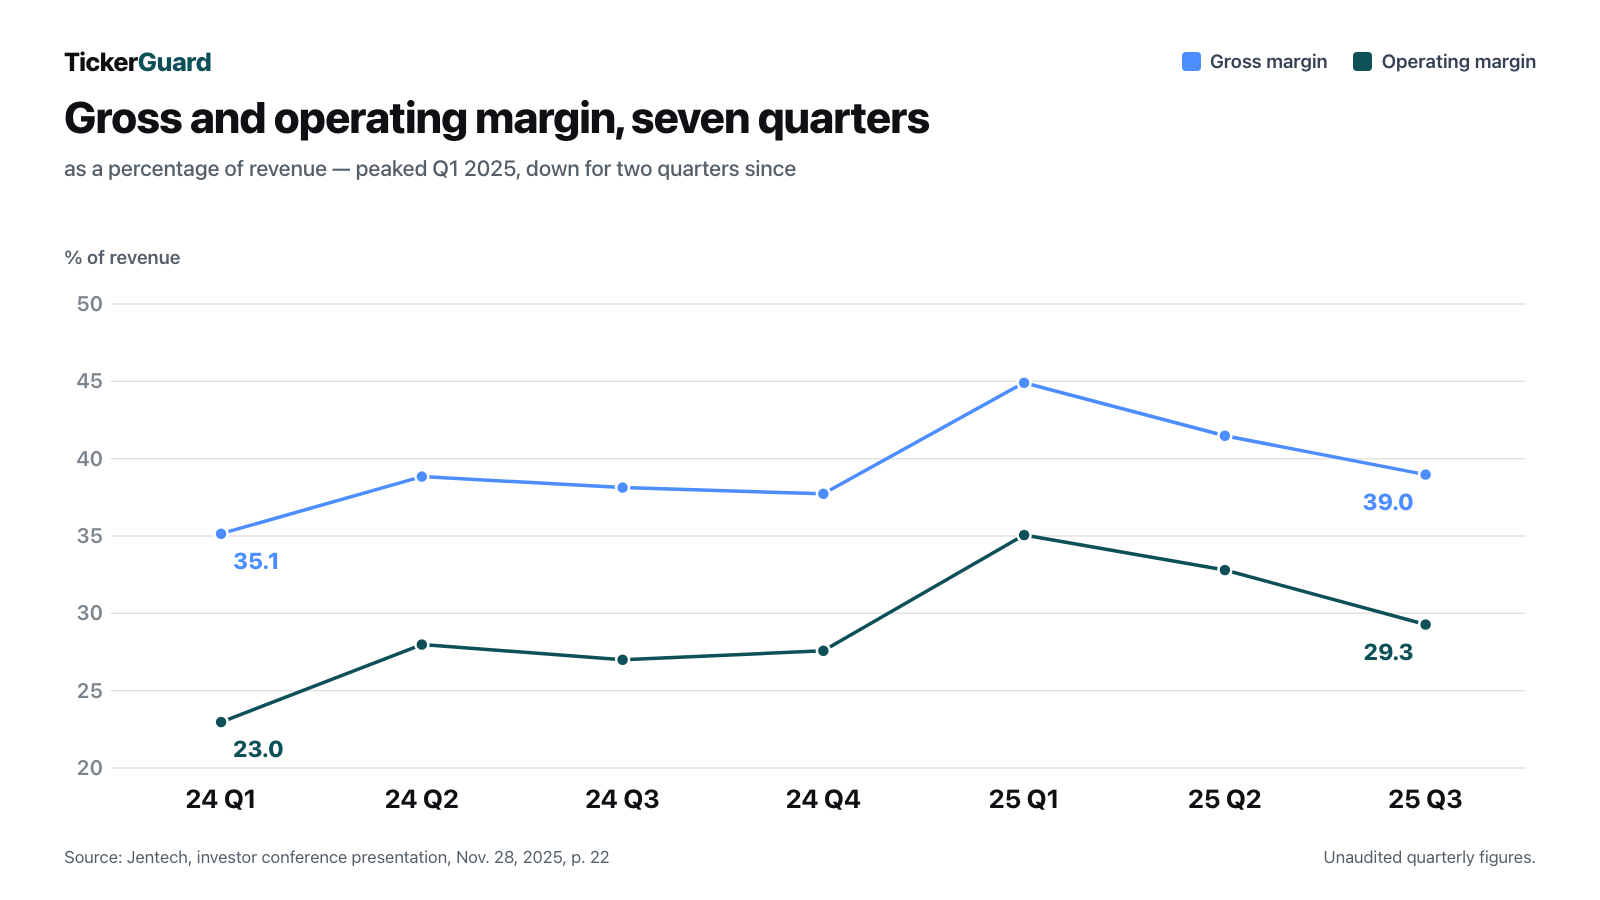
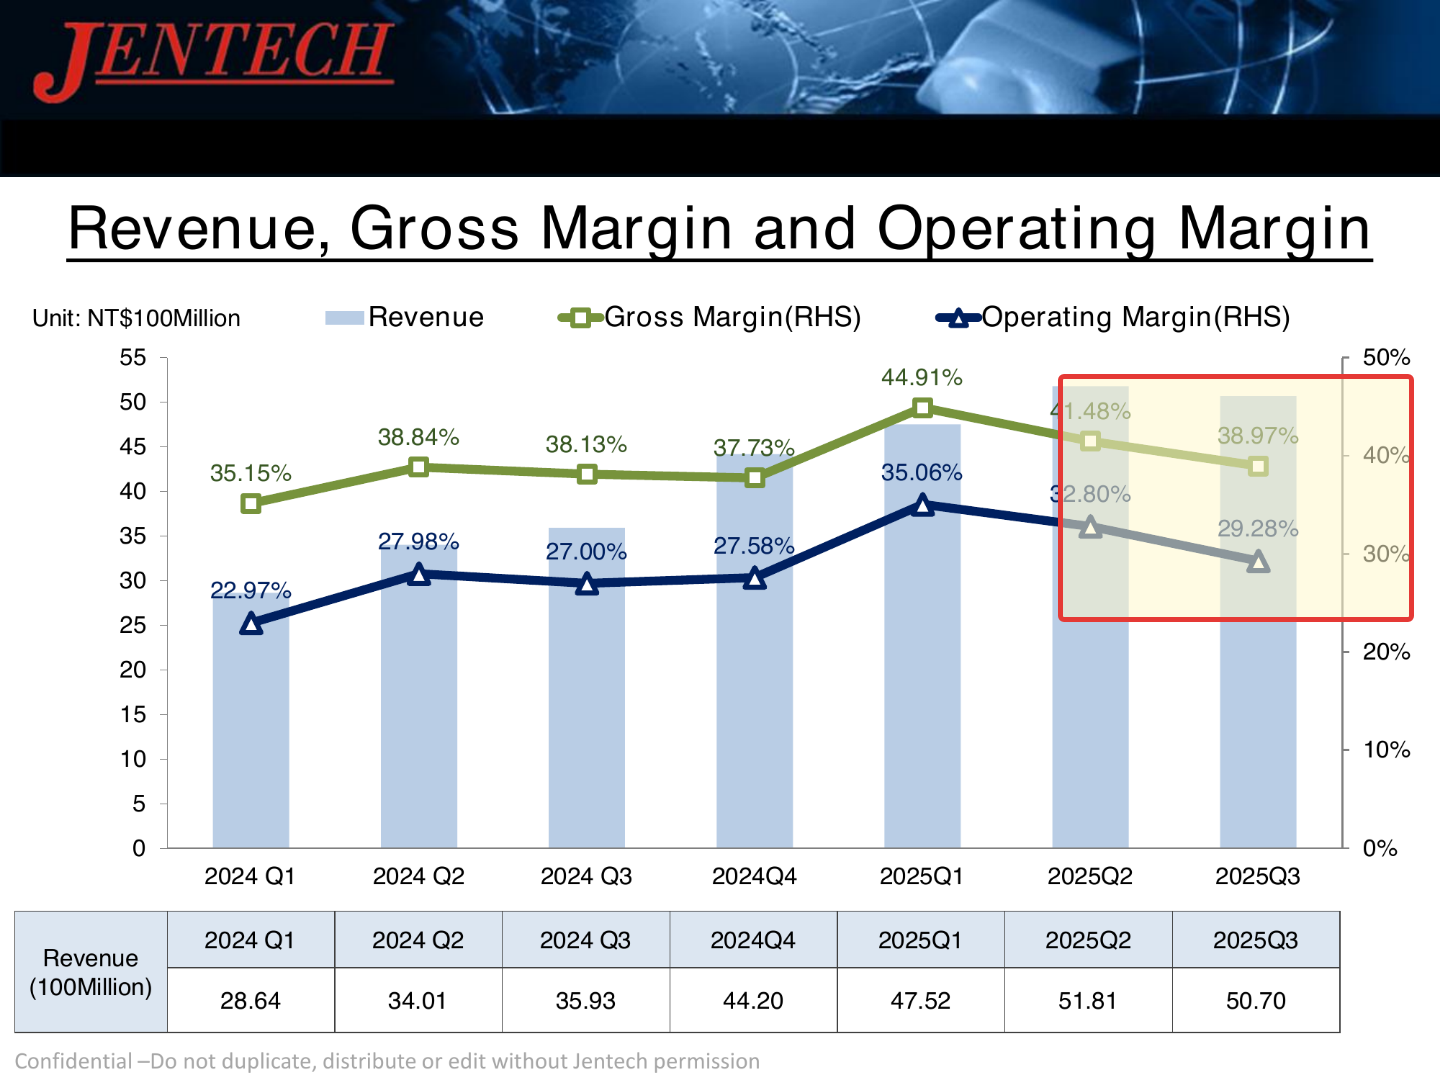
Anyone reading only the November 2025 investor presentation sees a clear downtrend: gross margin fell from a high of 44.91 percent in Q1 2025, through 41.48 percent (Q2), to 38.97 percent in Q3 2025, with operating margin sliding from 35.06 to 29.28 percent over the same stretch. A plausible first read: the margin-rich early phase of the AI-cooling story is already normalizing. More recent figures contradict that, though: fundamental data lets us calculate that gross margin recovered to 41.3 percent in Q4 2025, held at 41.1 percent in Q1 2026, and hit a fresh record of 46.2 percent in Q2 2026 — above the prior high from Q1 2025. Operating margin climbed the same way, from 29.3 percent through 31.3 and 32.0 percent to 37.8 percent in Q2 2026 (our own calculation: TWD 2,749.185 million operating income on TWD 7,274.516 million revenue). The lesson isn't "the margin is good" or "the margin is bad" — it's that a single investor presentation goes stale fast: anyone who read a downtrend into two declining quarters in November 2025 was already wrong one quarter later.
Valuation
With 147,203,878 shares outstanding and a price of TWD 5,785 (Aug. 28, 2026, also a 52-week high), market capitalization comes to roughly TWD 851.57 billion — about $26.88 billion or €23.20 billion (exchange rates as of Aug. 28/30, 2026: $1 = TWD 31.68, €1 = TWD 36.70). Fundamental data also lists market cap at TWD 851.57 billion — our own calculation matches almost exactly.
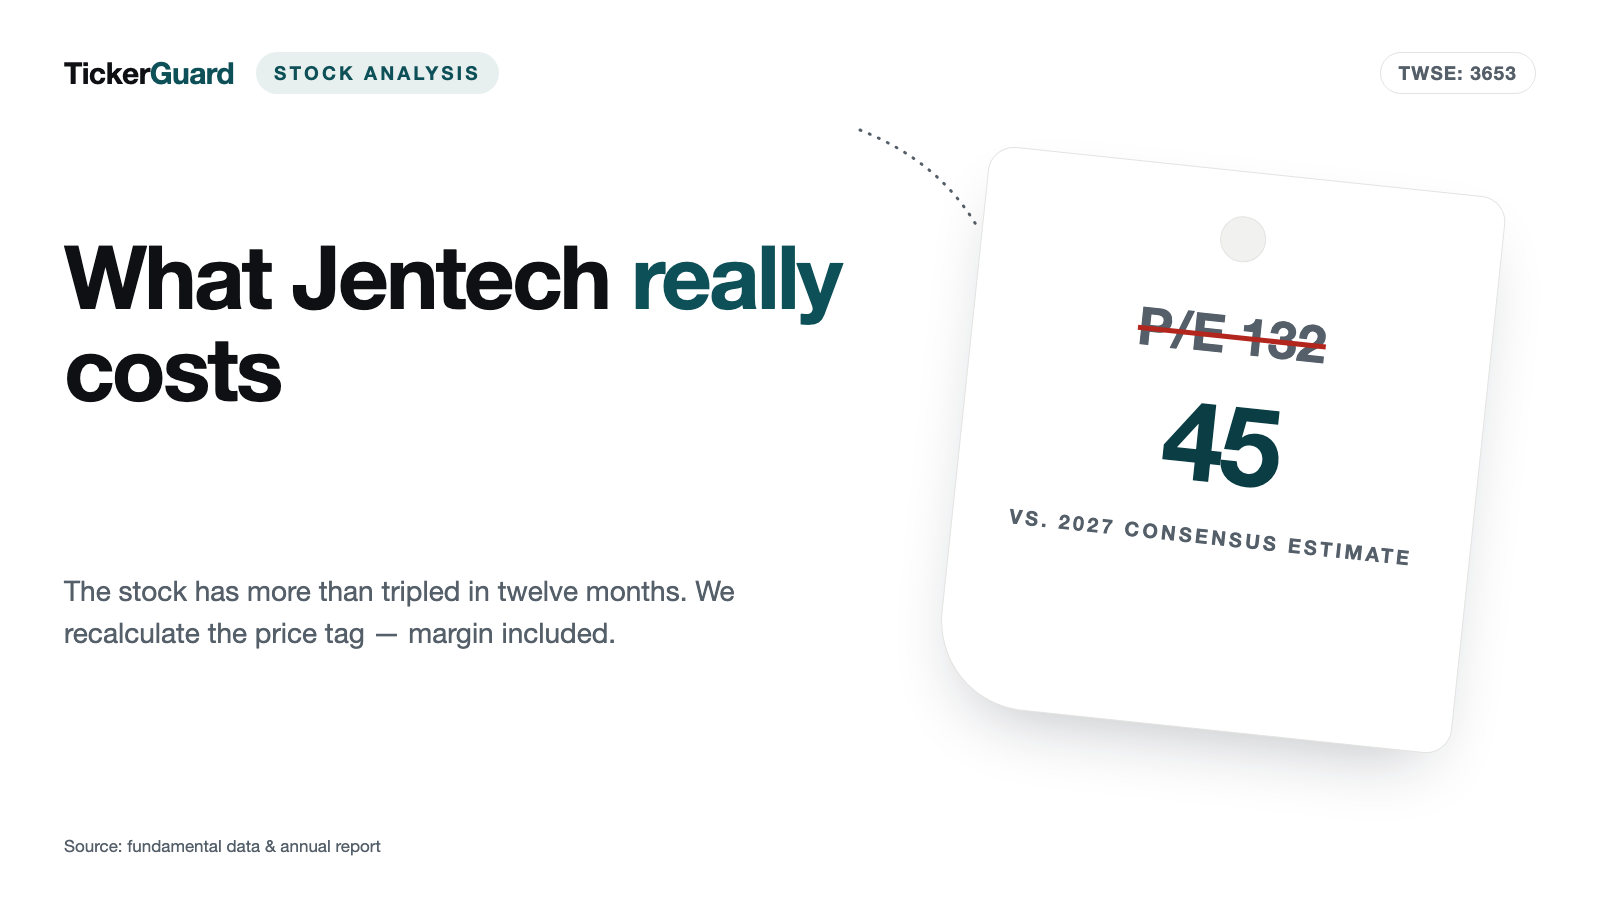
Based on trailing-twelve-month earnings per share (TWD 43.97), the trailing price-to-earnings ratio comes to roughly 132 — extremely high, even for a growing AI-supply-chain stock. Using the eight-analyst consensus estimate for fiscal 2026 (TWD 61.38 EPS, range TWD 55.78 to 70.94), the calculated P/E works out to roughly 94; for the 2027 estimate (TWD 129.79, range TWD 113.85 to 151.35, also eight analysts), roughly 45. The "forward P/E" figure bundled in the data set (49.3) doesn't reconcile with either of our own calculations and is therefore deliberately not cited. Even using the most optimistic available estimate — 2027 earnings — the stock is priced richer than most established industrial companies, which is at least understandable given the implied growth rate (the consensus estimate implies profit more than doubling from 2026 to 2027) but is by no means a margin of safety.
Against book value per share of TWD 160.69, the price-to-book ratio comes to roughly 36 — also very high. Dividend yield sits at roughly 0.4 percent (TWD 21.72 cash dividend, ex-date July 22, 2026, versus the current price). Multiplying the per-share dividend by the share count works out to roughly TWD 3.20 billion in total payouts against TWD 5.28 billion in 2025 net income — a calculated payout ratio of roughly 61 percent, moderate enough not to jeopardize the capacity-expansion spending. The stock trades well above all common moving averages (38-day line TWD 4,147.6, 50-day line TWD 3,985.7, 200-day line TWD 3,489.0, as of Aug. 28–29, 2026), with a 14-day RSI of 70, near the technically overbought zone.
Upside and risks at a glance
Upside: a structurally growing Thermal Solutions business (77 percent year-over-year revenue growth in Q3 2025), a margin that already hit fresh records in Q2 2026 after two weaker quarters, an essentially debt-free balance sheet with roughly TWD 9 billion in net cash, more than doubled Taiwan floor space planned by 2027 to secure growth, and long-standing supply relationships with AMD, Intel and Nvidia backed by documented quality awards. Risks: a valuation that still implies a roughly 45 P/E even against the most optimistic available earnings estimate (2027); two product lines (communication connectors, leadframes) that shrank in 2025 — by double digits for communication connectors, by single digits for leadframes — while the company itself gives them the lowest 2026 confidence rating; a growth story that depends on two large construction projects finishing on time, the first of which already slipped a quarter; extremely high price volatility (73 percent annualized) against a thin free float (roughly 59 percent) and about 38 percent insider ownership; and a family-influenced leadership structure (chairman and vice chairman share the same surname).
A human conclusion
FOMO works because there's a kernel of truth in it: Jentech isn't a mirage. Revenue is genuinely growing, margin has already recovered from a rough summer 2025, the balance sheet is essentially debt-free, and the supply relationships with the world's largest chipmakers are documented, not just claimed. That's exactly what makes the temptation to jump in now so strong. What the chart alone doesn't show: the valuation has already run so far that even the most optimistic available 2027 earnings estimate still implies a P/E of roughly 45 — a number that leaves no room for disappointment. And the story doesn't lift the whole company: two product lines are shrinking, one capacity milestone already arrived later than originally announced, and the extreme price volatility combined with a thin free float means an exit can be harder than the entry, if it comes to that. Anyone who only sees Jentech's tripled chart is missing a solid but already richly valued company. Anyone who only sees the sober numbers, in turn, is missing that — unlike with many pure hype stocks — the fundamentals genuinely grew alongside the story. The honest answer sits in between: a real, documented growth business at a price that already prices in a great deal of future success. Not investment advice.
Sources
This analysis draws on: Jentech Precision Industrial Co., Ltd.'s investor conference presentations from Nov. 28, 2025 and Dec. 4, 2024 (roughly 24 pages each, jentech.com.tw); the company website (company profile, history, locations, accessed Aug. 31, 2026); and fundamental data (price, valuation and balance-sheet metrics plus eight-analyst consensus estimates, as of Aug. 28–30, 2026). No publicly available word-for-word analyst-call transcripts exist for 3653.TW; our transcript search found no entry for this ticker (checked Aug. 31, 2026). Note: this analysis is journalistic coverage of publicly available information, not investment advice and not a recommendation to buy or sell.
Our Bottom Line at a Glance
- Growth positive
- Revenue rose 42 percent to TWD 20.28 billion in 2025 and grew roughly 40 percent year over year in Q2 2026, carried by the Thermal Solutions business (roughly 71.5 percent of revenue, Q3 2025).
- Margin in detail neutral
- Gross margin fell from 44.9 percent (Q1 2025) over two quarters to 39.0 percent (Q3 2025), then recovered by our own calculation and hit a fresh record of 46.2 percent in Q2 2026 — margin swings noticeably from quarter to quarter.
- Balance sheet and liquidity positive
- Essentially debt-free: about TWD 100 million in bank debt against TWD 9.13 billion cash (Dec. 31, 2025), roughly 82 percent equity ratio, TWD 3.58 billion free cash flow in 2025 despite nearly doubled capital expenditure.
- Segment and capacity risk neutral
- Two product lines (communication connectors, leadframes) shrank in 2025 — by double digits for communication connectors, single digits for leadframes; the company itself gives them the lowest 2026 growth confidence. The growth story also depends on two large construction projects, the first of which already slipped a quarter.
- Governance and ownership structure neutral
- Chairman and vice chairman share the same surname (Chao) — a sign of family-influenced control. Insider ownership roughly 38 percent, free float only about 59 percent — both documented, but no confirmed governance violations.
- Valuation negative
- Trailing P/E of roughly 132, calculated roughly 94 and 45 against the 2026/2027 consensus estimates — very high even against the most optimistic estimate. The stock has more than tripled in twelve months, with roughly 73 percent annualized volatility.
Jentech shows a business that is genuinely and strongly growing: revenue has nearly tripled since 2020, margin already hit fresh records after two weaker quarters, and the balance sheet is essentially debt-free. But the stock, which has more than tripled in twelve months, is already very richly valued — even against the most optimistic available 2027 earnings estimate, the P/E still comes to roughly 45. Add two shrinking product lines, a growth story that depends on capacity expansion arriving on time, and extreme price volatility against a concentrated shareholder base. Not investment advice.
What Our Rating Means
Quality confirmed
Business model, numbers and balance sheet hold up to our review. Whether the current price supports an entry is a separate question — it hangs on the price, not on the company.
The business model has held up for nearly four decades, the figures are consistently documented across multiple sources, the balance sheet is very healthy with net cash and a roughly 82 percent equity ratio, and there is no existential dependence on a single customer or counterparty. The shrinking secondary segments and family-influenced leadership structure are documented but not existential findings — they belong in the risk assessment, but they don't lower the quality rating. That the stock has tripled and trades at a very high P/E is a valuation argument, not a quality argument. The decision is yours.
A journalistic assessment by our editorial team at the time of the deep dive, based on public sources — not investment advice and not a solicitation to buy or sell. Your personal circumstances (investment goals, risk capacity, taxes) cannot be taken into account. What our levels mean, how verdicts are formed, and what conflicts of interest exist →
Worth Noting
- Hook for this analysis: the price chart itself — a tripling in twelve months with single-day swings of more than ten percent, classic breeding ground for FOMO decisions.
- Data as of: investor conference presentations from Nov. 28, 2025 and Dec. 4, 2024, fundamental data with figures through June 30, 2026 (as of Aug. 28–30, 2026).
- Risk of confusion: Jentech Precision Industrial (TWSE: 3653) is not the same as other similarly named firms in the Asian electronics-supply sector — this analysis refers exclusively to the Taiwan Stock Exchange-listed Jentech Precision Industrial Co., Ltd.
The full analysis as a PDF for later
We will send you this analysis as a PDF — to print, file away, and read at your own pace.
Frequently Asked Questions
Jentech Precision Industrial Co., Ltd. (TWSE: 3653), based in Taoyuan City, Taiwan, has made heat spreaders, vapor chamber lids and, increasingly, liquid-cooling modules for AI servers and electric vehicles since 1987, alongside IC sockets, connectors, and semiconductor leadframes. Thermal Solutions accounted for roughly 71.5 percent of group revenue in Q3 2025.
No. Jentech makes physical cooling hardware that gets installed in, among other things, AI servers — the company explicitly labels "AI Server" as an application area for its heat spreaders and liquid-cooling modules in its own presentations, but it doesn't sell AI software or AI models itself.
Jentech is listed on the Taiwan Stock Exchange (TWSE) and isn't SEC-registered — there is no 10-K, no 10-Q. Instead, it files quarterly reports and holds investor conference presentations. This analysis relies on the investor presentations from Nov. 28, 2025 and Dec. 4, 2024, plus fundamental data.
Gross margin fell from 44.9 percent (Q1 2025) over two quarters to 39.0 percent (Q3 2025) — the latest data point shown in the November 2025 investor presentation. More recent fundamental data shows margin already recovering in Q4 2025 and hitting a fresh record of 46.2 percent in Q2 2026.
Not by customer, but by product line: Thermal Solutions (heat spreaders, liquid cooling) made up roughly 71.5 percent of revenue in Q3 2025, while communication connectors (down 35 percent year over year) and leadframes (down 9 percent) shrank. The company itself gives these two segments the lowest growth confidence for 2026.
At a price of TWD 5,785 (Aug. 28, 2026), the trailing price-to-earnings ratio comes to roughly 132. Against the 2026 consensus estimate (TWD 61.38 EPS) the calculated P/E works out to roughly 94; against the 2027 estimate (TWD 129.79) roughly 45 — assuming those eight-analyst estimates hold.
No. An automated search (as of Aug. 31, 2026) found no publicly available word-for-word transcripts with a Q&A section for ticker 3653.TW. This analysis relies instead on the official investor conference presentations from Nov. 28, 2025 and Dec. 4, 2024.
Yes. On July 22, 2026 (ex-date), Jentech paid a cash dividend of TWD 21.72 per share, which works out to roughly 0.4 percent yield at the current price, on a calculated payout ratio of roughly 61 percent of 2025 net income (dividend times share count, divided by net income).
Found an error?
Did you spot a factual error, an outdated number, or a typo in this deep dive? Let us know briefly — your report goes straight to the editorial team.