Day-Trading Test: 53 of 58 Variants Failed — and the Gain Came Overnight
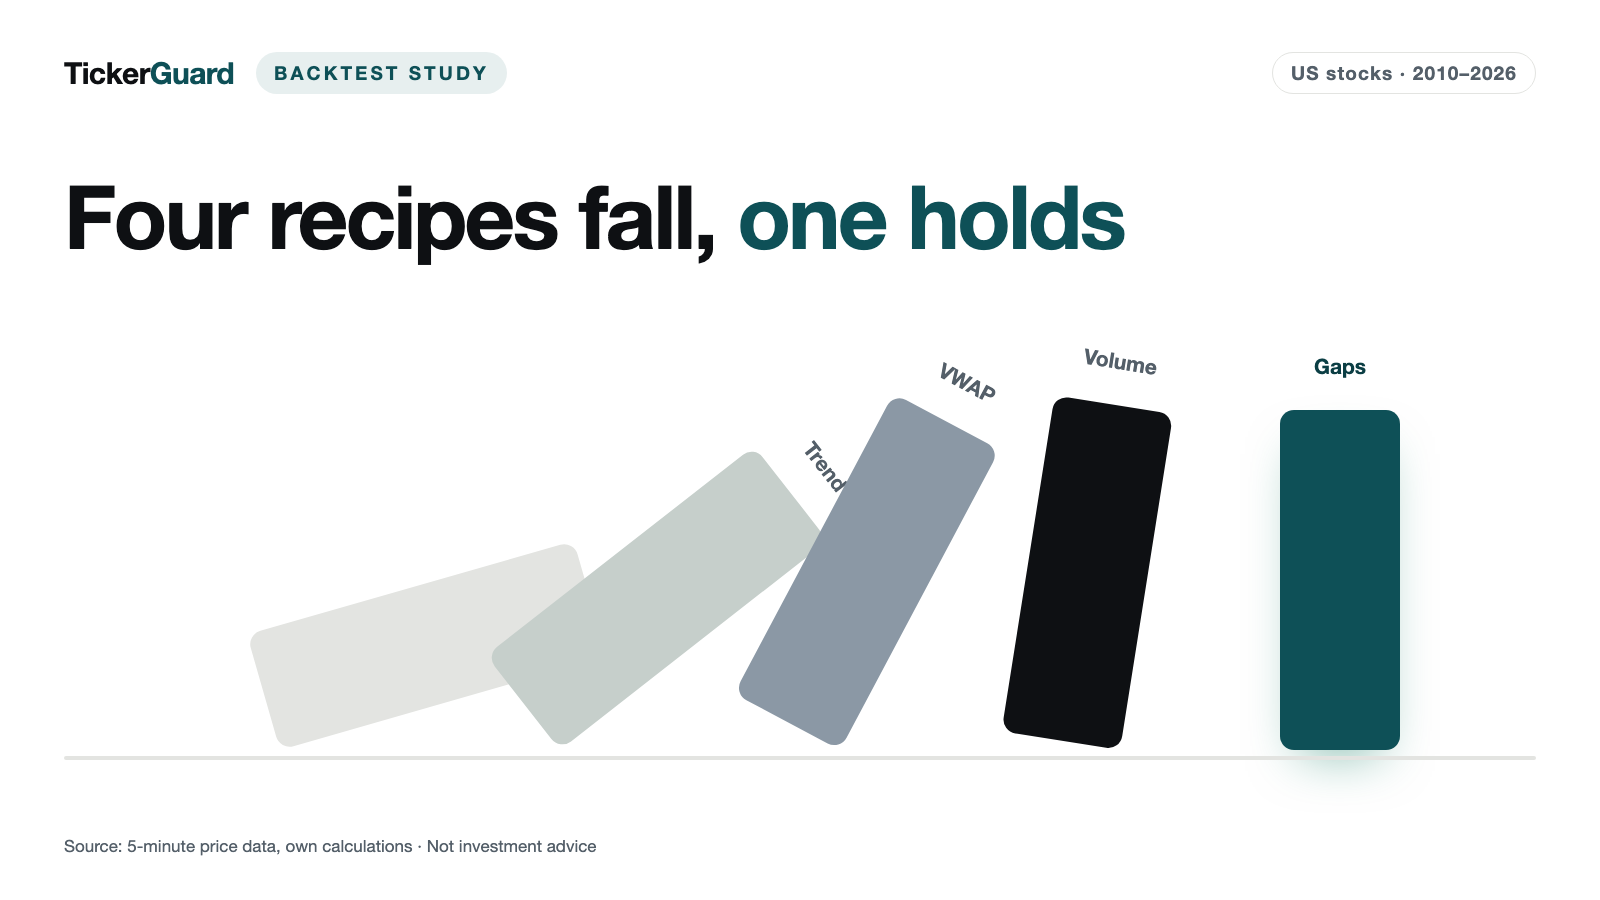
Five well-known day-trading recipes — a breakout, an opening gap, intraday momentum, and trend and reversion at the day’s average price — tested against 4,068 US stocks over sixteen years. Each recipe was run in several settings, 58 variants in this study: 53 of them failed. And roughly 90% of the price gain of the US stocks we analysed happened overnight — outside the hours in which these recipes trade at all.
 Thomas Mücke
Founder & Publisher
Thomas Mücke
Founder & Publisher
Day trading means buying a stock in the morning and selling it again the same day, without holding it overnight. The same handful of recipes has been passed around for decades. We tested five of them — against 4,068 US stocks, over sixteen years, on price data in five-minute candles.
Here are the five pre-registered recipes in plain words:
- Opening-range breakout. Right after the opening bell a stock marks out a first range between its high and its low. The rule buys as soon as the price pushes above that range, and mirrors that on the downside: below the range the stock is sold short — the expectation being that the first break sets the direction for the rest of the day.
- Opening gap. Sometimes a stock opens far higher or far lower than it closed the evening before, usually after news. The distance between the close and the open is the gap. Both sides were tested: going with the jump, or trading against it.
- Intraday momentum. The direction of the morning sets the sign: whatever rose in the first 30 minutes is bought for the last 25 trading minutes, whatever fell is sold short — the expectation being that the day’s move carries on into the close.
- Trend at the average price (VWAP). The VWAP is the volume-weighted average price of a day, that is, the price at which the stock actually changed hands on average that day. A stock trading above it in the morning is bought, one trading below it is sold short.
- Reversion to the average price. The opposite expectation: when the price slips well below the VWAP it is bought, on the assumption that it finds its way back to that average.
A sixth test, the volume spike, was added later: a sudden jump in price on enormous volume is bought and held for 25 minutes. It was not one of the original five and is reported separately throughout.
Each of the five pre-registered recipes was run not in one single version but in several sensible settings: a gap of 3, 5 or 10% and more, an opening range of 5, 15 or 30 minutes, with and without extra filters, upward as well as downward. Each of those settings is one variant, and together they make up the 58 variants of this study — 36 for the breakout, 12 for the gaps, 3 for momentum and 7 at the average price. The volume-spike add-on has 288 settings of its own and does not count towards those 58. Every rule was fixed before the first number existed.
The data base: 6,846,558 stock-days across the 4,068 US stocks in this study, drawn from five-minute price candles between 2010 and early August 2026. Because the rules were pre-registered, there was no chance to tune them after seeing what worked.
The result in four numbers
- 5 of 58 — only 5 of the 58 pre-registered settings passed our success criterion, and all 5 come from one single pattern, trading large opening gaps: four against the gap, one with it. Four of the five are short sales.
- +0.36% per trade — the average net return, after costs, of our flagship gap variant — the middle of the three rules that fade an upward gap, at 5% or more (the largest gaps paid more but occurred far less often in the period studied), where "average" means the winsorized mean: all trades summed and spread evenly, with the single most extreme 1% of results capped at each end so a handful of freak trades cannot swing the whole number — even after that capping, a few very large winners still pull the figure up.
- 39% hit rate, negative median — in that same variant, only about four in ten trades were winners, and the median trade — the typical result, half of all trades above it and half below — actually lost money (−0.73%). The positive average came entirely from a few very large winners.
- ~90% overnight — of the total price gain across the 4,068 US stocks in this study over sixteen years, roughly nine-tenths happened between the previous close and the next open — that is, in the hours when the market was shut and none of these recipes could trade.
In one sentence: across the five day-trading recipes tested in this study, only trading large opening gaps held up in the backtest after simulated costs — four variants against the gap, one with it — and even there, the typical trade lost money, and the plus came from a few very large winners.
Where the return of the stocks in this study came from
Before testing any recipe, it's worth asking a more basic question: when did the stocks in this sample earn their return? The answer is lopsided. Across 6.28 million overnight observations, the average return (all of them spread evenly) from the previous close to the next open was +4.77 basis points, a basis point being one hundredth of one percent. The same average from the open to the close was only +0.54 basis points.
| Year | Overnight (basis points) | Trading day (basis points) |
|---|---|---|
| 2010 | +5.39 | +3.23 |
| 2011 | +3.71 | −3.87 |
| 2012 | +3.87 | +3.58 |
| 2013 | +8.16 | +4.94 |
| 2014 | +4.73 | −0.50 |
| 2015 | −0.20 | −0.59 |
| 2016 | +1.10 | +6.40 |
| 2017 | +7.13 | +1.40 |
| 2018 | +4.32 | −8.23 |
| 2019 | +6.69 | +4.46 |
| 2021 | +11.62 | −3.47 |
| 2022 | −3.82 | −2.06 |
| 2023 | +5.09 | +2.94 |
| 2024 | +8.11 | −3.67 |
| 2025 | +3.13 | +3.94 |
| 2026 | +6.61 | +6.14 |
| All years combined | +4.77 | +0.54 |
Average return per stock and day, split into the time between two trading days (overnight) and the time during the trading day. One basis point is one hundredth of a percent. Based on 6,282,496 overnight and 6,330,469 daytime observations, before costs. Source: price data, own calculations.
Put together, roughly 90% of the total price gain happened overnight, while markets were closed, and only about a tenth during regular trading hours — the window in which the recipes tested here trade. The overnight return was positive in 14 of 16 years; the daytime return in only 9. For the stocks in this sample, the gain was largely collected before the trading day began.
A separate check on 24 very large US stocks and 95,886 overnight periods traded this effect directly: buy at the close, sell at the next open. After costs it turned negative, −6.66 basis points per night, positive in 0 of 16 years — the bid-ask spread would have needed to sit under about 0.017% per side to work, tighter than the cost assumptions used here. The overnight period carried almost the entire price gain, but it could not be cut out and traded on its own.
What this is about
The question is simple: did trading within a single day, using the five widely known recipes described above, produce a real advantage once realistic costs were subtracted? In the technical language used in this study they are the opening-range breakout, the gap fade and gap-and-go, the intraday momentum trade, and the trend and reversion rules around the day's average price — plus the volume spike added later. Those names reappear in the tables further down. Every entry, exit and firing condition was fixed before a single number was computed. This series sits alongside our other five-minute studies, including the death-cross study and the crash-reversal study on 5-minute candles.
Data and pre-registered design
The core universe (the first five recipes) draws on 4,361 US stocks with a market capitalization of at least $300 million at any month-end in 2020, of which 4,068 had days that could be evaluated, survivorship-free — delisted stocks stay in the history. Each stock-day also needed an opening price of at least $5, a prior-day dollar volume of at least $5 million, and at least 60 five-minute candles (36 on a short day): 6,846,558 stock-days across 4,110 trading days. The volume-spike add-on ran its own pass — 4,361 stocks checked, 11.77 million stock-days, 788 million candles in regular trading hours (9:30 a.m. to 3:55 p.m. New York time) — narrowing to 3,219 stocks and 3,984 trading days with a candidate signal.
"Success criterion (pre-registered): a cell pays if the net winsorised mean in the main cost tier is > 0, the 90% bootstrap interval does not contain zero, AND at least 3 of 4 time slices are positive. Anything else means: the signal does not pay."
Translated verbatim from this series' pre-registered design, written down before the first result was computed. The design calls a single setting a cell; this text calls it a variant throughout.
One publisher's decision applies throughout this study and every other backtest we publish: the year 2020 is left out of every figure and every average, because the pandemic crash and rebound would otherwise distort the picture on its own. That decision is made once here and not repeated at every number below.
The main cost tier in this study was 0.05% per side, 0.10% round trip, plus a small commission simulated on every trade. Fills are conservative: a signal completing at one candle fills at the next candle's open, not the signal price. Each variant had to clear a three-part bar: the winsorized mean (the average once the top and bottom 1% of results are capped, so a few freak trades can't swing it) had to be positive; a bootstrap interval (reshuffling entire trading days a thousand times to gauge how much the result could plausibly vary) had to exclude zero; and the result had to be positive in three of four time slices (the sixteen years split into four periods, so no result rides on one lucky era). Only 5 of 58 pre-registered variants cleared all three bars; 912 settings were computed, plus 288 for the volume-spike add-on.
The one pattern that held up in the backtest: large opening gaps
A gap is the difference between where a stock opens and where it closed the day before. Our gap-fade recipe waits for the first five-minute candle to close, then decides: "go" (trade with the gap) or "fade" (bet against it), with a stop at the extreme of that first candle. Fading is typically a short sale — borrowing shares to sell first, aiming to buy them back cheaper later, betting the price falls.
Five pre-registered variants cleared our bar, and every one of them is a gap trade — four of them short sales, whose borrow fee is not included. Fading upward gaps of 3%, 5%, and 10% or more all cleared the bar in the backtest, as did fading a downward gap of 5% or more, and going with (not against) the largest downward gaps of 10% or more.
| Rule | Trades | Hit rate | Median | Robust average | 90% interval | Positive time slices | Verdict |
|---|---|---|---|---|---|---|---|
| Gap up from 3%, fade | 52,665 | 36.0 % | −0.63 % | +0.211 % | [+0.111; +0.323] | 4/4 | pays |
| Gap up from 5%, fade | 18,597 | 38.7 % | −0.73 % | +0.362 % | [+0.241; +0.500] | 4/4 | pays |
| Gap up from 10%, fade | 4,244 | 39.9 % | −1.05 % | +0.564 % | [+0.407; +0.740] | 4/4 | pays |
| Gap down from 3%, fade | 50,179 | 34.8 % | −0.70 % | +0.081 % | [−0.084; +0.284] | 3/4 | does not pay |
| Gap down from 5%, fade | 16,624 | 37.9 % | −0.80 % | +0.245 % | [+0.000; +0.543] | 4/4 | pays |
| Gap down from 10%, fade | 3,636 | 39.2 % | −1.13 % | +0.268 % | [−0.004; +0.541] | 3/4 | does not pay |
| Gap up from 3%, go with it | 47,708 | 30.7 % | −0.81 % | −0.138 % | [−0.225; −0.047] | 0/4 | does not pay |
| Gap up from 5%, go with it | 16,430 | 32.4 % | −1.04 % | −0.151 % | [−0.270; −0.017] | 0/4 | does not pay |
| Gap up from 10%, go with it | 3,571 | 33.4 % | −1.45 % | −0.254 % | [−0.424; −0.072] | 0/4 | does not pay |
| Gap down from 3%, go with it | 45,019 | 29.9 % | −0.85 % | −0.066 % | [−0.212; +0.092] | 2/4 | does not pay |
| Gap down from 5%, go with it | 14,418 | 33.6 % | −1.06 % | +0.154 % | [−0.101; +0.437] | 3/4 | does not pay |
| Gap down from 10%, go with it | 3,245 | 38.8 % | −1.26 % | +0.708 % | [+0.486; +0.971] | 4/4 | pays |
All twelve pre-registered gap rules, net per trade after 0.05% cost per side plus commission, excluding the year 2020. "Fade" means against the direction of the gap, "go with it" means in its direction. The robust average trims the most extreme one percent at each end. Bold = the pre-registered success criterion is met. Source: price data, own calculations.
The pattern in one sentence: in the backtest, after a sharp gap up the day of the stocks in this study tended to give some of that move back — fading it produced a positive robust average even though most individual trades lost; after a sharp gap down, it was the direction of that first five-minute candle — not the direction of the gap — that tended to persist. One variant needs an honest caveat: fading a downward gap of at least 5% technically cleared the bar, but the lower edge of its plausible range sat at essentially zero (+0.00005%) — a borderline pass, not a clean one. A close cousin, fading a downward gap of at least 10%, narrowly missed, with a range that still included zero.
Going with an upward gap, rather than fading it, came back negative in the backtest at all three sizes; the smaller downward-gap variants missed the bar as well. The measured advantage, where it existed, held up across every one of the four time periods we tested it in.
| Rule | 2010-2015 | 2016-2019 | 2021-2023 | 2024-2026 |
|---|---|---|---|---|
| Gap up from 3%, fade | +0.243 % Trades 10,730 |
+0.199 % Trades 9,764 |
+0.163 % Trades 16,431 |
+0.243 % Trades 15,740 |
| Gap up from 5%, fade | +0.307 % Trades 3,411 |
+0.396 % Trades 3,839 |
+0.307 % Trades 5,648 |
+0.417 % Trades 5,699 |
| Gap up from 10%, fade | +0.514 % Trades 643 |
+0.400 % Trades 899 |
+0.690 % Trades 1,349 |
+0.549 % Trades 1,353 |
| Gap down from 5%, fade | +0.210 % Trades 3,223 |
+0.095 % Trades 3,522 |
+0.618 % Trades 4,684 |
+0.033 % Trades 5,195 |
| Gap down from 10%, go with it | +0.277 % Trades 529 |
+1.095 % Trades 797 |
+0.776 % Trades 971 |
+0.525 % Trades 948 |
Robust average per trade across four periods, for the five rules that met the success criterion. All four positive means the finding does not rest on a single market phase. Source: price data, own calculations.
Broken down into the four periods, the measured gap-fade advantage showed up in every one of them, without one period carrying the whole result. That consistency is one reason the pattern survived pre-registration where the others did not; related patterns showed up in our episodic-pivots study, which also examined sharp, news-driven price jumps.
Why the typical trade still lost
This is the part that matters most about the pattern. In every one of the five variants that held up in this study, measured in the backtest, the median trade — the typical outcome, with half of all trades doing better and half doing worse — was negative, ranging from −0.63% to −1.26%. Only 36% to 40% of trades were winners at all. That means six or seven trades out of ten lost money.
And yet the average (all trades summed and spread evenly, extremes capped) came out clearly positive, between +0.211% and +0.708%. Median and average diverged this sharply because a small number of very large winning trades pulled the average far above where the typical trade landed — the profit factor (gross profit from winners divided by gross loss from losers) ran between 1.20 and 1.44, meaning winners outweighed losers in dollar terms even though they were rare.
How outlier-dependent is that? Summed by year, the flagship gap-fade variant (fading an upward gap of at least 5%) put +24.89 percentage points into 2025 alone, out of 82.3 percentage points across all sixteen years — by far its strongest single year, a clear sign that a handful of exceptional trading days, not a steady weekly edge, drove the result. The arithmetic of the backtest rested on those rare large winners: without them the rule would have been negative, and most individual trades were not among them.
The opening-range breakout
The opening-range breakout is a classic day-trading recipe, tested here in the backtest: define a price range using the first candles after the bell (the "opening range"), then buy if the price breaks above it, with a stop on the opposite side. We tested 36 variants of it — different range lengths, both long and short, with and without volume and gap filters — and all 36 came back negative.
The main variant (opening range equal to the first five-minute candle, stop on the opposite side, long positions, no extra filter) had a 35.7% hit rate, a median trade (the typical result) of −0.38%, and an average net return (all trades spread evenly, extremes capped) of −0.134%, with a plausible range that stayed entirely below zero. It was positive in 0 of 16 years, and negative before costs too, at −0.024%.
| Variant | Trades | Hit rate | Median | Robust average before costs | Robust average | 90% interval | Positive time slices |
|---|---|---|---|---|---|---|---|
| Main rule: 5 minutes, stop at the opposite side, long | 3,850,073 | 35.7 % | −0.38 % | −0.024 % | −0.134 % | [−0.149; −0.119] | 0/4 |
| the same rule as a short sale | 3,838,723 | 34.9 % | −0.40 % | −0.004 % | −0.114 % | [−0.130; −0.098] | 0/4 |
| Opening range of 15 minutes | 3,115,709 | 41.2 % | −0.26 % | −0.013 % | −0.123 % | [−0.140; −0.106] | 0/4 |
| Opening range of 30 minutes | 2,527,287 | 43.1 % | −0.18 % | −0.011 % | −0.121 % | [−0.141; −0.102] | 0/4 |
| Stop by volatility instead of the opposite side | 3,834,624 | 45.3 % | −0.12 % | −0.020 % | −0.130 % | [−0.150; −0.108] | 0/4 |
| only after an opening gap of 2% or more | 124,069 | 40.1 % | −0.54 % | −0.023 % | −0.133 % | [−0.195; −0.068] | 0/4 |
| only on double the usual opening volume | 624,086 | 39.7 % | −0.37 % | −0.005 % | −0.114 % | [−0.137; −0.093] | 0/4 |
| For comparison: simply hold, no rule at all | — | — | — | — | +0.050 % | — | — |
Seven of the 36 breakout variants computed, net per trade. Not one met the success criterion. The last row is not a trading rule but the plain price drift over exactly the same window, measured over the full period — and it beat every rule. Source: price data, own calculations.
The clearest sign of failure: simply buying and holding through the same time windows, no signal at all, would have averaged +0.050% — better than the breakout rule itself. Widening the range to 15 or 30 minutes, using a volatility stop, or adding a gap or volume filter changed little; every variant, including a similar recipe in our Velez open-trade study, stayed negative. Filling trades at the signal price instead of the next open made results worse still, so the failure was not an artifact of the conservative fill assumption in this backtest.
Intraday momentum and the average price
Two more recipes tested in the backtest whether a stock's early behavior predicts what happens later. The momentum rule took the direction of the first 30 or 60 minutes as its sign: a stock that rose in the morning was bought for the last 25 trading minutes of the day (3:30 p.m. to 3:55 p.m.), one that fell was sold short. Both variants averaged (spread evenly) about −0.11% net, with a 34.4% hit rate and 0 of 16 years positive — the window was only 25 minutes end to end, short enough that the roughly 0.11% round-trip cost consumed whatever the signal could contribute.
The other recipe used the VWAP, the volume-weighted average price — in plain terms, the price at which a stock traded on average that day. Betting with the VWAP trend at mid-morning averaged −0.117% net, negative in every year tested.
| Variant | Trades | Hit rate | Median | Robust average before costs | Robust average | 90% interval |
|---|---|---|---|---|---|---|
| Momentum: direction of the first 30 minutes, position 15:30–15:55 | 6,116,385 | 34.4 % | −0.11 % | −0.002 % | −0.112 % | [−0.115; −0.110] |
| Momentum: direction of the first 60 minutes | 6,133,560 | 34.4 % | −0.11 % | −0.001 % | −0.111 % | [−0.113; −0.109] |
| Momentum across the market: top tenth long, bottom tenth short | 3,825 | 2.9 % | −0.23 % | −0.010 % | −0.230 % | [−0.233; −0.227] |
| Average price, trend: at 10:30 take the stronger side | 6,196,784 | 44.7 % | −0.12 % | −0.007 % | −0.117 % | [−0.126; −0.108] |
| Average price, reversion: buy 1% below | 2,107,202 | 58.4 % | +0.23 % | +0.010 % | −0.100 % | [−0.111; −0.090] |
| Average price, reversion: buy 2% below | 554,667 | 52.0 % | +0.10 % | +0.031 % | −0.079 % | [−0.103; −0.056] |
| Average price, reversion: buy 3% below | 181,164 | 46.8 % | −0.16 % | +0.069 % | −0.041 % | [−0.081; −0.003] |
| Average price, reversion: sell short 1% above | 2,025,767 | 58.1 % | +0.22 % | +0.029 % | −0.081 % | [−0.090; −0.072] |
| Average price, reversion: sell short 2% above | 507,188 | 52.2 % | +0.11 % | +0.053 % | −0.057 % | [−0.079; −0.036] |
| Average price, reversion: sell short 3% above | 167,825 | 46.6 % | −0.17 % | +0.070 % | −0.040 % | [−0.088; +0.008] |
Intraday momentum and the volume-weighted average price, net per trade. In the reversion rules the hit rate and the median looked good while the robust average stayed negative: many small gains, a few very large losses. The cross-section row counts no individual trades but 3,825 trading days of an equally weighted basket — hence the very low hit rate of 2.9%: on almost every day the costs pushed the basket into the red. Source: price data, own calculations.
The reversion version — buying when the price sits 1%, 2%, or 3% below the VWAP, betting on a snap-back — mirrors the gap trades. The median (typical) trade was positive (+0.233% at 1%, +0.105% at 2%) and the hit rate was high, up to 58.4%. But the average (spread evenly across trades) still came out negative: many small wins, a few large losses, the opposite of the gap fades, where a few large wins pulled a negative median up to a positive average. One caveat: the exit carries a little hindsight (it exits at the VWAP value of whichever candle reaches it), so the result is if anything too generous — and in the backtest it still lost.
The volume spike: the clearest no
The sixth and final recipe, added after the first five, tested a simple, everyday rule: a five-minute candle that jumps at least 10% versus the candle before it, on at least triple that previous candle's volume. The rule buys at the next candle's open and sells five candles later, 25 minutes on. Only the first such signal per stock per day counted, and the signal candle itself needed at least $100,000 in dollar volume.
Starting from 9,248 candles meeting the price-jump and volume conditions, 5,016 fell out as untradable, 416 sat too close to the market close, and 255 had a data gap, leaving 3,561 tradable signals and 2,464 counted as the first signal of the day per stock, across 821 stocks and 1,458 trading days.
| Stage | Count |
|---|---|
| Candles rising 10% or more on at least triple volume | 9,248 |
| of those not tradable (too cheap or too little turnover) | 5,016 |
| of those too close to the close (the sale would fall on the next day) | 416 |
| of those missing the buy or sell candle (data gap) | 255 |
| tradable signals in total | 3,561 |
| of those the first signal per stock and day (main rule) | 2,464 |
From raw signal to tradable trade. More than half of the candles that met the rule in the study period were not tradable — too cheap or with too little turnover. Source: price data, own calculations.
The result was the worst of any recipe in this study: a median trade (the typical result) of −3.69%, a hit rate of just 32.2%, and 0 of 16 years positive. It was negative even before costs (robust average −2.00%), so in the backtest the failure sat in the pattern itself, not in trading friction.
| Variant | Trades | Hit rate | Median | Robust average before costs | Robust average | 95% interval | Positive years |
|---|---|---|---|---|---|---|---|
| Main rule: rise of 10% or more, triple volume, held 25 minutes | 2,464 | 32.2 % | −3.69 % | −2.00 % | −2.45 % | [−2.92; −1.94] | 0/16 |
| Rise of 5% instead of 10% | 11,728 | 34.2 % | −1.69 % | −0.84 % | −1.24 % | [−1.56; −0.99] | 1/16 |
| Rise of 20% instead of 10% | 342 | 29.5 % | −6.71 % | −3.57 % | −4.09 % | [−6.04; −2.02] | 2/16 |
| Double instead of triple volume | 2,997 | 32.7 % | −3.59 % | −1.68 % | −2.13 % | [−2.61; −1.66] | 1/16 |
| Five times instead of triple volume | 1,786 | 33.1 % | −3.49 % | −1.90 % | −2.35 % | [−2.87; −1.80] | 1/16 |
| Every signal instead of only the first each day | 2,835 | 32.5 % | −3.74 % | −1.93 % | −2.37 % | [−2.83; −1.85] | 0/16 |
| Without the tradability filter | 4,690 | 29.8 % | −3.70 % | −1.84 % | −2.52 % | [−2.87; −2.17] | 0/16 |
| Rise measured inside the candle instead of against the previous one | 2,366 | 32.5 % | −3.77 % | −1.77 % | −2.21 % | [−2.72; −1.70] | 1/16 |
| For comparison: a randomly chosen candle on the same day | 12,320 | 44.4 % | −0.31 % | — | +0.62 % | [+0.48; +0.77] | 14/16 |
The volume-spike rule and its variations, net per trade after 0.05% cost per side. Not one variant was positive. The final row is the decisive control: a randomly chosen candle in the same stocks on the same days, held just as long, did markedly better in the backtest. Source: price data, own calculations.
The most damning comparison came from a random baseline: picking an entirely random candle in the same stocks, on the same days, and holding it for the same length of time averaged (spread evenly across trades) +0.62%, positive in 14 of 16 years. In the backtest, buying right after a volume spike in the stocks of this study did not just fail to make money — it did roughly 3 percentage points worse than a randomly chosen candle in the very same stock, on the very same day.
| Holding time | Median before costs | Median after costs | Robust average | Hit rate |
|---|---|---|---|---|
| 5 minutes | −1.35 % | −1.77 % | −1.37 % | 34.6 % |
| 10 minutes | −2.27 % | −2.67 % | −2.01 % | 33.6 % |
| 15 minutes | −2.65 % | −3.10 % | −2.32 % | 32.7 % |
| 20 minutes | −3.02 % | −3.50 % | −2.49 % | 32.9 % |
| 25 minutes (main rule) | −3.36 % | −3.74 % | −2.74 % | 31.9 % |
| 30 minutes | −3.41 % | −3.86 % | −2.79 % | 31.3 % |
| 35 minutes | −3.57 % | −3.98 % | −2.86 % | 31.5 % |
| 40 minutes | −3.52 % | −3.91 % | −2.81 % | 32.3 % |
| 45 minutes | −3.76 % | −4.10 % | −3.01 % | 31.7 % |
| 50 minutes | −3.88 % | −4.36 % | −3.12 % | 31.3 % |
| 55 minutes | −4.21 % | −4.60 % | −3.38 % | 32.2 % |
| 60 minutes | −4.34 % | −4.70 % | −3.38 % | 32.2 % |
How the result develops with holding time, computed on the same set of 2,052 signals throughout. It did not improve — it got worse with every further candle. Source: price data, own calculations.
Holding longer only made things worse. Measured on the same 2,052 signals throughout, so the curve compares like with like, the average net return (spread evenly, extremes capped) fell from −1.37% at 5 minutes to −2.32% at 15 minutes, −2.74% at 25 minutes and −3.12% at 50 minutes, while the median (typical trade) slid from −1.77% to −4.70% at 60 minutes. Every sensitivity check — jump thresholds, volume multiples, all signals instead of only the first, no tradability filter — stayed negative.
What costs do to all of this
In this backtest, costs shrank the result at every level but did not decide it. Looking at the flagship gap-fade variant (fading an upward gap of at least 5%) at rising cost levels shows the simulated average shrinking steadily while staying positive at every cost level tested — before any borrow fee.
| Cost per side | Median | Robust average | 90% interval | Profit factor |
|---|---|---|---|---|
| 0.00% | −0.62 % | +0.472 % | [+0.351; +0.611] | 1.45 |
| 0.02% | −0.67 % | +0.422 % | [+0.301; +0.561] | 1.40 |
| 0.05% (main assumption) | −0.73 % | +0.362 % | [+0.241; +0.500] | 1.34 |
| 0.10% | −0.83 % | +0.261 % | [+0.141; +0.400] | 1.25 |
The same rule — gap up from 5%, traded against it — across four cost levels. The main assumption of 0.05% per side equals 0.10% per round trip plus commission. The profit factor divides the sum of all gains by the sum of all losses; above one means something is left over. Source: price data, own calculations.
At zero costs the average (spread evenly across trades) net return for that variant was +0.472%; at 0.05% per side, +0.362%; even doubled to 0.10%, it stayed positive at +0.261%. Every step up in cost tier made every one of the 912 core settings worse, no exceptions — a basic sanity check the design had to pass. One honest addendum: commission for the first five recipes was set at a flat 0.01% per round trip, fitting a roughly $100 stock, not the median entry price of the breakout trades actually taken, $44.35. A realistic commission would run about 0.013 points higher at the median and 0.024 higher on average — those five recipes' results are modestly too generous by that margin. The rate stayed unchanged because it was fixed before testing began, disclosed rather than corrected after the fact; the volume-spike recipe computes commission from each trade's actual entry price.
Limits of this study
The most important limitation, stated plainly: four of the five variants that held up in the backtest are short sales, meaning they profit from a falling price by borrowing and selling shares first. Stocks that just gapped up sharply can be difficult or impossible to borrow, and the fee for borrowing them is not included anywhere in this study. That fee alone could erase the entire measured advantage.
Beyond that: trades fill at the next candle's open, conservative, but real bid-ask spreads after a large gap can run wider than the 0.05% per side assumed here — the largest remaining uncertainty. The stock universe was selected by market capitalization at any month-end in 2020, which nobody trading in, say, 2012 could have known; this look-back bias is known, accepted, and affects every recipe equally, not just the winning one. Commission was understated for the first five recipes, as above. No taxes, financing costs, or market impact from a trader's own orders are included. And one stock is missing five-minute candles between June 10 and July 24, 2024, across a stock split.
The design and calculations passed all seven verification checks, among them: exact candle counts on sample days, a short-day calendar matched against an independently built one, hand-recomputed example trades within a 0.002% tolerance, a random baseline reproducing the plain daily price drift, two independent runs producing identical result files, and cost monotonicity across all 912 core settings. The volume-spike add-on passed its own seven checks, and 21 automated unit tests passed throughout.
What remains
Across five pre-registered day-trading recipes plus one add-on, only one pattern cleared our pre-registered, cost-adjusted bar in the backtest and in the universe studied: trading large opening gaps, fading them in four of the five variants and going with them in the fifth. Even there, the typical trade lost money, and the positive average depended on catching a few unusually large winners in stocks that can be hard to borrow. The breakout, momentum, VWAP trend-following, and volume-spike recipes were all negative after costs; the breakout and the volume spike were negative even before costs, at −0.024% and −2.00%. Most of the price gain of the stocks in this study over sixteen years happened overnight, between one close and the next open — hours in which none of the day-trading recipes tested here was positioned to act. The full archive of our published backtests sits at our studies overview.
Note: This article is a retrospective statistical analysis of historical price data. It is not investment advice and not a recommendation to buy or sell. Past results say nothing about the future. Trading costs, borrow fees, taxes and the market impact of a trader's own orders can make real-world results substantially worse.
Frequently Asked Questions
Barely. Of 58 pre-registered rule variants, only 5 met the strict success criterion in this study, all from the same building block, trading large opening gaps — four against the gap, one with it. The opening-range breakout, intraday momentum, the VWAP trend and the volume-spike add-on held up in no variant at all in the backtest. Four of the five variants that held up are short sales whose borrow fee is not included.
Overnight, by a wide margin. Across 6.28 million overnight observations, the average return from the prior close to the next open was +4.77 basis points, against only +0.54 basis points during the trading day itself — so roughly 90% of the total price gain of the stocks in this study happened overnight. A separate check in the backtest showed the effect could not be traded profitably once costs were included.
Trading large opening gaps — against the gap in four of the five variants that held up, with it in the fifth. After a gap up of at least 3, 5 or 10%, the day of the stocks in this study tended to give the move back; fading it produced a positive result in the backtest, between +0.21% and +0.56%. For the largest downside gaps of 10% or more it was going with the gap that held up (+0.71%). Four of the five variants are short sales whose borrow fee is not included.
Because the median was negative in all five variants that held up in this study, between −0.63% and −1.26%, at a hit rate of only 36% to 40%. The positive average arose in the backtest purely from a few very large winners; without them the rule would have been negative. 2025 alone contributed +24.89 percentage points of the 82.3 percentage points summed across the sixteen years.
None of the three held up in this study. The opening-range breakout was negative in all 36 variants tested; the main variant returned −0.134% in the backtest and stayed negative even before costs, at −0.024%, while simply holding through the same time windows returned +0.050%. Using the direction of the first 30 or 60 minutes as the sign for the last 25 trading minutes returned about −0.11% per trade, the VWAP trend −0.117%. VWAP reversion did have a high hit rate (up to 58.4%) and a positive median, but a negative average — many small wins, a few very large losses.
The clearest no in this study. For a candle rising at least 10% on at least triple the previous candle's volume, buying at the next open produced a hit rate of just 32.2% and a median of −3.69%, positive in 0 of 16 years. A randomly chosen candle in the same stock on the same day returned +0.62% in the backtest.
Two above all. Four of the five variants that held up in this study are short sales, and stocks right after a strong gap up can be hard or expensive to borrow — the borrow fee is not included in the backtest and could erase the measured advantage entirely. On top of that, morning spreads can be wider than the 0.05% per side assumed here.
Every rule in this study — filters, entry, exit, success criterion — was fixed before the first calculation (pre-registered design). The calculation also passed seven of seven verification steps, including trades recomputed by hand against the raw candles and two independent runs producing identical files; the volume-spike add-on passed its own seven checks. Four of the five variants that held up remain short sales with no borrow fee computed.


