10 False Alarms per Rally: Why the 5-Minute Death Cross Sells 25% Below the High
Faster is not smarter: the death cross on 5-minute candles exits at a median 25% below the high and ends up 14.7 percentage points behind the daily cross. Checked against 887 million candles from 4,336 US stocks between 2010 and July 2026.
 Thomas Mücke
Founder & Publisher
Thomas Mücke
Founder & Publisher

Anyone holding a stock that has gone parabolic knows the question: when is the run actually over? Our daily study on the parabolic death cross showed that selling when the 10-day and 20-day moving averages cross does help at the median — but only once more than half of the drawdown has already happened. The obvious follow-up: does the far finer 5-minute view get you out earlier — and can an investor really act on it?
We carried the same cross logic over to 5-minute candles, ran it across three time scales and worked through 887 million candles from 4,336 US stocks. The answer is more sobering than the first number suggests: the 5-minute cross is faster than the daily cross — but not smarter. Follow it in real time and you sell at a median 25 percent below the high.
The result in four numbers
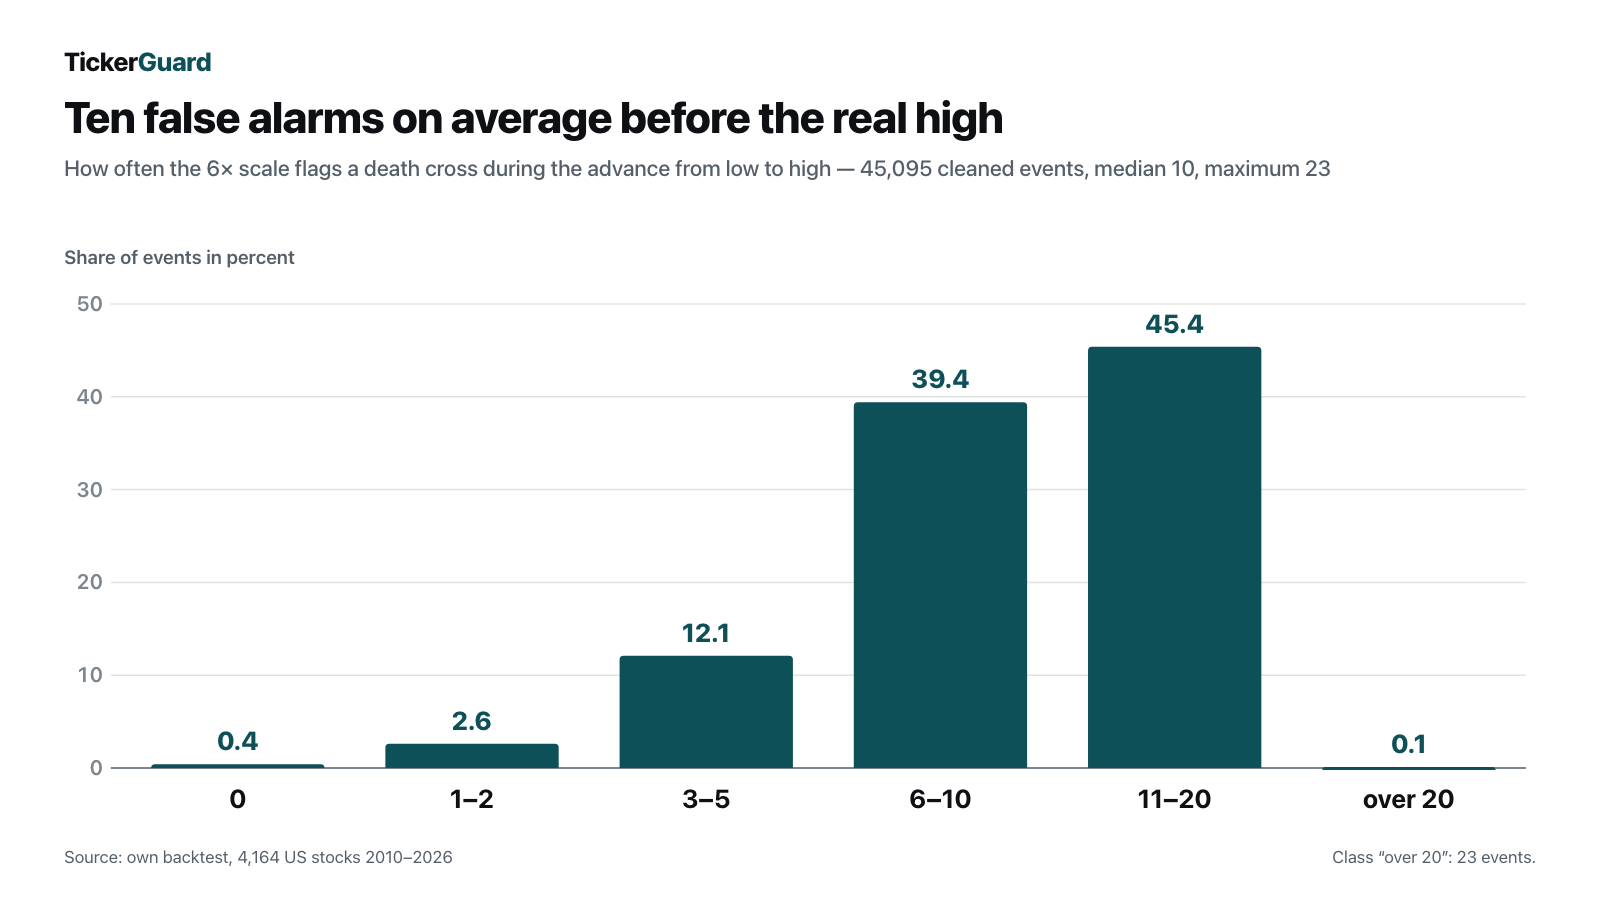
- 10 false alarms is what the main scale (6×) reports at the median while an advance is still running. Only 0.4% of advances stay completely alarm-free.
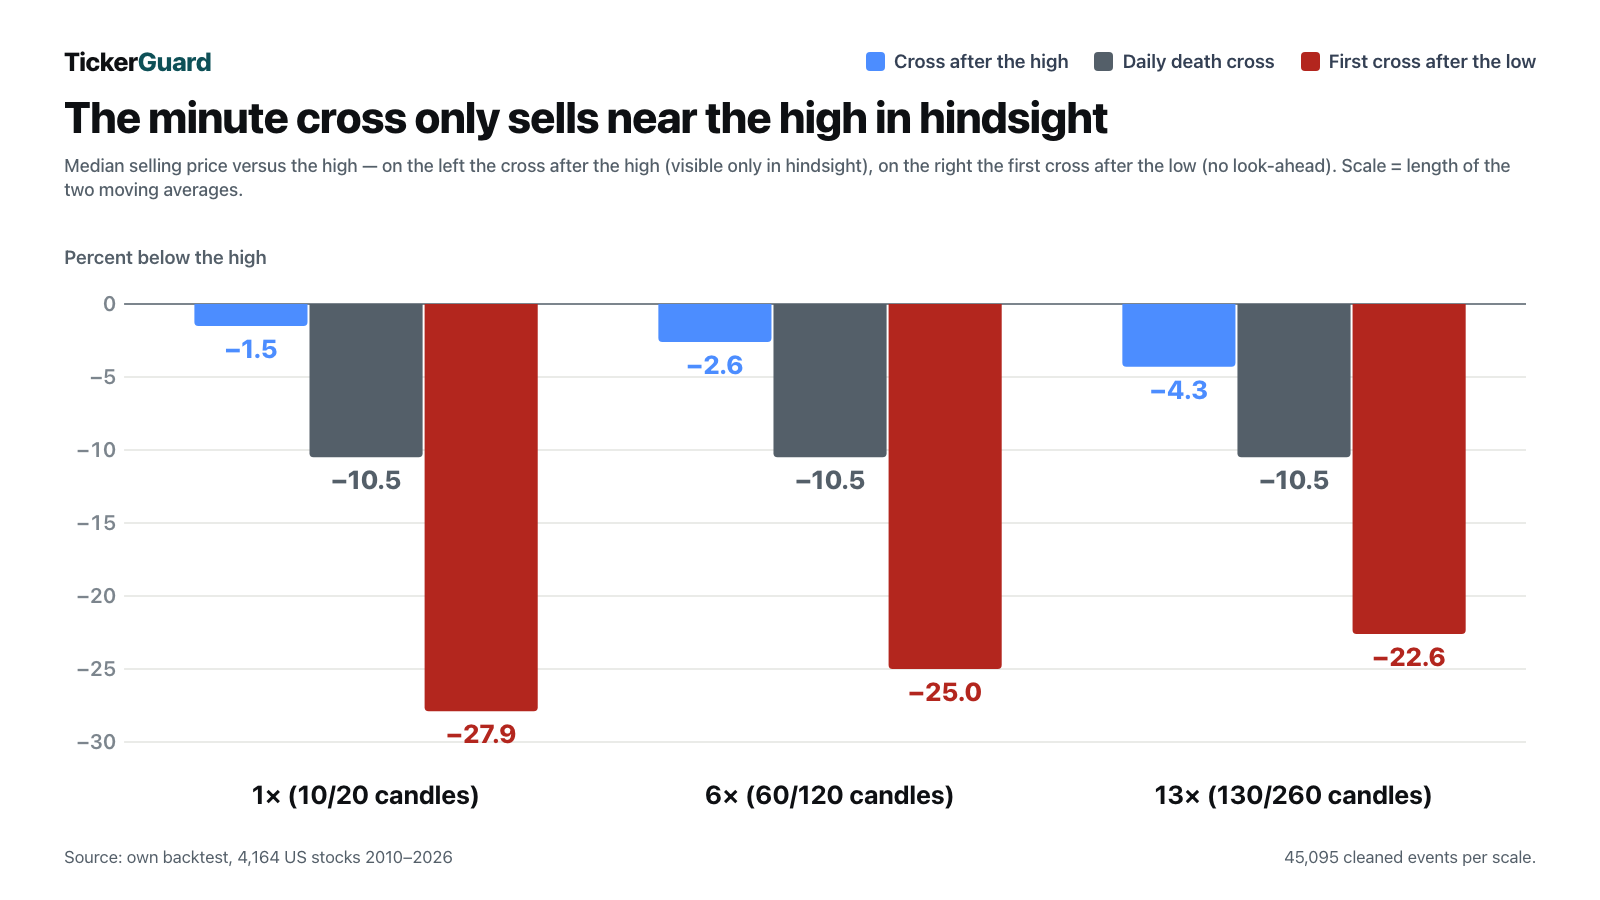
- −25.0% below the high is where the sale lands if you exit at the first cross after the low — the only rule in this study that can be followed in real time.
- −14.7 percentage points is how far that rule trails the sluggish daily death cross, at a 9.7% hit rate.
- +7.4 percentage points of advantage — the one friendly number in this study. It exists only once the daily high is already known.
Across the window tested, 2010 through July 2026, that adds up to an uncomfortable finding: the 5-minute cross confirms quickly that a high is behind us — it cannot spot the high while the high is still open. As a rule you can genuinely follow, it is clearly inferior to the daily cross.
Ten false alarms before the high is in
Start with the question that matters to an investor: what does someone experience who follows the 5-minute death cross in real time, without knowing where the high will turn out to be? Two quantities were counted for that: every 5-minute cross DURING the advance, that is between the low and the later high — those are the false alarms a holder is exposed to — and the outcome of selling at the very first 5-minute cross after the low. That second rule is the only one in this study that can be executed on the day itself.
The result is sobering. During the advance, a holder on the main scale (6×) lives through a median of 10 false downward crosses before the actual high is reached — in only 0.4% of cases does an advance stay entirely free of false alarms. On the finest scale (1×) there are 70 crosses, on the coarsest (13×) just 4; there, at least 2.6% of advances stay alarm-free. Anyone acting on those false alarms would as a rule have sold far too early.
Anyone who instead trades exactly once — at the very first 5-minute cross after the low — sells at a median 25.0% BELOW the high reached later (6× scale). Against selling at the daily cross that is 14.7 percentage points LESS, and in only 9.7% of cases does this rule beat the daily-cross exit at all. On the finest scale (1×) the effect is harsher still (−27.9% against the high, −18.1 percentage points against the daily cross, a hit rate of just 3.9%), on the coarsest (13×) somewhat milder (−22.6%, −11.6 percentage points, 16.7% hit rate). Even for STRONG events, the most violent parabolas of all, this rule sells at a median 52.0% below the high — 32.9 percentage points worse than at the daily cross, at a hit rate of only 3.6%.
| Scale | False alarms per rise (median) | Rises with zero false alarms (%) | Sell at first cross vs. high (%) | Disadvantage vs. daily cross (pp) | Hit rate (%) |
|---|---|---|---|---|---|
| 1× (MA10/20) | 70 | 0.1 | −27.9 | −18.1 | 3.9 |
| 6× (MA60/120) | 10 | 0.4 | −25.0 | −14.7 | 9.7 |
| 13× (MA130/260) | 4 | 2.6 | −22.6 | −11.6 | 16.7 |
| STRONG (6×) | – | – | −52.0 | −32.9 | 3.6 |
A case you can touch: Royal Caribbean, winter 2025/26
What that feels like shows up in a single advance. Royal Caribbean (RCL) climbed from its low on December 10, 2025 at $256.79 to its high on February 9, 2026 at $344.40 — a gain of 34.1% in 40 trading days, on a median daily turnover of $665 million, so anything but an illiquid small cap. The daily death cross arrived on February 24, 2026 at $313.20, and therefore 9.1% below the high.
On the 6× scale the minute series reported 13 death crosses during that advance. The first of them — the only signal that could have been traded without hindsight — fell on December 16, 2025 at 1:25 p.m. New York time, at $277.53: 19.4% below a high that was only reached eight weeks later. The cross that turned out to be the right one came on February 11, 2026 at 9:55 a.m. at $344.17 — just 0.07% below the high, and therefore 9.0 percentage points better than the daily cross. The catch: which of the fourteen crosses was the right one could only be said afterwards.
| Date | Time (New York) | Price ($) | Distance from the later high (%) |
|---|---|---|---|
| Dec 16, 2025 | 1:25 p.m. | 277.53 | −19.4 |
| Dec 18, 2025 | 1:00 p.m. | 282.28 | −18.0 |
| Dec 18, 2025 | 3:35 p.m. | 284.18 | −17.5 |
| Dec 23, 2025 | 11:35 a.m. | 290.50 | −15.7 |
| Dec 31, 2025 | 11:30 a.m. | 277.24 | −19.5 |
| … and 8 more through Feb 5, 2026 | – | – | −20.1 to −5.0 |
| Feb 11, 2026 (only after the high) | 9:55 a.m. | 344.17 | −0.07 |
The ex-ante comparison is an exploratory addendum: it was added only after the results had been reviewed and was not part of the design pre-registered on August 10, 2026; that is documented in the design addendum of August 21, 2026. The honest core message of this chapter is untouched by it: the 5-minute cross confirms a high quickly — but it does not recognize one.
The crystal-ball number: 10 days earlier — if you already know the high
So why does the 5-minute cross have a reputation as an early-warning system? Because it shines in hindsight. Turn the calculation around and ask: when a stock has formed a daily parabola and eventually reaches the daily death cross — how much earlier would a 5-minute cross have warned, and how much better would the exit price have been? Then the picture looks brilliant. All 45,805 daily events of the main universe from the daily study (3,626 stocks) were examined, each matched to the first 5-minute cross AFTER the already-known daily high. And that is exactly where the catch sits: the construction assumes the high is known.
For 45,804 of those events (6× scale, main universe) such a 5-minute cross existed; after the series-break cleanup described further below, 45,095 remain. At the median the minute cross came 10 trading days before the daily cross (p25–p75: 8 to 13 days), and in 99.0% of all cases it came before it at all. Selling at the 5-minute cross happened at a median 2.6% below the daily high — selling only at the daily cross 10.5% below it. The advantage: +7.4 percentage points at the gross median, +7.0 percentage points net after 0.4% costs for the complete round trip. The winsorized mean is +8.8 percentage points before and +8.7 percentage points after the series-break cleanup, at a hit rate of 93.5% gross (92.1% net, 93.8% after the cleanup). The middle half of cases (p25–p75) ran between +3.7 and +12.3 percentage points of advantage.
| Scale | Universe | N | Lead median (trading days) | p25–p75 | Share “5m cross before daily cross” (%) | Sell 5m vs. high (%) | Sell daily cross vs. high (%) | Advantage median (pp) | Advantage winsor. mean (pp) | Hit rate (%) | Advantage net median (pp) | False signal median (%) | False signal > 5 pp (%) |
|---|---|---|---|---|---|---|---|---|---|---|---|---|---|
| 1× (MA10/20) | BASE | 57,505 | 10 | 8–13 | 99.2 | −1.6 | −11.2 | +9.0 | +10.5 | 95.8 | +8.6 | 1.3 | 10.4 |
| 1× (MA10/20) | MAIN | 45,805 | 10 | 8–13 | 99.3 | −1.5 | −10.5 | +8.6 | +10.1 | 96.3 | +8.2 | 1.2 | 7.8 |
| 1× (MA10/20) | STRONG | 1,854 | 11 | 9–13 | 99.6 | −3.0 | −19.0 | +14.8 | +16.4 | 95.7 | +14.4 | 2.3 | 23.0 |
| 6× (MA60/120) | BASE | 57,467 | 10 | 8–13 | 98.2 | −2.9 | −11.2 | +7.5 | +8.9 | 92.0 | +7.1 | 1.7 | 15.7 |
| 6× (MA60/120) | MAIN | 45,804 | 10 | 8–13 | 99.0 | −2.6 | −10.5 | +7.4 | +8.8 | 93.5 | +7.0 | 1.6 | 12.2 |
| 6× (MA60/120) | STRONG | 1,854 | 10 | 9–13 | 99.5 | −5.1 | −19.0 | +12.8 | +14.0 | 92.9 | +12.4 | 3.2 | 32.4 |
| 13× (MA130/260) | BASE | 57,320 | 9 | 7–12 | 96.7 | −4.8 | −11.2 | +5.6 | +6.7 | 85.5 | +5.2 | 2.3 | 23.6 |
| 13× (MA130/260) | MAIN | 45,799 | 9 | 7–12 | 98.4 | −4.3 | −10.5 | +5.7 | +6.8 | 87.6 | +5.3 | 2.2 | 20.8 |
| 13× (MA130/260) | STRONG | 1,853 | 9 | 8–12 | 99.1 | −8.3 | −19.0 | +9.7 | +10.7 | 88.0 | +9.3 | 4.2 | 44.0 |
The advantage scales with the strength of the parabola: for STRONG events (rise of at least 100%, high = 120-day high, N 1,854) it grew to +12.8 percentage points at a 92.9% hit rate. The finest scale (1×, MA10/MA20) delivered +8.6 percentage points at a 96.3% hit rate in the main universe, the coarsest (13×, MA130/MA260) +5.7 percentage points at 87.6% — the finer the scale, the larger the hindsight lead, but also the more false alarms, as the previous chapter showed. Even this backward-looking exit is not free: if the parabola keeps running after the 5-minute cross, that costs a median 1.6% of forgone gains through the day of the daily cross, more than 5 percentage points in 12.2% of cases, and in 17.9% of cases the forgone gain was even larger than the calculated advantage itself.
For a sense of scale: in the daily study itself, selling at the daily cross instead of simply holding saved a median +5.0 percentage points after 60 and +7.5 percentage points after 120 trading days; 51.5% of the entire drawdown there happened only after the cross. Viewed in hindsight, the 5-minute variant extracts roughly another 7 percentage points on top.
Except: 83% of these 5-minute crosses land on the trading day right after the high, 95% within two trading days. That describes the character of the signal precisely — it confirms a high that has just happened instead of predicting one. The ten trading days of lead are therefore a theoretical ceiling on what perfect timing could have extracted at most, not a rule for everyday portfolio work.
As a standalone signal: just noise
The picture holds up when the 5-minute cross is viewed entirely without a daily parabola — that is, when the parabola itself is searched for directly on minute candles (a rise of at least 30% within roughly three trading hours, measured on the finest scale, 1×). The samples are large: 6,397 events from 1,667 stocks in the main universe (1×), 20,143 on the 6× scale, 33,155 on the 13× scale. Notably, 36% of the 1× events come from 2020 alone — a marked cluster from the Covid rally that has to be kept in mind. The figures in this chapter are computed without trading costs; they compare two paths through the same stock, not two differently priced strategies.
For holders who sell at the standalone 5-minute cross instead of holding on, there is barely anything in it in the main universe (1×): +0.2 percentage points after 5 trading days, −0.5 percentage points after 20 and −4.9 percentage points after 60 trading days. In 49 to 55% of cases the exit would have been premature, and the winsorized mean is negative at every horizon.
| Scale | Horizon (trading days) | N | Loss selling at the cross vs. high (median %) | Loss holding (median %) | Saving median (pp) | Saving winsor. mean (pp) | Saving positive (%) | Exit too early (%) |
|---|---|---|---|---|---|---|---|---|
| 1× (MA10/20) | 5 | 6,397 | −6.2 | −6.1 | +0.2 | −2.1 | 50.7 | 49.2 |
| 1× (MA10/20) | 20 | 6,397 | −6.2 | −4.8 | −0.5 | −4.5 | 48.5 | 51.4 |
| 1× (MA10/20) | 60 | 6,293 | −6.3 | −0.5 | −4.9 | −17.7 | 44.5 | 55.5 |
| 6× (MA60/120) | 5 | 20,143 | −8.2 | −9.0 | +0.7 | −0.4 | 52.7 | 47.1 |
| 6× (MA60/120) | 20 | 20,143 | −8.2 | −6.6 | −1.5 | −4.5 | 46.3 | 53.7 |
| 6× (MA60/120) | 60 | 19,984 | −8.3 | −2.9 | −5.3 | −13.5 | 43.7 | 56.3 |
| 13× (MA130/260) | 5 | 33,155 | −9.0 | −8.8 | −0.2 | −0.9 | 49.2 | 50.6 |
| 13× (MA130/260) | 20 | 33,155 | −9.0 | −7.8 | −1.1 | −3.5 | 47.1 | 52.8 |
| 13× (MA130/260) | 60 | 32,936 | −9.0 | −5.6 | −3.6 | −9.1 | 44.9 | 55.1 |
| Scale | Universe | Horizon (trading days) | N | Loss selling at the cross vs. high (median %) | Loss holding (median %) | Saving median (pp) | Saving winsor. mean (pp) | Saving positive (%) | Exit too early (%) | Total drawdown median (%) | Share of drawdown after the cross, median (%) |
|---|---|---|---|---|---|---|---|---|---|---|---|
| 1× (MA10/20) | BASE | 60 | 15,532 | −8.4 | −16.5 | +6.9 | −4.6 | 56.6 | 43.4 | −36.9 | 74.9 |
| 1× (MA10/20) | MAIN | 60 | 6,293 | −6.3 | −0.5 | −4.9 | −17.7 | 44.5 | 55.5 | −28.9 | 77.7 |
| 1× (MA10/20) | STRONG | 60 | 146 | −10.9 | −17.5 | +4.2 | +5.5 | 54.1 | 45.9 | −36.1 | 69.1 |
The reason is obvious: after the standalone 5-minute cross the price keeps rising at the median — in the main universe (1×) by +0.5% after 20 and +5.1% after 60 trading days. The S&P 500 gained a median +7.3% over the same window; depending on scale and horizon, the affected stocks of the main universe trailed the index in 52 to 56% of cases.
| Scale | Horizon (trading days) | N | Stock median (%) | S&P 500 median (%) | Excess return median (pp) | Excess return winsor. mean (pp) | Stock worse than index (%) |
|---|---|---|---|---|---|---|---|
| 1× (MA10/20) | 5 | 6,397 | −0.2 | +0.9 | −1.1 | +1.0 | 53.6 |
| 1× (MA10/20) | 20 | 6,397 | +0.5 | +2.9 | −2.6 | +0.5 | 55.0 |
| 1× (MA10/20) | 60 | 6,276 | +5.1 | +7.3 | −1.6 | +10.2 | 51.8 |
| 6× (MA60/120) | 5 | 20,143 | −0.7 | +0.6 | −1.6 | −0.5 | 56.2 |
| 6× (MA60/120) | 20 | 20,143 | +1.7 | +2.8 | −1.8 | +1.4 | 53.9 |
| 6× (MA60/120) | 60 | 19,947 | +5.9 | +7.3 | −2.2 | +6.9 | 52.7 |
| 13× (MA130/260) | 5 | 33,155 | +0.2 | +0.6 | −0.6 | +0.2 | 53.1 |
| 13× (MA130/260) | 20 | 33,155 | +1.2 | +2.3 | −1.1 | +1.4 | 52.8 |
| 13× (MA130/260) | 60 | 32,898 | +3.9 | +6.6 | −2.9 | +3.8 | 53.8 |
Only the illiquid BASE universe and the small STRONG universe show a slightly positive median at individual horizons — with a winsorized mean near zero or negative. The only figures worth mentioning in the winsorized mean come from the small STRONG universe on the 1× scale: +2.9 percentage points after 5, +7.2 after 20 and +5.5 after 60 trading days (median after 20 trading days +4.9 percentage points) — but on just 152, 152 and 146 events. Beyond that, only 13× STRONG over 5 trading days sits above zero, at +0.8 percentage points (652 events). Too few cases and too small a margin to build a rule on. The conclusion matches the ex-ante finding: a cross on minute candles alone is noise, whether it is used as a standalone signal or as a real-time rule after the low. Its only value is backward-looking, as confirmation after an already-known daily parabola.
When to cover? The short recipe is dead
An obvious question: if you short at the 5-minute cross, when do you cover? Is a fixed holding period enough, or is a re-cross of the moving averages the better trigger? We tested a systematic exit sweep on the main scale (6×, main universe) with 19,984 events (159 more without a complete 60-trading-day window were excluded, so that every variant computes on the identical event set). Every metric in this chapter is stated net of 0.4% costs for the complete round trip. An identical event set and an identical cost model for every variant are two of the binding fair-play rules of the pre-registered design; the third, the ban on looking into the future, reads verbatim as follows:
“No look-ahead: the trigger is detected on the closing price of a candle, execution happens no earlier than the candle after that. This is stricter than the existing stop columns (which compute on the close of the triggering candle) and correspondingly somewhat less favourable — deliberately so, because a moving average is only fixed once the closing price is in, the very price that would otherwise be traded on.”
Fixed holding periods produced a net median of +0.4% after 5, −1.2% after 10, −2.2% after 20 and −6.3% after 60 trading days — and in all 20 tested variants of this sweep the winsorized mean was negative, whether the exit was a holding period, a re-cross, a profit target or a stop.
| Variant | N | Holding period median (days) | Trigger rate (%) | Net median (%) | Net winsor. mean (%) | Net hit rate (%) |
|---|---|---|---|---|---|---|
| Fixed hold 5 days | 19,984 | 5 | – | +0.4 | −0.8 | 51.3 |
| Fixed hold 10 days | 19,984 | 10 | – | −1.2 | −3.0 | 46.3 |
| Fixed hold 20 days | 19,984 | 20 | – | −2.2 | −5.5 | 45.6 |
| Fixed hold 60 days | 19,984 | 60 | – | −6.3 | −15.6 | 43.2 |
| Re-cross signal pair, cap 10 days | 19,984 | 1 | 99.8 | −1.3 | −0.7 | 36.8 |
| Re-cross signal pair, cap 20 days | 19,984 | 1 | 100.0 | −1.3 | −0.7 | 36.8 |
| Re-cross signal pair, cap 60 days | 19,984 | 1 | 100.0 | −1.3 | −0.7 | 36.8 |
| Re-cross MA10/MA20, cap 10 days | 19,984 | 0 | 100.0 | −0.6 | −0.5 | 34.3 |
| Re-cross MA10/MA20, cap 20 days | 19,984 | 0 | 100.0 | −0.6 | −0.5 | 34.3 |
| Re-cross MA10/MA20, cap 60 days | 19,984 | 0 | 100.0 | −0.6 | −0.5 | 34.3 |
| Profit target 10 %, cap 10 days | 19,984 | 10 | 51.5 | +7.9 | −1.1 | 60.5 |
| Profit target 10 %, cap 20 days | 19,984 | 10 | 61.5 | +9.3 | −1.9 | 66.3 |
| Profit target 10 %, cap 60 days | 19,984 | 10 | 73.4 | +9.6 | −5.4 | 74.6 |
| Profit target 20 %, cap 10 days | 19,984 | 10 | 21.3 | −0.3 | −2.0 | 49.1 |
| Profit target 20 %, cap 20 days | 19,984 | 20 | 31.8 | +0.6 | −3.9 | 51.1 |
| Profit target 20 %, cap 60 days | 19,984 | 60 | 49.0 | +12.6 | −10.5 | 56.4 |
| Reference: stop 10 %, 20 days | 19,984 | 9 | 66.3 | −10.6 | −3.0 | 28.4 |
| Reference: stop 15 %, 20 days | 19,984 | 17 | 54.2 | −15.5 | −3.9 | 34.8 |
| Reference: stop 20 %, 20 days | 19,984 | 20 | 43.8 | −8.5 | −4.4 | 39.0 |
| Reference: trailing stop 15 %, 20 days | 19,984 | 6 | 86.7 | −4.5 | −1.7 | 37.6 |
The first upward re-cross of the fast pair MA10/MA20 produced a net median of −0.65%, at a median holding period of 0 days (the position usually crosses back on the same trading day), a trigger rate of 100% and a hit rate of only 34%. The re-cross of the signal pair MA60/MA120 itself performed similarly, at −1.3% median, one day of holding, a 100% trigger rate and a 36.8% hit rate. A 10% profit target capped at 60 trading days looked good at first glance — median +9.6%, hit rate 74.6%, holding period 10 days, with the target itself triggering in 73.4% of cases — but the winsorized mean sat at −5.4%: the target caps the gains, not the losses. A 20% target repeats the pattern: +12.6% median at a 56.4% hit rate, but a −10.5% winsorized mean. Stops made matters worse still: a 10% stop returned −10.6%, a 15% stop −15.5%, and even a 15% trailing stop still −4.5% at the net median. Every one of these variants computes on the same 19,984 events.
The sensitivity run confirms the picture: the 1× and 13× scales show the same pattern. Only the small STRONG universe on the 6× scale (N 371) shows positive medians of +3% to +8% for fixed holding periods — with a winsorized mean near zero. An earlier test run on just 58 loaded stocks had suggested +5% for the 10-day holding period; on the full dataset that effect has vanished — a textbook warning against conclusions drawn from small samples.
| Scale / universe | Variant | N | Holding period median (days) | Trigger rate (%) | Net median (%) | Net winsor. mean (%) | Net hit rate (%) |
|---|---|---|---|---|---|---|---|
| 1× MAIN | Fixed hold 5 days | 6,293 | 5 | – | −0.2 | −2.7 | 49.4 |
| 1× MAIN | Fixed hold 10 days | 6,293 | 10 | – | +0.2 | −1.2 | 50.4 |
| 1× MAIN | Fixed hold 20 days | 6,293 | 20 | – | −1.0 | −5.4 | 47.8 |
| 1× MAIN | Re-cross MA10/MA20, cap 60 days | 6,293 | 0 | 100.0 | −1.0 | −0.7 | 34.0 |
| 1× MAIN | Re-cross signal pair, cap 60 days | 6,293 | 0 | 100.0 | −1.0 | −0.7 | 34.0 |
| 1× MAIN | Profit target 10 %, cap 60 days | 6,293 | 5 | 75.0 | +9.7 | −5.5 | 76.5 |
| 1× MAIN | Profit target 20 %, cap 60 days | 6,293 | 39 | 55.0 | +18.5 | −10.3 | 61.2 |
| 1× MAIN | Reference: trailing stop 15 %, 20 days | 6,293 | 2 | 88.6 | −6.0 | −2.6 | 35.0 |
| 13× MAIN | Fixed hold 5 days | 32,936 | 5 | – | −0.6 | −1.4 | 47.4 |
| 13× MAIN | Fixed hold 10 days | 32,936 | 10 | – | −1.5 | −2.9 | 45.2 |
| 13× MAIN | Fixed hold 20 days | 32,936 | 20 | – | −1.6 | −4.4 | 46.3 |
| 13× MAIN | Re-cross MA10/MA20, cap 60 days | 32,936 | 0 | 100.0 | −0.6 | −0.4 | 32.6 |
| 13× MAIN | Re-cross signal pair, cap 60 days | 32,936 | 3 | 100.0 | −1.8 | −1.0 | 35.4 |
| 13× MAIN | Profit target 10 %, cap 60 days | 32,936 | 14 | 70.4 | +9.6 | −4.2 | 72.0 |
| 13× MAIN | Profit target 20 %, cap 60 days | 32,936 | 60 | 44.9 | +5.5 | −8.0 | 54.2 |
| 13× MAIN | Reference: trailing stop 15 %, 20 days | 32,936 | 8 | 81.8 | −4.6 | −2.0 | 36.5 |
| 6× STRONG | Fixed hold 5 days | 371 | 5 | – | +3.1 | −0.4 | 58.0 |
| 6× STRONG | Fixed hold 10 days | 371 | 10 | – | +4.4 | +0.3 | 56.9 |
| 6× STRONG | Fixed hold 20 days | 371 | 20 | – | +5.4 | −0.4 | 55.5 |
| 6× STRONG | Re-cross MA10/MA20, cap 60 days | 371 | 0 | 100.0 | −0.8 | −0.6 | 37.7 |
| 6× STRONG | Re-cross signal pair, cap 60 days | 371 | 1 | 100.0 | −1.2 | −1.1 | 41.2 |
| 6× STRONG | Profit target 10 %, cap 60 days | 371 | 4 | 81.7 | +9.7 | −0.6 | 82.5 |
| 6× STRONG | Profit target 20 %, cap 60 days | 371 | 19 | 65.0 | +19.3 | −4.4 | 70.6 |
| 6× STRONG | Reference: trailing stop 15 %, 20 days | 371 | 2 | 91.6 | −4.6 | −1.3 | 40.2 |
So not a single one of the tested variants carries. The median looks friendly for the profit-target variants, but as soon as you look at the robust average across all trades, every one of them tips into the red — rare short squeezes eat up the many small gains. It is the same median-versus-mean effect the daily study already demonstrated.
How we ran the numbers
The dataset consists of 5-minute price series for 4,336 US stocks with usable minute history; 4,361 stocks were loaded, and 4,164 of them show at least one event. The universe covers every stock with a market capitalization of at least $300 million at any month-end in 2020, survivorship-free including delisted names. The period runs from 2010 through July 2026; roughly 887 million raw 5-minute candles were loaded. Only regular trading hours count, 9:30 a.m. to 3:55 p.m. New York time; after that filter 788,154,029 candles remain. That is 78 candles on a regular trading day and 42 on an early-close day; the period contains 34 such early closes. The early-close calendar was derived market-wide from trading volume and additionally cross-checked against the known US holiday rules, so that no early close gets lost.
The cross logic is a direct carryover from the daily study, only on a minute basis: a short moving average (MA) crosses a long one from above to below after an accelerating rise. Because “MA10/MA20” spans only a few trading hours on 5-minute candles, two coarser scales were added: 6× (MA60/MA120, roughly matching the reaction time of the daily scale) and 13× (MA130/MA260). Price series were adjusted using the daily adjustment factor, the same data-break, suspected-split and gap guards as in the daily study were applied, plus a new guard for adjustment gaps between the minute and the daily series. The universe tiers keep their usual names: BASE (clean hygiene), MAIN (BASE plus a median dollar volume of at least $1 million) and STRONG (MAIN plus a rise of at least 100% and a high that is also the 120-day high).
| Scale | Universe | N incl. edge cases | Edge cases excluded | N |
|---|---|---|---|---|
| 1× (MA10/20) | BASE | 15,999 | 208 | 15,791 |
| 1× (MA10/20) | MAIN | 6,481 | 84 | 6,397 |
| 1× (MA10/20) | STRONG | 161 | 9 | 152 |
| 1× (MA10/20) | All events | 17,829 | 477 | 17,352 |
| 6× (MA60/120) | BASE | 36,706 | 237 | 36,469 |
| 6× (MA60/120) | MAIN | 20,275 | 132 | 20,143 |
| 6× (MA60/120) | STRONG | 398 | 14 | 384 |
| 6× (MA60/120) | All events | 39,111 | 642 | 38,469 |
| 13× (MA130/260) | BASE | 50,827 | 248 | 50,579 |
| 13× (MA130/260) | MAIN | 33,318 | 163 | 33,155 |
| 13× (MA130/260) | STRONG | 679 | 27 | 652 |
| 13× (MA130/260) | All events | 53,435 | 730 | 52,705 |
| Scale | Reason | N |
|---|---|---|
| 1× (MA10/20) | Data break | 127 |
| 1× (MA10/20) | Suspected split | 1,059 |
| 1× (MA10/20) | Gaps > 10 calendar days | 152 |
| 1× (MA10/20) | Adjustment gap | 566 |
| 1× (MA10/20) | Raw low < $1 | 0 |
| 1× (MA10/20) | Edge case (last 30 trading days) | 477 |
| 1× (MA10/20) | Median dollar volume < $1m (from BASE) | 9,382 |
| 6× (MA60/120) | Data break | 83 |
| 6× (MA60/120) | Suspected split | 1,205 |
| 6× (MA60/120) | Gaps > 10 calendar days | 149 |
| 6× (MA60/120) | Adjustment gap | 1,032 |
| 6× (MA60/120) | Raw low < $1 | 0 |
| 6× (MA60/120) | Edge case (last 30 trading days) | 642 |
| 6× (MA60/120) | Median dollar volume < $1m (from BASE) | 16,326 |
| 13× (MA130/260) | Data break | 65 |
| 13× (MA130/260) | Suspected split | 1,172 |
| 13× (MA130/260) | Gaps > 10 calendar days | 109 |
| 13× (MA130/260) | Adjustment gap | 1,321 |
| 13× (MA130/260) | Raw low < $1 | 0 |
| 13× (MA130/260) | Edge case (last 30 trading days) | 730 |
| 13× (MA130/260) | Median dollar volume < $1m (from BASE) | 17,424 |
Not every metric is computed with costs, and that is deliberate. The short metrics in the exit sweep and in the sensitivity run are stated net of 0.4% costs for the complete round trip (short and buy-back). For the price advantage against the daily cross, the gross figure leads (+7.4 percentage points), because both variants describe the same single sale; the net figure stands next to it at +7.0 percentage points. The “sell instead of hold” comparisons and the comparison against the S&P 500 are computed without costs.
The design was pre-registered on August 10, 2026, before the results were in; two amendments — a refined early-close calendar and an exit sweep for the short side — are documented, as are two deviations made after the results had been reviewed: a series-break cleanup and the added ex-ante comparison. The mechanics were verified before the full run: the candle count for regular trading hours matched exactly, the AAPL stock split of August 2020 came through cleanly after adjustment, and all 97 of 97 known daily crossings could be reproduced exactly from the 5-minute aggregate — the computation is deterministic.
On review a series break turned up: for 1,188 of the 4,336 stocks there was at least one trading day on which the adjusted 5-minute series and the adjusted daily series sat on different price levels, because reverse splits and spin-offs had been adjusted on a different basis; for 71 stocks the gap exceeded 50%. For ADPT, for instance, the minute series sat a factor of 4.0 above the daily series, for COHR 3.7, for XPO 2.9. The deviation runs both ways: for 468 of the 1,188 affected stocks the minute series sits below the daily series. It first became visible in roughly 200 particularly striking rows in which the 5-minute selling price was, arithmetically, 20 to 570% above the daily high. The full series-break guard excludes 709 of the 45,804 rows in the hindsight calculation (6× scale, main universe, 1.5%); 45,095 events remained, with a median of +7.40 instead of +7.42 percentage points, a winsorized mean of +8.7 instead of +8.8 percentage points and a hit rate of 93.8%. An additional filter on 19 further rows with gappy 5-minute coverage (a calendar gap from the high to the 5-minute cross of more than 200 days) shifted the median only marginally, to +7.39 percentage points. Both are documented deviations from the pre-registered design, not a changed core result.
Limitations of this study
- Only the simplest rule was tested. Intermediate versions — a cross that counts as a signal only after a minimum rise or a minimum duration, or a combination of several scales — were not computed and remain open. This study answers what the 5-minute death cross achieves on its own, not whether a filtered variant would do better.
- The ex-ante figures are exploratory. The comparison between the hindsight advantage and the false alarms during the advance was added only after the results had been reviewed and was not pre-registered — documented as an extension of the design, not as a replacement for the confirmatory computation.
- A cluster in 2020. Both the standalone 5-minute parabolas (36% of the 1× main universe) and the daily events pile up substantially in the Covid rally of 2020 — a market regime that does not repeat on demand.
- The series-break hygiene is post hoc. Excluding 709 rows with a demonstrably wrong adjustment basis was added only after the results had been reviewed and was not pre-registered — documented as a deviation, with a practically unchanged median.
- Costs are a flat assumption. A 0.4% round trip covers bid-ask spread and fees only approximately; borrow costs for short positions and slippage specific to 5-minute candles are not included. The “sell instead of hold” comparisons and the comparison against the S&P 500 are computed entirely without costs.
- The closing auction is missing. The 5-minute series ends with the last regular candle at 3:55 p.m. New York time — the actual closing price from the closing auction does not enter the calculation.
- Liquidity filters run on daily volume. Minute volume partly fails to capture auction volume, so the dollar-volume filter falls back on daily volume.
- There is no accompanying scanner for this pattern — the study is a pure retrospective, not a tool for finding candidates.
- No investment advice. All figures describe a backward-looking pattern, not a forecast for any individual stock trading today.
Readers who want the full daily backtest can find it in our Parabolic Death Cross study. How a drawdown after a parabola often continues or reverses is examined in our Crash Reversal study. More backtest studies live together in Studies.
Source: own analysis of price data (5-minute and daily candles), 4,336 US stocks, 2010 through July 2026. Figures as of August 21, 2026.
This article is a historical analysis of publicly available price data and not investment advice. It contains no buy or sell recommendation, no forecast, and no assessment of or recommendation regarding any individual company trading today; the Royal Caribbean example is purely a look at price history. Past results — whether simulated or real — are not a reliable indicator of future returns. Anyone making investment decisions should assess their own situation and risks, if in doubt with professional advice.
Frequently Asked Questions
In time yes, in practice no. Measured backwards from the daily high that is already known, the first 5-minute cross sits a median ten trading days ahead of the daily death cross, and ahead of it at all in 99.0% of cases. That lead exists only because of hindsight, though: 83% of these crosses fall on the trading day after the high. The signal confirms a high that has just happened — it does not announce one.
You sell far too early. The only rule that can be applied without knowing the high is to sell at the very first 5-minute cross after the low. On the main scale (6×) that sale lands at a median 25.0% below the high reached later, and therefore 14.7 percentage points behind a sale at the daily death cross. The fast rule was the better one in only 9.7% of cases.
On the main scale (6×) the minute series reports a median of ten downward crosses while the advance is still running; in 84.8% of all advances there are between six and twenty, and only 0.4% of advances stay entirely free of false alarms. On the finest scale (1×) the median is 70 crosses, on the coarsest (13×) still four. The finer the time resolution, the more false alarms.
Royal Caribbean in the winter of 2025/26. The stock rose from its low on December 10, 2025 at $256.79 to its high on February 9, 2026 at $344.40. Along the way the 6× scale reported 13 death crosses. The first, on December 16, 2025 at 1:25 p.m. New York time at $277.53, sat 19.4% below the eventual high. The cross that turned out to be the right one only came on February 11, 2026 at $344.17 — which of them was the right one could not be said in advance.
Not according to this analysis. If the parabola is searched for directly on minute candles instead of waiting for a daily parabola, selling at the cross rather than holding delivers +0.2 percentage points after 5 trading days in the main universe, -0.5 after 20 and -4.9 after 60. In 49 to 55% of cases the exit was premature, and the price kept rising at the median after the cross.
Not as a recipe, judging by the tested figures. A systematic sweep of 20 exit variants on the identical event set — fixed holding periods, re-crosses of the moving averages, profit targets, stops — produces a negative winsorized mean in every single variant, that is a negative robust average across all trades. Profit targets do lift the median and the hit rate, but they cap the gains while rare short squeezes leave the losses open.
The computation rests on roughly 887 million 5-minute candles from 4,336 US stocks with usable minute history, survivorship-free including delisted names, on the basis of a design pre-registered on August 10, 2026 with documented amendments. On review a series break turned up: for 709 of 45,804 rows (1.5%) the adjusted 5-minute series and the daily series sat on different price levels; after excluding them, 45,095 events remained, and the median barely changed (from 7.42 to 7.40 percentage points). The ex-ante comparison is an exploratory addendum, not a pre-registered part of the study.


