Crash Reversal Study: Buying After the Crash Beats the Index — Narrowly, But For Real
A stock crashes, forms a death cross, loses at least a fifth of its value, and finally capitulates with a close well below its 20-day line. Is that exact moment a good entry? We ran the numbers on the reversal across 9,908 cases since 2010, survivorship-free and including stocks later delisted. The answer is yes — but only in one very specific form: an early entry right after capitulation, an exit within at most twelve trading days. Wait instead until the price is back above its 20-day line, and the rule beats the index in none of 1,500 tested exit variants (winsorized mean). Hold the position long instead, and it also loses against the index. And at the most brutal crashes, even the short version fails.
 Thomas Mücke
Founder & Publisher
Thomas Mücke
Founder & Publisher
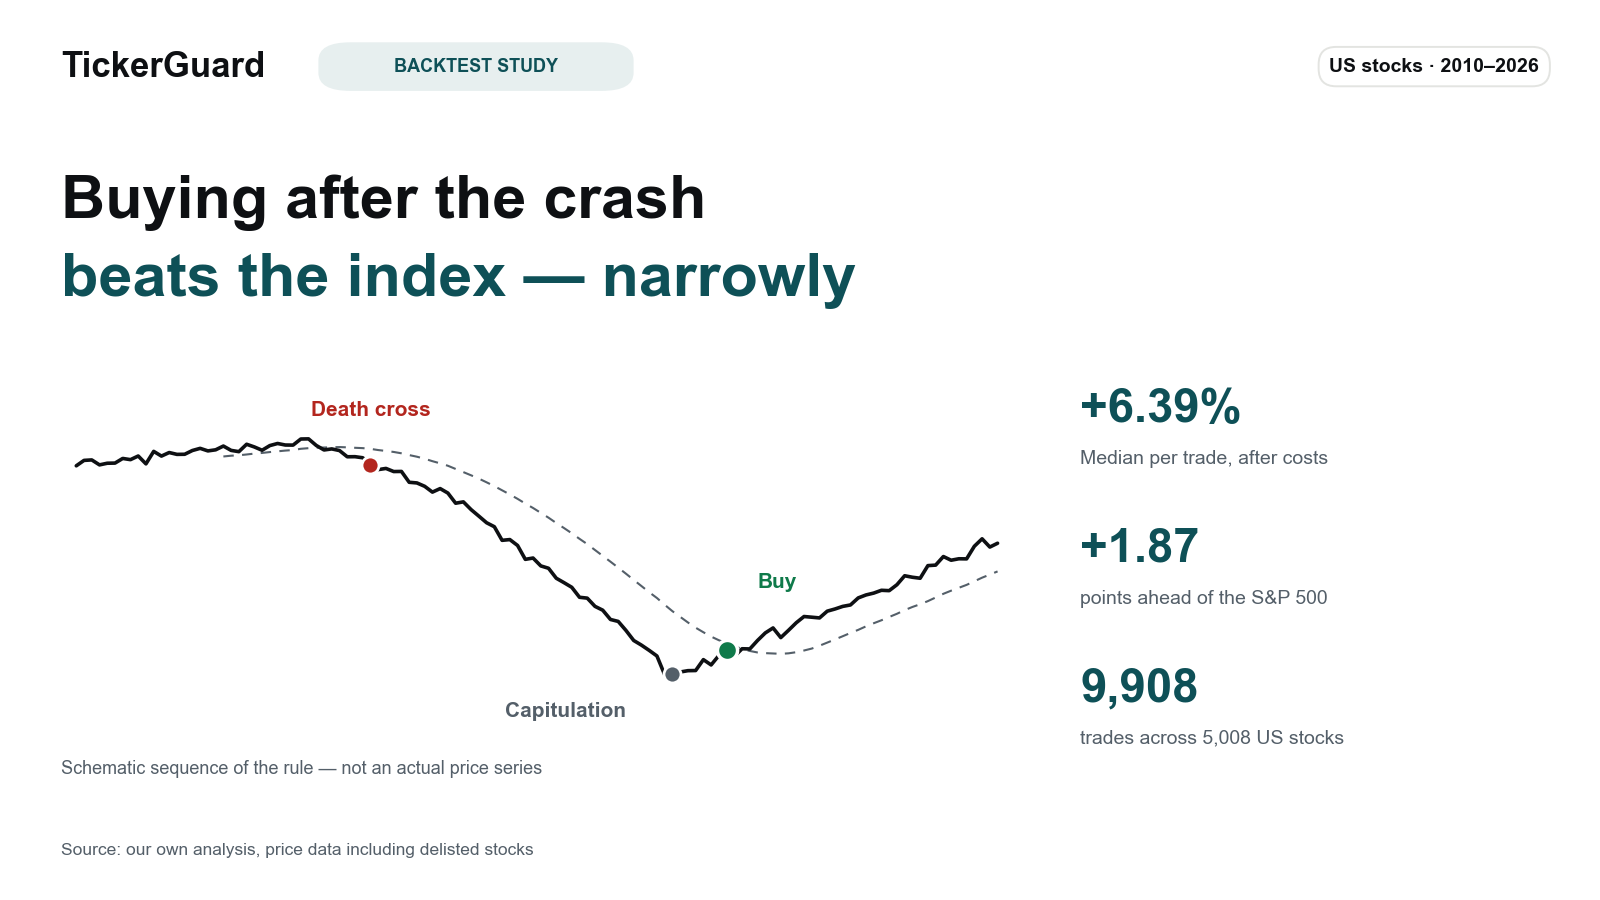
Chart patterns have two extremes of the same move: the parabolic run-up that eventually tips over, and the crash that eventually ends. Our Parabolic Death Cross study looked at the tipping-over from the top — as an exit signal for holders, as a failed short recipe. This study takes the opposite direction: exactly when has a crash run far enough that buying makes sense?
We built a three-stage rule for that and ran the numbers on 9,908 complete trades in 5,008 US stocks since 2010, survivorship-free — including every stock that has since been delisted. The result is a real but narrow edge over the S&P 500, and it only holds under very specific conditions: early entry, short exit. We explicitly tested every other combination too — and none of them work.
The result in four numbers
Does it pay to buy once a crash has run far enough — a death cross, at least a 20 percent loss, then a capitulation candle? We ran the rule on 9,908 trades in 5,008 US stocks since 2010, survivorship-free. Four numbers carry the result:
- +1.87 percentage points is how far ahead of the S&P 500 the rule ran on average — net, under the realistic mixed-cost scenario (winsorized mean per trade: +3.70%).
- +3.47 percentage points was the edge on the typical trade: the median came in at +6.39%, well above what the index typically manages over the same window.
- 66.6% was the hit rate across the 9,908 trades — and even with the 2020 and 2021 entry years stripped out (6,998 trades), the edge over the index still stood at +2.06 points. So this is not a Covid-recovery story.
- −5.44 percentage points is how far the rule trailed the index on the harshest crashes (50 percent or worse, 1,116 trades) — the one real weak spot. A separately tested long-hold recipe for those cases failed the retest.
Over the tested window from 2010 to 2026, the short buy rule beat the S&P 500 net of costs — except on the harshest crashes, where it fell behind.
The rule: three stages before a buy
The rule unfolds in three consecutive steps, and all three have to be met before a buy signal can exist at all:
- Death cross. The 10-day line (SMA10) falls from above to below the 20-day line (SMA20), on a daily-close basis.
- A real crash. From the close on the cross day to the lowest subsequent close, the stock loses at least 20 percent.
- Capitulation. At least one day closes 15 percent or more below the 20-day line — the moment the sell-off visibly overshoots.
Only once all three stages have happened does a buy become possible: at the first close back above the 5-day line (SMA5). The sell happens at the first close 11 percent or more above the entry price — at the latest, though, at the close of the 12th trading day, whether or not the target was hit. The average hold runs 9.1 trading days.
The result: a real, if narrow, edge
| Metric | Rule | vs. S&P 500 |
|---|---|---|
| Median per trade | +6.39% | +3.47 points |
| Winsorized mean per trade | +3.70% | +1.87 points |
| Hit rate | 66.6% | — |
| Return per trading day | +0.41% | — |
| Profit target (11%) hit | 43.7% of trades | — |
Throughout this and every table below, “points” always means percentage points of edge for the rule over the index across the same window — not the index's own return.
A winsorized mean is a robust average: it doesn't give extreme outliers full weight, but it doesn't discard them entirely the way a pure median would either. At a 66.6% hit rate, the majority of trades win, and the typical trade (median) returns 6.39% — more than the index typically manages over the same window (median +1.6%). Only 43.7% of trades actually reach the 11% profit target; the rest are sold by the 12th trading day at the latest, whether that lands as a gain or not.
Why the net figure is the headline number
At an average hold of nine trading days, the rule generates a lot of trades in a given year — trading costs weigh noticeably more here than for a strategy that buys rarely and holds for years. So instead of one flattering, single cost assumption, we use a realistic mixed-cost scenario: trades are split into three roughly equal thirds by trading liquidity (3,303, 3,302, and 3,303 trades) and charged 0.5%, 0.2%, or 0.1% cost per side respectively — the less liquid the stock, the more expensive the trade. The S&P 500 benchmark deliberately carries NO costs at all. That makes the comparison additionally conservative, since a real index purchase isn't free either.
| Scenario | Cost per side | Winsorized mean | vs. index |
|---|---|---|---|
| Gross (no costs) | 0% | +4.26% | +2.42 points |
| Flat scenario | 0.2% on every trade | +3.84% | +2.01 points |
| Mixed scenario (headline) | 0.5% / 0.2% / 0.1% by liquidity third | +3.70% | +1.87 points |
| Flat scenario, expensive | 0.5% on every trade | +3.22% | +1.38 points |
The edge stays positive in every cost scenario tested — it narrows as costs rise, but never flips negative in any variant. Gross, with no trading costs at all, the median sits at +6.91%, the winsorized mean at +4.26%, and the hit rate at 67.8%. The gap to the net figure under the mixed scenario is noticeable, but not large enough to overturn the study's conclusion.
Robustness: broadly supported, no outlier year
An edge that comes from a single good year or a single market phase isn't a reliable rule. So we checked whether it holds up across years, liquidity classes, and market segments.
| Subgroup | vs. index |
|---|---|
| Liquidity third 1 (least liquid trades) | +1.43 points |
| Liquidity third 2 | +1.91 points |
| Liquidity third 3 (most liquid trades) | +2.28 points |
| Listed stocks | +1.93 points |
| Later-delisted stocks | +1.75 points |
| Excluding entry years 2020 and 2021 (N=6,998) | +2.06 points |
All three liquidity thirds come out ahead, listed and delisted stocks alike come out ahead, and all three calendar thirds of the study period come out ahead. Most notably: stripping out the two exception years 2020 and 2021 entirely — 2,910 of the 9,908 entries drop out — still leaves 2.06 percentage points of edge, even slightly more than over the full period. This is not a Covid-recovery story.
The year-by-year record backs this up too: 15 of 17 entry years beat the index. Only two years are negative — 2014 at −0.27 points and 2021 at −0.23 points — and in both years the median is still positive; only the robust mean slips just below zero.
How the rule came together: three development stages
The final rule is the result of a three-stage test, and the order itself is part of the finding: only the combination of an early entry and a short exit beats the index — neither ingredient works alone.
Stage 1: the full test of the base rule
The first test bought conservatively, only once the price was back above the 20-day line, and held for 120 trading days. Even here the signal carries demonstrable information: the median after 120 days is +4.63%, against just +0.14% on random days in the same stocks (control group). Against the index, though, this base rule loses clearly — 7.36 percentage points behind on the median, gross.
Stage 2: an earlier entry above the 5-day line
The second test replaced the entry above the 20-day line with the earlier entry above the 5-day line — a median of 9 trading days sooner and 6.0% cheaper. The 120-day median climbs to +9.16% (from +4.63%), and the gap to the index narrows to 5.44 points (median, gross, versus 7.36) — but it's still there. An earlier entry alone isn't enough.
Stage 3: the systematic exit test
The third test systematically checked every hold period from 1 to 30 days and every profit target from 1 to 50 percent — 1,500 combinations in total. Result: the signal's edge concentrates in the first two weeks and decays afterwards. With the late entry above the 20-day line — measured on the winsorized mean, the robust measure — NOT ONE of the 1,500 combinations gets into positive territory against the index. With the early entry above the 5-day line, every single one does: all 1,500 combinations come out ahead of the index, and 1,291 of 1,500 do on the median too — including the main rule in this study (11% target, exit by day 12 at the latest). Stop-losses were also tested systematically, from 1% to 50% distance: all 50 variants worsen the result, without exception.
The weak spot: crashes of 50 percent or more
Splitting the 9,908 trades by the severity of the preceding crash reveals a clear limit. At drops of 50% or more (1,116 trades), the short recipe loses against the index — 5.44 percentage points behind. At crashes that violent, the slower path looked better at first (winsorized mean): buying only once the price is back above the 20-day line, then holding for 120 trading days. That this is the same figure as the gap at the second development stage is a coincidence of two different calculations: there it is the median across all 9,908 trades before costs, here the winsorized mean within the deep-crash segment after costs. This study explicitly does not present itself as a universal rule for every crash — at the harshest cases, the advantage reverses.
Follow-up tested — and refuted. We ran the "just hold long through a catastrophe" idea as a pre-registered follow-up test: the 1,116 trades that fell 50 percent or more and, as a second extreme segment, the 1,983 trades with a daily close 30 percent or more below the 20-day line (698 cases sit in both groups), each with entry above the 5-day line as well as above the 20-day line, hold periods of 60, 120, 180 and 240 trading days, costs and a random-day control included. On paper it looks spectacular: up to 36.3 percentage points ahead of the S&P 500 (winsorized mean, net under the mixed-cost scenario, held 240 trading days, bought above the 20-day line). But the edge does not survive the time test. Strip out the 2020 and 2021 entry years and ALL four tested variants turn negative — between 0.3 and 14.7 percentage points behind the index (winsorized mean, net). In the strongest of those variants, 11 of the 17 entry years trail the index, and of the three calendar thirds of the study period only the middle one comes out ahead — the one containing the Covid crash. So there is no viable catastrophe recipe: the short rule stands, and for crashes of 50 percent or more we know of no reliable alternative. The warning badge in the scanner is there for good reason.
How we computed this
- Universe and period. US stocks, entries 2010 through 2026, everything on daily closing prices.
- Survivorship-free. Stocks that have since been delisted stay in the dataset — otherwise only the survivors would be measured.
- 9,908 complete trades across 5,008 stocks meet all three stages of the rule and trigger a buy signal.
- Cost model. A realistic mixed scenario by trading liquidity: trades are split into three roughly equal thirds (3,303 / 3,302 / 3,303) and charged 0.5%, 0.2%, or 0.1% cost per side respectively. The index comparison deliberately carries no costs.
- Sell rule. First close 11% or more above the entry price, at the latest the close of the 12th trading day — regardless of whether the target was reached.
What this study does not say
- The rule was developed on the same data it is measured on (in-sample). The broad robustness across years, liquidity classes, and listed as well as delisted stocks mitigates that risk, but it doesn't replace a test on new, future data.
- Everything runs on daily closing prices. In real trading, profit targets would likely fill somewhat better — but real execution prices within a trading day aren't guaranteed.
- The index comparison carries no costs on the index side. A real index purchase isn't free either; the comparison is deliberately computed conservatively, in the index's favor.
- Short holds mean a lot of trades. Costs and taxes weigh noticeably heavier on this rule than on long-term strategies that trade rarely.
- At crashes of 50% or more, the short recipe fails against the index (see above) — and the follow-up test shows that holding long is no reliable alternative there either.
- A backtest is not a forecast. This study is market research, not investment advice and not a buy recommendation.
What we built from it
The backtest turned into a daily-updated scanner in our "vetted scanners" category: Crash Reversal. It applies the tested rule to our stock universe every day — death cross, at least a 20% crash, capitulation with at least 15% distance below the 20-day line, buy signal at the first close back above the 5-day line. Every hit carries its crash depth beside it, so this rule's weak spot stays visible. A hit there is a find, not a buy signal: this study says under what conditions the rule held up in hindsight — not that it will do so again.
Readers who want to see the opposite side of the same chart pattern — what the death cross means for holders and for short traders — can find it in our Parabolic Death Cross study. More backtest studies live together under Studies.
This article is a historical analysis of publicly available price data and not investment advice. It contains no buy or sell recommendation, no forecast, and no statement about any individual company trading today — the accompanying scanner is no substitute for independent research either. Past results — whether simulated or real — are not a reliable indicator of future returns. Anyone making investment decisions should assess their own situation and risks, if in doubt with professional advice.
Frequently Asked Questions
A buy rule built in three steps. First, a death cross: the 10-day line (SMA10) falls from above to below the 20-day line (SMA20), on a daily-close basis. Second, a real crash: from the close on the cross day to the lowest subsequent close, the stock loses at least 20 percent. Third, capitulation: at least one day closes 15 percent or more below the 20-day line — the moment the sell-off visibly overshoots. Only once all three stages have occurred does a buy become possible: at the first close back above the 5-day line (SMA5). The sell happens at the first close 11 percent or more above the entry price, at the latest at the close of the 12th trading day. This was tested across 9,908 complete trades in 5,008 US stocks, entries between 2010 and 2026, including stocks that have since been delisted.
Because a rule that holds for nine trading days on average generates a lot of trades — and trading costs weigh more heavily on short holds than on long-term strategies. So we use a realistic mixed-cost scenario instead of one flattering flat assumption: trades are split into three roughly equal thirds by trading liquidity (3,303, 3,302, and 3,303 trades) and charged 0.5%, 0.2%, or 0.1% cost per side respectively — the less liquid the stock, the more expensive the trade. The S&P 500 benchmark deliberately carries NO costs at all, which makes the comparison additionally conservative, since a real index purchase isn't free either. Even under these conditions the edge stays positive: winsorized mean +3.70% per trade versus +1.87 percentage points for the index. Under a flat scenario of 0.2% per side on every trade the edge grows to 2.01 points, and gross with no costs at all to 2.42 points. Even under the most expensive flat scenario (0.5% for every trade) it stays positive at 1.38 points — the rule doesn't flip negative under any tested cost scenario.
No. Stripping out every entry from 2020 and 2021 entirely — 2,910 of the 9,908 trades — leaves 6,998 trades, and the edge against the index rises slightly, from 1.87 to 2.06 percentage points net under the mixed scenario. The year-by-year record backs this up too: 15 of 17 entry years beat the index; only 2014 (−0.27 points) and 2021 (−0.23 points) are negative, and in both years the median is still positive — only the mean slips just below zero. All three liquidity thirds (+1.43, +1.91, and +2.28 points), listed stocks (+1.93 points) and delisted stocks (+1.75 points), and all three calendar thirds of the study period each come out ahead individually.
Because two levers have to come together, as the development history of this rule shows. The full test of the base rule — buying only once the price is back above the 20-day line, holding for 120 trading days — first shows the signal carries real information: the median after 120 days is +4.63%, against just +0.14% on random days in the same stocks (control group). Against the index, though, this base rule loses clearly — 7.36 percentage points behind on the median, gross. An earlier entry above the 5-day line — a median of 9 trading days sooner and 6.0% cheaper — lifts the 120-day median to +9.16% and narrows the gap to 5.44 points (median, gross, versus 7.36), but does not flip it positive. Only the third step tips the comparison: a systematic test of all 1,500 combinations of hold period (1 to 30 days) and profit target (1 to 50%) shows the signal's edge concentrates in the first two weeks and decays afterwards. With the late entry above the 20-day line — measured on the winsorized mean, the robust measure — NOT ONE of the 1,500 combinations gets into positive territory against the index. With the early entry above the 5-day line, several do — including the main rule presented in this study (11% target, exit by day 12 at the latest). Stop-losses were also tested systematically, from 1% to 50% distance: all 50 variants worsen the result, without exception.
No, not in any variant tested. We ran stop distances from 1% to 50%, and all 50 variants worsen the result against the stop-free rule. The reason lies in the nature of the rule: after a violent capitulation the price action is volatile, a tight stop triggers often before the actual recovery unfolds — so the stop realises the short-term setback rather than protecting against it.
At the most brutal crashes. Splitting the 9,908 trades by the severity of the preceding crash reveals a clear limit: at drops of 50% or more (1,116 trades), the short recipe loses against the index — 5.44 percentage points behind. At crashes that violent, the slower path looked better at first: buy only once the price is back above the 20-day line, then hold long. We ran exactly that as a pre-registered follow-up test — both extreme segments, both entry variants, hold periods up to 240 trading days. The apparent edge of up to 36.3 percentage points (winsorized mean, net under the mixed-cost scenario) disappears as soon as the 2020 and 2021 entry years are stripped out: all four tested variants then fall behind the index. So the short recipe stands, and for crashes of 50% or more we know of no reliable alternative. That is the one genuine weak spot in this study, and the reason we don't treat it as a universal rule for every crash — at the harshest cases, the advantage reverses.
Both studies look at the same technical event — the death cross, when the 10-day line falls below the 20-day line — but from opposite directions. The Parabolic Death Cross study asks what to do at the death cross after a parabolic run-up: an exit signal for holders, but a failed recipe as a short, because rare short squeezes eat the average return. This study starts at the opposite end: it asks whether the moment of capitulation after a crash — not the cross itself, but the later reversal beyond it — is a good moment to buy. The two rules were developed and tested independently of each other; they sit as the top and bottom of the same chart pattern without depending on one another.


