Parabolic Death Cross Study: What the MA10/MA20 Cross Is Actually Worth After a Parabolic Run
Exit signal yes, short no: a stock rips parabolically higher, then its 10-day moving average crosses back below the 20-day average — the "death cross." We ran the numbers on 147,403 such crossings since 2010, survivorship-free, with real delistings included. For holders of strong parabolas, the cross works as an exit signal — it caps the catastrophic losses, but costs something on average because it also cuts off the occasional continuation rally. As a short recipe, though, it does NOT work: the typical trade wins, but the average across all trades loses, because rare short squeezes eat the entire edge.
 Thomas Mücke
Founder & Publisher
Thomas Mücke
Founder & Publisher
Anyone who has watched charts for a while knows the pattern: a stock starts to accelerate, the candles get steeper, the 10-day moving average pulls well above the 20-day average — a parabola. And at some point it tips over: the short average falls below the long one, the "death cross." Many read that as a clear sell signal, some as an invitation to go short.
We wanted to know whether either read holds up, so we ran the numbers on 147,403 such crossings in US stocks since 2010, survivorship-free, with real delistings instead of only the survivors. The result cuts both ways: the cross works as an exit signal — it does not work as a short recipe, because the typical trade wins while the average across all trades loses.
The result in four numbers
Did the death cross work as an exit signal for holders of strong parabolas — and did it work as a short entry? Four numbers carry the result:
- +4.99 percentage points was the median savings from selling at the cross instead of holding, over 60 trading days, for strong parabolas (3,905 events) — as an exit signal, the cross worked. The winsorized mean of that same savings was -2.2 percentage points: insurance, not a source of extra return.
- -48.5% was the median peak-to-trough drawdown of such parabolas — more than half of it, 51.5%, happened AFTER the cross, not before.
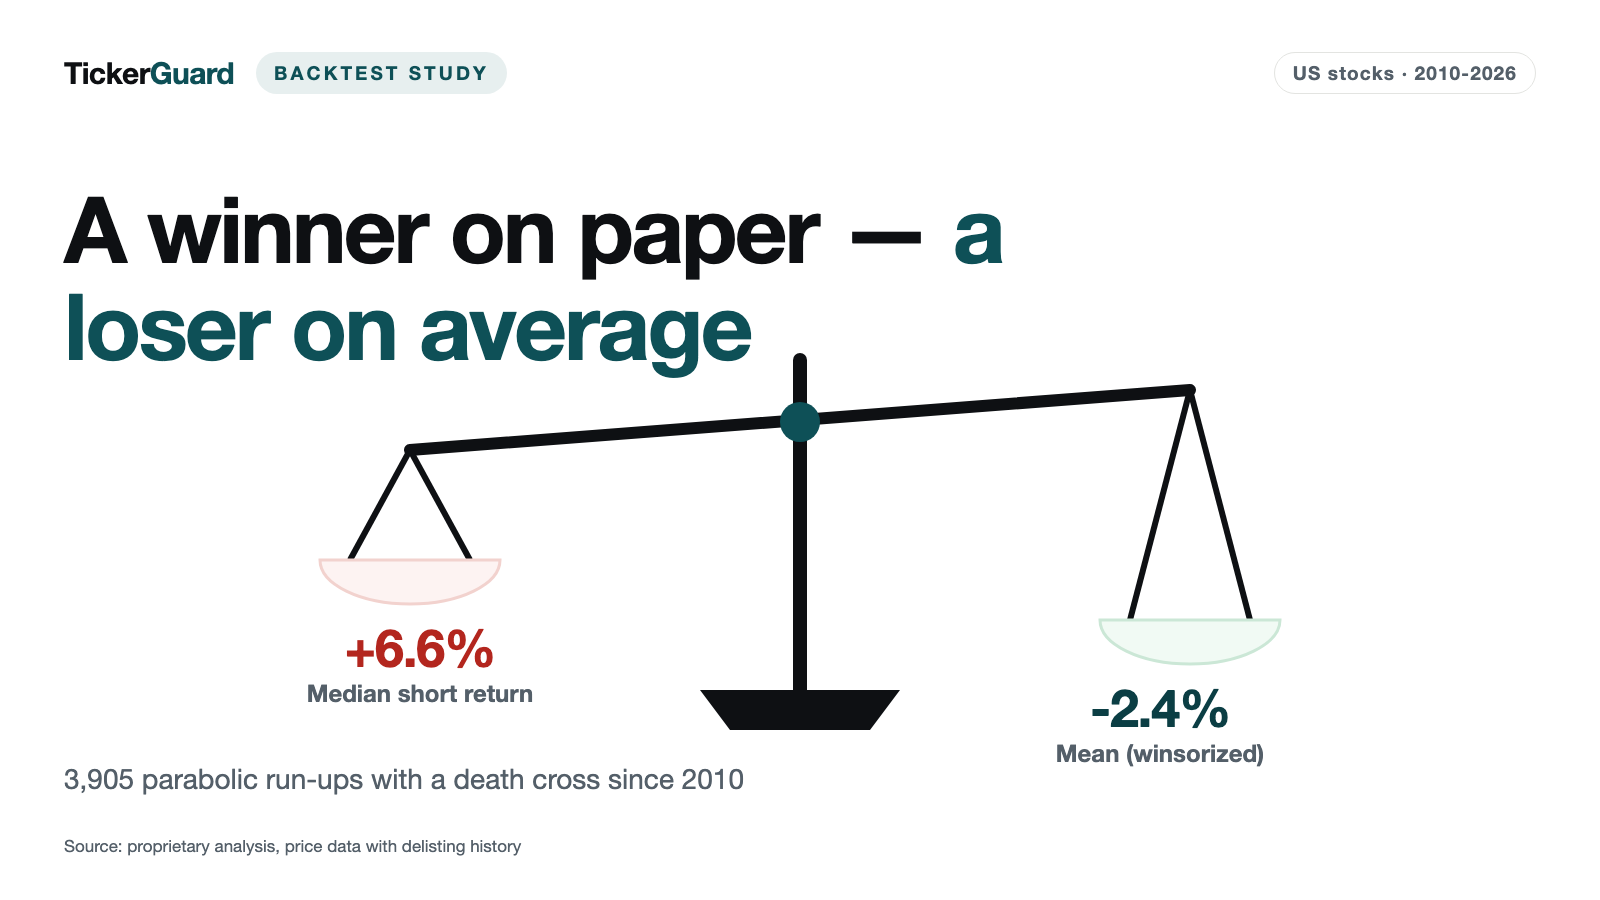
- +6.6% was the median return of a short entered at the cross over 60 trading days, at a 57.4% hit rate — at first glance, that looked like a short recipe.
- -2.4% was the winsorized mean of those same short trades: rare short squeezes ate back the gains of the many small winners. As a short recipe, the cross did not work.
In the tested window from 2010 to 2026, the death cross behaved like insurance against the crash for holders of strong parabolas, while it failed as a short signal on the negative winsorized mean.
Setup: 147,403 crossings, two applications, one surprising split
The pattern is simple: SMA10 above SMA20 (daily basis, adjusted closes) during a parabolic rise, then the crossing SMA10 below SMA20 — the death cross. Of the 147,403 raw events, 3,396 edge cases fall out (crossing on or after May 2026, too close to the data edge for a complete outcome window). Of the remaining 144,007, the main analysis applies further quality filters — data breaks removed (7.2% of raw events, including one apparent stock that turned out to be two different companies spliced under one ticker), plus suspected splits and price gaps removed, raw price at least $1, median dollar volume at least $1 million — landing at 74,742 events. A narrower subset, called "STRONG," additionally requires a rise of at least 100% AND a high that is also the 120-day high: 3,905 events. Two questions were put to this data: does the cross work as an exit signal for someone who already holds the stock (Application B)? And does it work as a short entry (Application A)? The answers diverge in a surprising direction.
For holders: insurance, not a return source
For STRONG events, the drop after the high is brutal: the median peak-to-trough loss is 48.5%. What matters for whether the cross works as a warning: more than half of that drop — 51.5% at the median — happens AFTER the cross, not before. Selling at the cross instead of holding does not miss the main move; it avoids a substantial part of it.
| Hold period from sale point | Median savings vs. holding | Savings > 0 in |
|---|---|---|
| 20 trading days | +1.24pp | 53.1% |
| 60 trading days | +4.99pp | 57.5% |
| 120 trading days | +7.49pp | 57.9% |
At first glance, a clear yes: selling at the cross beats holding, on the median and in the majority of cases. But a closer look tempers that considerably: the winsorized mean of the savings — a robust average across ALL cases that caps extreme outliers rather than ignoring them — sits at -2.2 percentage points at 60 days. Slightly negative. The honest reading: the cross signal is insurance against catastrophe, not a source of extra return. It reliably caps the worst crashes, but costs something on average, because it occasionally sells a stock that goes on to run again — a continuation a holder would have missed. For moderate rises (30-100% instead of the full STRONG definition), the effect nearly disappears: there, the median savings in the main analysis sits near zero or slightly negative. The signal works specifically for genuinely strong parabolas, not for every MA10/MA20 cross.
For short traders: wins on the median, loses on average
This is where the real point of this study begins. A short entered at the cross looks tempting at first glance:
| Metric (STRONG, 60 trading days, short with no stop) | Value |
|---|---|
| Median | +6.6% |
| Hit rate | 57.4% |
| Winsorized mean | -2.4% |
The median and hit rate favor the short: more than half of all trades win, and the typical gain runs 6.6%. The winsorized mean flips negative, though. The cause lies in the SHAPE of the distribution, not its center: most short trades produce moderate gains, but a small minority runs extremely against the short — a squeeze, where the price explodes instead of continuing to fall. One example in the underlying data, from 2026, shows a position that ran +226% against the short. Rare but extreme outliers like that arithmetically eat back the gains of many small winners. The median shows what the typical trade does; the mean shows what a portfolio of very many such trades would have earned on average. For this signal, the two answers point in different directions.
In the broader main analysis (all rises from 30% up, not just STRONG), the short is completely dead — there, even the median is negative. Only at extreme rises above 400% does an exception appear: there, the winsorized mean turns slightly positive too (+8.5% at 163 events over 60 days) — a rare edge observation with a small sample, not a workable recipe. And none of these figures include borrow costs or actual short-sale availability — both would likely make the picture worse still.
Stops make it worse, not better
An obvious reflex: if rare squeezes wreck the mean, shouldn't a stop-loss help? The opposite is true. Tested were fixed stops at 10%, 15%, 20%, and 25%, a 15% trailing stop, and a re-cross exit (exit as soon as SMA10 climbs back above SMA20, capped at 120 trading days).
| Variant (STRONG, 60 trading days) | Median | Stop-out rate |
|---|---|---|
| No stop | +6.6% | — |
| 10% stop | -11.4% | 69.5% |
| 15% stop | -15.9% | 61.2% |
| 15% trailing | -6.2% | 96.6% |
| Re-cross exit | -2.8% | 99.9% |
Every stop variant massively worsens the median compared to the no-stop version — at stop-out rates between 47% and 70% of all trades depending on the stop distance, and 97% for the trailing stop. A tight stop on a volatile short squeeze almost always triggers first, before the underlying move actually plays out — the stop doesn't protect against the squeeze, it realizes it. The same pattern showed up in our Trio Short study: tight stops aren't risk management for this signal type, they're an extra drag on returns.
Profit targets: better optics, same underlying problem
What if, instead of capping a loss, you lock in a gain? Tested were fixed profit targets of 5%, 10%, 15%, and 20%, otherwise a forced exit after at most 60 trading days. In the table, the median is net (after 0.4% round-trip cost); hit rate and winsorized mean are gross (before costs).
| Target | Net median | Hit rate (gross) | Winsorized mean (gross) |
|---|---|---|---|
| 5% | +6.3% | 84.3% | -0.4pp |
| 10% | +10.9% | 76.5% | -0.8pp |
| 15% | +15.5% | 69.8% | -1.5pp |
| 20% | +19.9% | 65.8% | -1.1pp |
At first glance this looks like the fix: hit rates up to 84%, clearly positive medians. But the winsorized mean stays slightly negative in every variant. A profit target caps gains from above — the maximum payoff on any trade is limited to 5-20% — while a short squeeze running against the position stays uncapped. The result: many small, reliable wins and rare, ruinous losses. The exact pattern that makes the short fail as a recipe persists — it's just better disguised.
Entering earlier? Counterproductive
One more obvious idea: why wait for the cross if the rise is visibly already tipping over? Tested was the first close that lands 5%, 10%, or 15% below the 20-day line (SMA20), searched in the window from the high through 30 trading days after the cross — despite the name, a lagging rather than a leading criterion: at the 5% threshold, this entry lands at a median 2 days BEFORE the cross; at 10%, at a median right ON the crossing day itself (only 48.3% of cases are earlier at all); at 15%, at a median 2 days AFTER the cross (only 31.8% earlier). The result still runs clearly the other way: at the 10% and 15% thresholds, this entry lands, at the median, 3-8% BELOW the later crossing price. At 10%, it loses against the cross entry on an exactly identical subset of events, on every single metric (no such direct comparison exists for 15%). At the 5% threshold, the median difference is practically zero. Entering too early buys (or shorts) into a move that isn't over yet, instead of waiting for confirmation from the cross.
A five-filter test for "genuine" parabolas
Not every STRONG crossing looks like a genuine parabola — some arise from a single one-day jump, some from a slow grinding trend, some from an MA20 break in the middle of the rise. From nine explicitly flagged unwanted patterns, five filters were derived: the share of a single one-day jump in the total rise, the age of the signal since the high (more than 15 days counts as "old"), a slow-grind trend score (persistence above 45), an MA20 break during the rise, and too small a distance of the crossing from the MA20 (below 85%). Applied to the 3,905 STRONG events and combined with the rule "short at the cross, 15% target, 15% stop, day-10 time exit," 842 events remain (839 with a fully computable outcome).
| Population | Hit rate | Median | Winsorized mean |
|---|---|---|---|
| Only the five "genuine parabola" filters (839 tradeable) | 49.2% | -0.35% | -0.58% |
| Unfiltered, for comparison (3,893 tradeable) | 50.7% | +0.43% | -0.35% |
The result is sobering: the filters make the short slightly WORSE, not better — both hit rate and median dip somewhat versus the unfiltered comparison. Hunting for the "genuine" parabola doesn't help the short recipe, because the real problem isn't a few ugly individual price paths — it's the underlying shape of the distribution: rare, extreme counter-moves that no characteristic filter reliably screens out in advance.
Where the signal lives: illiquid names, real information only for STRONG
The effect concentrates clearly in less liquid stocks. At $1-5 million in daily dollar volume, short performance over 60 days is at its best (median slightly positive); already in the next class ($5-25 million) the median turns negative and keeps falling as liquidity rises — worst above $100 million in daily turnover. An intuitive pattern, since large, heavily traded stocks run into extreme parabolic moves less often and are harder to short without triggering squeezes of their own.
To check whether the signal carries real information rather than pure noise, a control group was used: for each event, a random trading day in the same stock, with the same windows. The difference is clear, but only for STRONG events: the real crossing day beats the random day by 4.8 percentage points at the median and 5.0 percentage points in hit rate (60 trading days). For the broader main analysis, that edge shrinks to 0.4 and 1.2 percentage points respectively. So the signal does carry real information — but mostly for genuinely strong, clearly identifiable parabolas, not for any arbitrary MA10/MA20 cross. Excluding the two major market-stress windows (February-April 2020, all of 2022) barely changes the picture — this isn't purely a crash effect.
Limitations of this study
- Borrow costs and availability are entirely absent. None of the short metrics in this study account for the cost of borrowing the stock, or whether it was actually available to short at that point in time — for strongly parabolic, often smaller stocks, both are a real issue and would likely make the result worse still.
- Stops are computed on a closing-price basis. Signal and exit occur on the same day's close; a stop triggered intraday would likely be less favorable in practice, since intraday swings are often more extreme than close-to-close moves.
- Fine-grained subgroups thin out fast. Breaking down by gap size, liquidity class, or filter combination sometimes cuts the sample sharply (e.g. only 163 events for rises above 400%) — such edge cases are more a hint than a robust result.
- Trading costs are a flat assumption. 0.2% per leg approximates bid-ask spread and fees only roughly; for the less liquid names where the signal is strongest, the real drag could run higher.
Anyone who wants to apply this rule to today's candidates can use our new scanner, Parabolic Death Cross — it surfaces stocks that currently form a parabolic death cross under the definition tested here. This isn't a buy or sell signal; it's a tool applying the same criteria examined in this study. Readers who want to see the same survivorship-free approach applied elsewhere can find it in our Trio Short study — where stops hurt returns in the same pattern. More backtest studies live together in Studies.
Figures as of August 5, 2026.
This article is a historical analysis of publicly available price data and not investment advice. It contains no buy or sell recommendation, no forecast, and no statement about any individual company trading today — the accompanying scanner is no substitute for independent research either. Past results — whether simulated or real — are not a reliable indicator of future returns. Anyone making investment decisions should assess their own situation and risks, if in doubt with professional advice.
Frequently Asked Questions
A parabolic price run-up is a phase where a stock rises sharply and with acceleration, visible as its 10-day moving average (SMA10) pulling above its 20-day average (SMA20). The "death cross" is the moment SMA10 falls back below SMA20 — a classic technical signal that the run is ending. This study analyzed 147,403 such crossings in US stocks since 2010, survivorship-free (delisted stocks included), with 0.2% cost per leg in the net figures.
For a genuinely strong parabola (rise >= 100%, high = 120-day high), selling at the cross instead of holding produced a median advantage in the tested window: +1.24 percentage points after 20 days, +4.99pp after 60 days, +7.49pp after 120 days — plausible, since the median peak-to-trough drawdown on such stocks was -48.5%, and more than half of it (51.5%) happened AFTER the cross, not before. The caveat matters, though: the winsorized mean of the savings was slightly negative (-2.2pp at 60 days). The cross behaved like insurance against the crash, not a source of extra return — in the tested window it cost something on average because it occasionally sold a stock that went on to rally again. For moderate rises (30-100%) the signal was essentially useless.
No, not as a reliable recipe — even though the first number suggests otherwise. For STRONG events, a short entered at the cross over 60 trading days returns a median +6.6% at a 57.4% hit rate. But the winsorized mean across all trades is -2.4%: the loss distribution is right-skewed because rare short squeezes make individual trades extremely costly and tip the whole ledger — one position in the data ran +226% against the short in 2026. The typical trade wins; the portfolio across many trades loses on average. For moderate rises (30-100%) the short is completely dead; only at extreme rises above 400% does the mean turn slightly positive too (+8.5%, N=163) — a rare exception, not a recipe. Borrow costs and short-sale availability aren't factored in at all here.
That's the core finding of this study. The median describes the TYPICAL trade — it is the value above which half of all trades land; and because it is positive here, more than half of all trades win (57.4% hit rate). The winsorized mean (a robust average that caps extreme outliers instead of ignoring them entirely) describes what an investor would have earned ON AVERAGE across a very large number of trades. When many trades win small amounts and a few lose extremely — as with a short caught in a squeeze — the median can be clearly positive while the mean stays negative. This exact pattern shows up in every short variant in this study: profit targets lift the median and hit rate (at a 20% target: net median +19.9%, 65.8% hit rate), yet the winsorized mean (gross, before costs) stays slightly negative (-0.4 to -1.5pp) — many small wins, rare ruinous losses.
No, not in this analysis. Stops (10%, 15%, 20%, 25%, a 15% trailing stop, a re-cross exit) massively worsen the median in every tested variant — stop-out rates run 47-70% depending on the stop distance, and 97% for the trailing stop. Entering at the first close 5%, 10%, or 15% below the 20-day line instead of waiting for the cross is also counterproductive — despite the name, a lagging rather than a leading criterion (median trigger day: 5% two days before the cross, 10% on the cross day itself, 15% two days after): at 10% and 15%, the entry lands at a median 3-8% below the later crossing price; at 10%, it loses against the cross entry on an identical subset of events, on every single metric (no such comparison exists for 15%). At the 5% threshold, the median difference is practically zero. Even a five-filter test for "genuine" parabolas, derived from nine negative examples flagged by hand (single-day-jump share, signal age, slow-grind trend, MA20 break during the rise, cross distance from MA20), narrows STRONG from 3,905 to 842 events (839 tradeable) — but does not improve the result: a 49.2% win rate, median -0.35%, winsorized mean -0.58%, versus 50.7% / +0.43% / -0.35% for the unfiltered comparison. The filters make the short slightly worse, not better.
The base figures — 147,403 crossings 2010-2026, survivorship-free, 74,742 in the main analysis, 3,905 STRONG events, 0.2% cost per leg — rest on a broad dataset with purpose-built data-break, suspected-split, and gap filters (the data-break filter alone excludes 7.2% of raw events). A control group (a random day in the same stock) shows the signal carries real information, but clearly only for STRONG events (+4.8 percentage points median, +5.0pp hit rate at 60 days versus the control) — for moderate rises, barely at all. Delisting sensitivity is small (-0.29 percentage points versus the 'last available price' variant), and excluding the 2020/2022 crash windows shows an almost identical picture. Caveats: borrow costs and actual short-sale availability aren't in the data, stops are computed on a closing-price basis (intraday stops would likely be worse), and the analysis evaluates a backward-looking pattern, not a forecast for any individual stock trading today.


