The Bankruptcy Trio as a Short Strategy — A 2012-2026 Backtest
Our bankruptcy-warning study found a three-signal combination — an unreliable-figures notice, an auditor going-concern opinion, and short-term debt exceeding current assets — that called roughly half of its historical triggers into a 30-percent-plus price decline within three months. The obvious next question: can a private investor turn that into money with a simple, mechanical short-selling recipe? We built the trade exactly as a retail trader could run it — short at the next open, fixed profit targets, a fixed stop — and ran it survivorship-free from 2012 through 2026, including every stock that was later delisted. In the universe of stocks a retail account could actually borrow and short, the recipe loses money, and a realistic borrowing fee finishes the job. A 26 August 2026 update shows the other half of the finding: short the crash day itself and scale into the position across several tranches with no stop at all, and the same underlying idea holds up markedly better in the backtest — with caveats spelled out plainly in the article.
 Thomas Mücke
Founder & Publisher
Thomas Mücke
Founder & Publisher
Our bankruptcy-warning study found a three-signal combination sharp enough to earn its own scanner: a company tells the SEC its own published figures can no longer be relied upon, its auditor states substantial doubt about its ability to continue as a going concern, and its short-term debt exceeds everything it holds in current assets. History says roughly half of the stocks that ever lit up all three signals at once fell more than 30 percent within the next three months. The obvious next question is whether a private investor could have turned that into money — not by reading the signal, but by shorting it on a fixed, mechanical rule set anyone could follow.
We built that rule set as literally as a retail account could trade it and ran it survivorship-free from 2012 through 2026, including every stock that later delisted. In the universe of stocks a retail account could realistically borrow and short, it loses money before a single dollar of borrowing fee, and a real-world stock-loan rate finishes the job. In an update published 26 August 2026, we reran the same underlying question with a completely different, independently pre-registered entry idea — with a markedly different picture, below.
The result in four numbers
Could the bankruptcy Trio warning signal be turned into money with a fixed, pre-registered short-selling rule? Four numbers from the 2012-2026 backtest carry the answer:
- -1.55% per trade was the average return of the pre-registered primary variant — 61 short trades on the bankruptcy Trio between 2012 and 2026.
- 29.51% hit rate was achieved; roughly 34.7% would have been needed just to break even. The stop-loss closed 60.66% of all trades.
- -15.42% per trade was the result at a real-world borrowing fee of 50% per year; six of the eight tradeable variants were already negative before any borrowing fee at all.
- 52 to 53 percent of triggers in the original study led to a 30-percent-plus price decline within three months — several times the base rate of matched stocks without the signal. That predictive power of the signal is untouched by the trading rule.
- Update, 26 Aug 2026: a second, independently pre-registered backtest with a different entry idea — short immediately at the crash day's own close, scaled into the position across several tranches, no stop at all — reaches +19.6% average return per position in its strongest cell (median +25.8%, 49 cases), against real risks: only about 5 signals a year and, for the recipe that automatically adds tranches, an interim mark-to-market drawdown of up to 7.5 times the tranche's capital in the worst single case.
The signal reliably predicted price declines in the test window, but the original fixed short-selling rule turned that into a loss, not a profit, between 2012 and 2026. A second, independent backtest with a different entry idea reaches a markedly friendlier — though equally risk-laden — picture: see the 26 August 2026 update below.
What we built, and what the timeline actually allows
The test reruns the historical scanner logic day by day rather than reading it off today's list: every trading day since the signal became technically possible, we check whether all three conditions were newly true, and treat that day as a trigger. Two versions of the trigger definition run side by side — the narrow definition matching the live scanner exactly, and the broad definition used in the original 792-bankruptcy study, run here as a robustness check. Both reproduce that original study's own published counts exactly: 98 episodes at a 53.06% three-month decline rate under the narrow definition, 115 episodes at 52.17% under the broad one, with zero deviations in either reconstruction.
Three dates matter for reading the results honestly. The going-concern-style balance-sheet check behind this signal only became computable from 29 January 2010 onward, so no Trio trigger can exist before then. The first trigger — under either the broad or the narrow, live-scanner definition — falls on 13 January 2012, which makes the honest test period 2012-2026, not "since 2005" and not "since 2010." (Restricted to the universe of stocks a retail account could realistically borrow and short, that first trigger moves to 30 March 2012 — a liquidity and price filter, not the trigger definition, accounts for the later date, and it is where the primary variant's 61 trades begin.) And triggers are cut off on 31 March 2026, the hard edge of currently available regulatory filings; the stocks that were triggered are then followed forward on price data through 3 August 2026.
Every assumption in the trade construction leans against the strategy rather than for it. Positions enter at the opening print of the first trading day with actual volume after the trigger — never at a theoretical same-day price. A stock can be rolled forward at most 10 trading days (an eleventh day is still allowed) and 21 calendar days before the trigger is marked "not entered" rather than silently dropped. Only one open position per company is allowed at a time; a second trigger on a company that already has an open short is recorded as blocked, not opened. Every cover carries a 0.5% execution cost against the position, and prices are computed in total-return (dividend-adjusted) space, which is the economically correct choice for a short seller, since the short pays the dividend. Splits are corrected only where a split is actually documented — a manual check found that 900 of 902 price jumps that an older, cruder detection method had flagged as splits were not splits at all, just real market moves that would otherwise have been erased from the price history.
The trading rules, exactly as tested
Four exit rules run against the same entries and the same 15% stop:
| Variant | Profit-taking | Stop-loss |
|---|---|---|
| -20% target | full position at a 20% price decline | entry price × 1.15 |
| -30% target (primary) | full position at a 30% price decline | entry price × 1.15 |
| -40% target | full position at a 40% price decline | entry price × 1.15 |
| Staggered | one third at each of -20% / -30% / -40% | entry price × 1.15 on the remainder |
The staggered variant does not move its stop to breakeven after the first tranche closes — the specification called only for the fixed 15% stop, and adding a trailing rule would have been an invented improvement, not a tested one.
Each trading day is resolved in a strict order, and where two outcomes could apply on the same day, the rule favors the less generous reading:
"Open first, then the trading range. If the stop and a profit target are hit on the same day, the stop applies first."
— execution rule, backtest results documentation, 4 August 2026.
Fills happen at the threshold price itself, never at the day's best or worst print; only a price gap through the level fills at the open. A second version of every run repeats the same logic using only the closing price to check the stop, as a check on whether intraday price spikes were doing unfair work — more on that below.
What 61 real trades produced
The pre-registered primary variant — chosen before any run was produced, specifically to avoid picking the best-looking result after the fact — is the -30% target, on the narrow (live-scanner) trigger definition, in the universe of stocks a retail account could actually have borrowed and shorted (last traded price at or above $1, and at least $250,000 in median daily dollar volume over the prior 20 trading days), with the stop checked against the full intraday trading range:
| Variant | n | Hit target | Stop-loss | Delisted | Win rate | Avg. return/trade | Median |
|---|---|---|---|---|---|---|---|
| -20% target | 61 | 34.43% | 55.74% | 9.84% | 36.07% | -2.86% | -15.57% |
| -30% target (primary) | 61 | 29.51% | 60.66% | 9.84% | 31.15% | -1.55% | -15.57% |
| -40% target | 61 | 24.59% | 65.57% | 9.84% | 26.23% | -0.23% | -15.57% |
| Staggered | 61 | 24.59% | 65.57% | 9.84% | 31.15% | -1.55% | -15.57% |
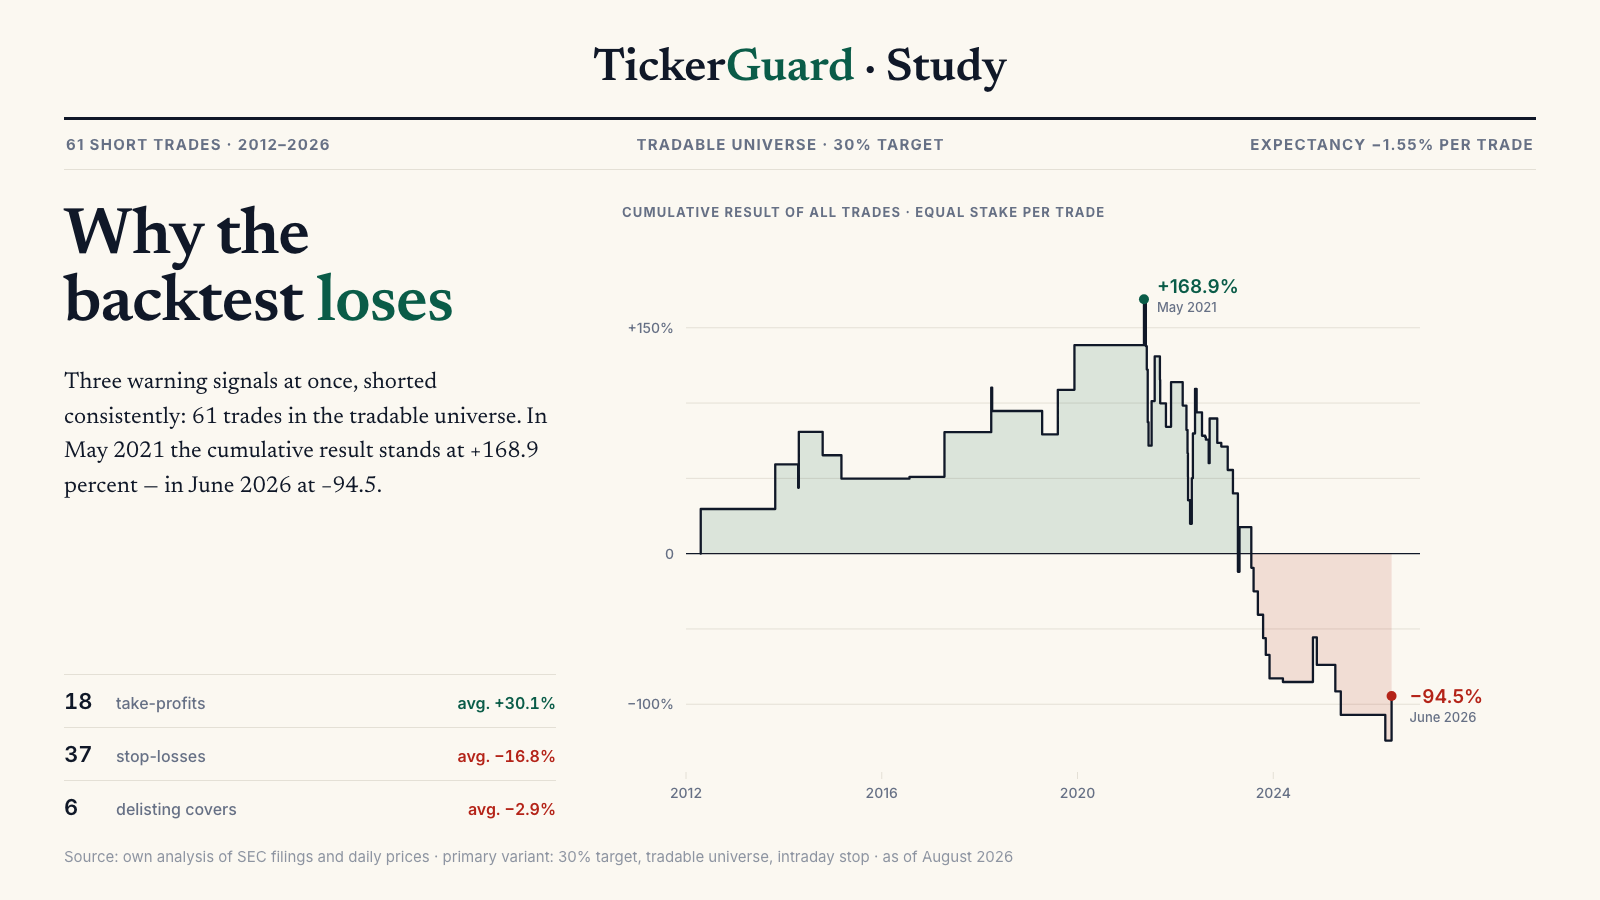
Every one of the four tradeable variants under the narrow definition loses money on average. After 61 trades at one notional unit of exposure each, the primary variant's equity curve sits at -0.945 units across the full 14-year window — spread across 57 different companies, with at most three trades from any single one, so this is not one bad name dragging down the average. Add a matching 0.5% cost on the entry side as well as the exit, and the primary variant's average falls further, to -2.05% per trade.
Widen the universe to every trigger, including the illiquid and effectively unshortable penny stocks a retail account could never actually borrow, and the picture flips on paper: the same -30% target variant shows a capped average of +1.48% per trade across 387 trades. That number is not a hidden opportunity — it is exactly the population this study deliberately excludes from the "tradeable" universe, and it includes trades that lost more than 100% of the position before being capped for the average (a forced buy-in when the loss exceeds the capital at risk) — six to seven such trades per run, seven different companies in total, the worst of them GWTI at -814.55%.
We also reran every combination using only the closing price to trigger the stop, to check whether short intraday price spikes were doing the damage. They were not: the closing-price version of the primary variant raises the hit rate to 37.7%, but the average return gets worse, not better — -2.66% instead of -1.55% — because the losses that do get through the looser stop are larger (one trade in that version lost 103.74%). The stop's timing is not the cause of the weak result.
Why it fails: the arithmetic behind the loss
The primary variant's average return decomposes cleanly: a 31.15% win rate at an average gain of +28.63%, against a 68.85% loss rate at an average loss of -15.20%, nets out to -1.55% per trade. The payoff ratio (a win roughly 1.9 times the size of a loss) sounds attractive, but it sets a hurdle: breaking even needed a hit rate near 34.7%. The strategy achieved 29.51% — short of the number it needed, not by a small margin most people would call noise, but short nonetheless.
The stop-loss decided 37 of the 61 trades, 60.66% of the total. Six more trades — 9.84% — closed only because the company was delisted while the position was open, and even those were not a bonus: their returns ranged from +1.2% to -11.1%, averaging about -2.9%, a softer outcome than the standard stop but still, on balance, a small loss. Only the remaining 18 trades that reached the -30% profit target carried the average, and there were not enough of them.
Two additional facts belong in any honest reading of this result. First, 59.02% of the primary variant's 61 trades — 36 of them — cluster in 2021 and 2022 alone, the post-pandemic speculative unwind. That is not fourteen years of independent evidence; it is mostly one market phase, and the hit rate inside that phase (28.6% in 2021, 18.2% in 2022) ran below the 14-year average, not above it. Second, 6 of the 61 entries (9.84%) would in practice have fallen under a short-sale price restriction the day after a sharp prior decline — a real-world friction this backtest, which has no order book, does not model. Both facts bias the result in the strategy's favor, not against it, which makes the -1.55% average the more, not less, credible number.
The number that finishes it off
None of the above prices in the cost of actually borrowing the stock to short it. We modeled that cost the simple way brokers do: an annual rate times days held, divided by 365, subtracted from the trade's return.
| Borrow rate (annual) | Avg. return/trade | Median | Win rate | Equity, 61 trades | Avg. fee paid |
|---|---|---|---|---|---|
| 0% | -1.55% | -15.57% | 31.15% | -0.945 | 0.00 pp |
| 50% | -15.42% | -16.53% | 29.51% | -9.404 | 13.87 pp |
| 100% | -29.28% | -18.89% | 24.59% | -17.863 | 27.73 pp |
| 250% | -70.88% | -24.18% | 14.75% | -43.239 | 69.34 pp |
Six of the eight tradeable rule variants are already negative with no borrowing fee at all. The two that were not — a +40%-target variant at +2.13% per trade and a staggered-exit variant at +0.27% per trade, both measured under the broader trigger definition — turn negative at borrowing rates of just 7.4% and 0.9% per year respectively. That is not a stress scenario; it is close to the floor of what a lender would actually charge for a normal, liquid short.
And these are not normal, liquid shorts. The companies in this test are overwhelmingly small and already in financial distress — exactly the group where stock loan is expensive, thin, or simply unavailable, and where a lender can force a buy-in in the middle of a trade. This backtest has no borrow-availability data and cannot measure that risk directly. What it can show is the sensitivity: the calculated edge is thin enough to disappear inside the first few percentage points of a real borrowing fee, which means that for any actual implementation, borrowing cost would not be one line item among several — it would be the deciding one.
What this means for the original signal
This result does not walk back the original bankruptcy-warning study. As a warning signal, the Trio combination remains one of the sharpest we measured: historically, roughly 52 to 53 percent of its triggers were followed by a 30-percent-or-worse price decline within three months, several times the base rate of a matched control stock with the same price, the same trading volume, and the same distance from its 52-week high but no active signal. That finding stands untouched.
What this backtest adds is a separate, harder question: does a fixed, mechanical trading recipe built on top of that signal — a specific entry timing, specific profit targets, a specific stop — actually convert the edge into money once real trading frictions are included? The answer here is no, at least not for this recipe. The signal is doing its job: stocks that trigger it really do fall more often and harder than similar stocks that don't. What defeats the strategy is the arithmetic of turning a probabilistic edge into a fixed-rule trade — a stop that closes 60.66% of positions is not automatically compatible with a signal that is "only" right roughly half the time on the underlying price move, and the mismatch between those two numbers is the whole story.
"The Trio was selected using the same data this backtest measures it against. The result is confirmatory, not evidence out of sample, and not a forecast."
— in-sample disclosure, backtest results documentation, 4 August 2026.
What this does, and does not, prove
It does not prove that these stocks can never be shorted profitably. It proves that this specific, fixed mechanical recipe — next-open entry, fixed 20/30/40% targets, a fixed 15% stop, no position sizing by signal strength, no trailing stop, no discretion — loses money in the tradeable universe once realistic borrowing costs are added, over the full 2012-2026 period this signal has existed. A different exit design, a time-based exit, position sizing tied to signal strength, or an options-based structure were not tested here and might behave differently; we make no claim about them either way. And as stated above, this is a confirmatory, in-sample test of a rule built on the same data it is measured against, not an independent replication.
Update, 26 August 2026: from the crash day to a tranche short
The recipe above only enters days or weeks after the actual crash, with fixed profit targets at 20/30/40% and a stop 15% above entry. A second, entirely separate, independently pre-registered backtest asks a different question: is the crash day itself — the day bad quarterly numbers send a stock down double digits — a usable short entry, if you short at that day's own close and set the stop at that same day's high? And does scaling into the position across several tranches beat a single position?
The new run covers 2011 through 2026 and uses the same three warning signs (an unreliable-figures notice, an auditor going-concern opinion, and short-term debt above current assets), but requires all three to be active at once in the twelve months before the crash day, and counts only crash days with at least a 10% same-day decline — in both the raw and the dividend-adjusted price, so a plain stock split cannot trigger a match. As usual, the design was written down before the numbers were run (pre-registered), so no favorable-looking result could be picked after the fact.
The starting point: a same-day stop fails again
The most obvious rule is also the strictest one: short at the crash day's close, stop at that same day's high, exit after 40 trading days at the latest. Across 76 triggers from 32 companies (2011-2026), the average (mean) return is +2.2%, but the median is -9.8%.
Both numbers are worth stating side by side, because they tell different stories. The average adds up all 76 outcomes and spreads them evenly — a handful of very large winners can pull it up on their own. The median is the typical, middle case: half of the 76 trades did better, half did worse. A positive average alongside a clearly negative median is exactly the signature of a few big winners masking a losing typical trade.
The cause is the same as in the recipe above: the stop closes 61% of all 76 trades before the hoped-for decline ever really gets going. A look at exactly those stopped-out trades adds an important piece of evidence: without the stop, they would have finished close to breakeven on average, and a subset of them (17 of 33 checked in detail) would even have closed in profit. The stop is not protecting against losses here — in most cases it is spending money that would not otherwise have been lost.
Drop the stop, and the picture turns
What happens if the stop is simply removed and the position is held for the full 40-trading-day window? Across 58 cases from the same 32 companies, the average return is +9.9%, the median +14.1%, at a 60% hit rate. The 95% confidence band around that average runs from +0.7% to +18.7% — repeat the test many times on fresh random draws from the same data, and the true average would fall inside that band 95 times out of 100. That the lower edge sits just above zero says the positive result is real, but not overwhelmingly certain.
The bounce finding: don't wait for a recovery
A natural refinement would be to wait for the stock to bounce a little before shorting, and enter only once that bounce rolls over. We tested exactly that, across several bounce thresholds and two entry variants — and the result argues clearly against it. The cases excluded by waiting for a bounce, because the stock never bounced and simply kept falling instead, were on average the best cases of all: an average return between +16.8% and +21.4% depending on the bounce threshold, with a confidence band around that average that stays entirely positive. That does not mean every individual case won — the range still ran down to a total loss in some cases — but on average, waiting for the bounce throws away precisely the strongest cases. A second finding reinforces this: every stop we tested made every single cell worse than the same cell run without a stop, by 7 to 24 percentage points depending on the bounce threshold and entry variant.
The headline result: a tranche build with no stop holds up
The strongest idea from the findings above can be combined: no stop, plus scaling into the position across several tranches instead of a single trade all at once. Rather than shorting the full planned position immediately, it is split into pieces, each with its own entry price and its own 40-trading-day clock; the model caps the loss on any single tranche at -100% of that tranche's stake. The recipes tested differ in WHEN the second and third tranche get added. Recipe S1 automatically adds the next tranche as soon as the price has risen a further 15% since the last tranche — that is, moving against the short position, betting that the decline still comes later. The strongest single cell instead only adds its second tranche after a genuine reversal: once the price first bounces (the "bounce") and that bounce then rolls over and turns down again.
| Recipe | n | Hit rate | Avg./trade | Median | 95% band (average) |
|---|---|---|---|---|---|
| S1 — 3 tranches, automatically adds a tranche on each further +15% rise against the position | 55 | 70.9% | +16.0% | +17.2% | +7.6 … +24.1% |
| Strongest cell — 2 tranches (immediate + after a failed bounce), shared 60-trading-day exit | 49 | 73.5% | +19.6% | +25.8% | +9.1 … +29.9% |
n = number of cases · average and median computed against the capital actually deployed in each tranche · 95% band = confidence band around the average (see explanation above).
Recipe S1 (three tranches, automatically adding a tranche on each further 15% rise against the position) averages +16.0% across 55 cases from 32 companies, and +15.9% with the year 2020 excluded — essentially unchanged, so 2020 is not distorting this particular result. The single strongest cell combines two tranches — one immediately on the crash day, a second only after a brief bounce rolls over again — with a shared exit for both tranches after 60 trading days: 49 cases, a 73.5% hit rate, +19.6% average, +25.8% median.
Those figures are computed against the capital actually deployed in each tranche. Anyone who has to set aside the capital for every planned tranche upfront — including tranches that never get filled because the price moves differently than expected — lands on a more realistic, lower number: computed against the total capital held in reserve, the return drops to roughly +7 to +9%.
Honesty and risk: the case against it
A markedly better result after a rule change deserves more caution, not less. These points belong in any honest reading of the update:
- Rare. Only about 5 signals a year, 32 companies across 15 years — not a strategy for daily trading.
- Concentrated. 45% of all cases fall in 2021 and 2022 alone, the post-pandemic speculative unwind and the rate hikes that followed — not a result spread evenly across 15 years.
- Interim risk — considerably larger than the final result suggests. While a position was still open, recipe S1's cases typically (median) showed a mark-to-market drawdown of around -11% of the capital deployed — that is the worst point on paper along the way, not the final result, and it applies across all cases, not only the ones that eventually won. In the worst tenth of cases, that interim drawdown reached around -47%, and the single worst case — a short squeeze — briefly showed a mark-to-market loss of roughly 7.5 times the capital deployed in that tranche, before the position was finally settled. That is not a realized final loss (the model caps the actual loss on any one tranche at -100%); it shows that anyone who cannot hold through the ride, or who covers out of concern mid-trade, can face a drawdown that looks many times larger than what the strategy actually loses in the end — a short position carries no natural ceiling on the way there.
- Borrowing costs. Modeled at 25% per year, in line with what these distressed micro-caps typically cost to borrow. The break-even borrowing rate runs from roughly 86% to 102% per year depending on the recipe — whether that borrow would actually have been available in each specific case is not something this backtest can check.
- Execution risk. A double-digit single-day decline often triggers the U.S. short-sale restriction (the uptick rule): short sales are then only allowed above the best bid, which can slow or block an immediate close-of-day fill.
- In-sample caveat. The Trio was selected using the same data this update measures it against — the same methodological caveat as the original recipe above.
Anyone who wants to follow current Trio triggers can find them continuously updated in our Bankruptcy Study: The Sharpest Three-Signal Combination scanner — not a buy or sell recommendation, but a continuously updated overview of the historical triggers.
The three underlying warning signals continue to run live in our Bankruptcy Study: The Sharpest Three-Signal Combination scanner, unchanged by this result — it remains a measured warning list, not a trading system. The original signal study, with the full breakdown of lead times, false-alarm rates, and the matched-control comparison behind the 52-53% figure above, is here: The Warning Signs Before Bankruptcy — 792 U.S. Cases Since 2005. Both studies, and everything that follows in this series, live in Studies.
Update numbers as of 26 August 2026.
This article is a historical analysis and not investment advice. It contains no buy, sell, or short recommendation and no forecast; individual companies named in it serve solely to illustrate historical price patterns. Short selling carries risks beyond those of a long position, including potentially unlimited loss and the possibility of a forced buy-in regardless of price. Anyone making investment decisions should assess their own situation and risks — if in doubt, with professional advice.
Frequently Asked Questions
Every historical trigger of our live scanner combination "Bankruptcy Study: The Sharpest Three-Signal Combination" (an unreliable-figures notice, an auditor going-concern opinion, and short-term debt above current assets, all within twelve months), traded as a short position from the open of the next trading day with volume. Four exit rules were tested — full-position profit-taking at -20%, -30%, or -40%, and a staggered version selling a third at each level — with a stop-loss fixed at 15% above the entry price in every case. The test runs 2012 through 2026 and is survivorship-free: stocks that were later delisted are covered at their last traded price rather than dropped from the sample.
For the pre-registered primary variant — the -30% target, the universe of stocks liquid and priced high enough for a retail account to actually borrow, and a stop checked against the full trading range rather than only the close — 61 trades produced a 29.51% hit rate and an average return of -1.55% per trade over 14 years. The median outcome was the stop-loss, a -15.57% loss. After 61 trades at one notional unit each, the equity curve sits at -0.945 units.
Because a signal that is right more often than chance is not automatically right often enough to cover a fixed stop-loss. The stop closed 60.66% of the 61 trades; the trade's own numbers — an average win of +28.63% against an average loss of -15.20% — needed a hit rate near 34.7% just to break even, and the strategy achieved 29.51%. A closing-price-only version of the same stop raises the hit rate to 37.7% but makes the average return worse, not better (-2.66% instead of -1.55%), because the losses that do get through are then larger. The stop timing is not the problem; the ratio of hit rate to payoff is.
They are the deciding factor. Six of the eight tradeable rule variants are already losing money before any borrowing fee at all. The two that were narrowly ahead — a +40%-target variant at +2.13% per trade and a staggered-exit variant at +0.27% per trade, both under the broader (non-live-scanner) trigger definition — turn negative at borrowing rates of 7.4% and 0.9% per year respectively. The primary variant, already at -1.55% per trade with no borrowing fee, falls to -15.42% at a real-world 50% per year. These are small, financially distressed stocks, exactly the group where stock loan is expensive, thin, or unavailable, and where a lender can force a buy-in mid-trade; the backtest cannot measure availability, only how little room there is before the fee erases the edge.
No — and that is the point of running the two studies side by side. As a warning signal, the Trio combination is one of the sharpest we found: it flagged roughly 52 to 53% of its historical triggers into a 30%-plus price decline within three months, several times the rate of a matched stock with the same price, volume, and distance from its 52-week high but no signal. What this backtest shows is that converting that real edge into a fixed, mechanical short-selling recipe — a specific entry timing, specific profit targets, a specific stop — is a separate problem with its own arithmetic, and this particular recipe does not clear it.
Yes — 18 of the 61 trades in the primary variant hit their profit target, averaging +30.15% each, and six more closed because the company was delisted while the position was open. But the delisted six were not a windfall: their returns ran from +1.2% to -11.1%, averaging about -2.9%, closer to a soft landing than a profit. The 37 stop-losses (60.66% of all trades) outweigh both groups, which is why the average across all 61 trades is negative.
No, and we say so plainly: the Trio was selected using the same historical data this backtest measures it against, so the result is confirmatory rather than out-of-sample evidence. It answers a narrower question honestly — would this exact, fixed trading recipe have made money on the data it was built from — and even on that generous framing, in the tradeable universe, it did not.


