4.6 Points Cheaper, Not One Day Earlier: What the 5-Minute Cross Really Adds to Crash-Reversal Entries
Waiting for the reversal cross on 5-minute candles after a crash buys a clear price advantage — but almost no time advantage. Checked against 887 million candles from 4,336 US stocks, 2010 through early August 2026.
 Thomas Mücke
Founder & Publisher
Thomas Mücke
Founder & Publisher
Anyone who wants to buy a stock after a violent crash faces the same question as a seller during an advance: is the sluggish daily chart enough, or does a far finer 5-minute chart deliver the better entry? Our death-cross study on 5-minute candles painted a sobering picture for the sell side: faster, but not smarter. This study flips the assignment exactly around — buying instead of selling, reversal cross instead of death cross — and tests whether the picture repeats or reverses on the buy side.
The events are the same as in our daily reversal study: a crash of at least 20% followed by the daily entry E5, the first close above the 5-day moving average. On top of that, we searched for the first 5-minute reversal cross — a short moving average crossing from below to above a long moving average after the low. For this, we analyzed 887 million 5-minute candles from 4,336 US stocks, 2010 through early August 2026.
The result in four numbers
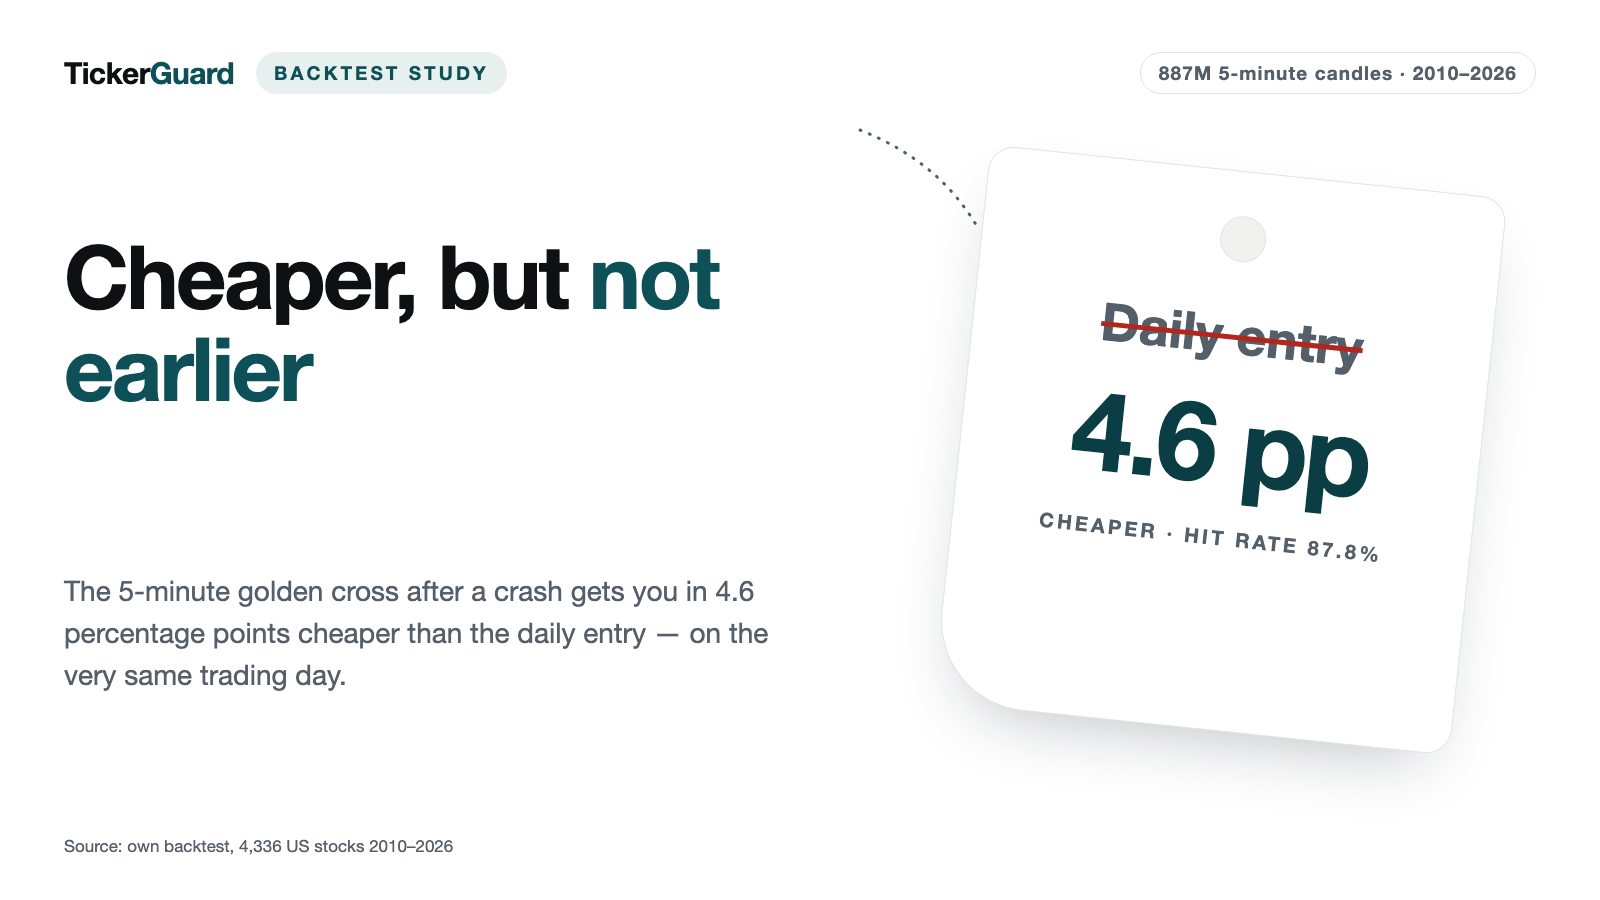
- +4.6 percentage points — how much cheaper the minute cross buys net against the daily entry (median; 87.8% hit rate).
- 0 trading days — the median time lead; only 40.7% of minute crosses come before the daily entry at all.
- +8.7% — the median net return per trade of the pre-registered recipe candidate R1 excluding the Covid year (only +1.9% on a robust basis).
- +1.4% instead of +8.9% — crashes with a single-day loss of 20% or more are unfit for re-entry (K5, excluding 2020).
One-sentence conclusion: The minute cross buys cheaper, not earlier — and only carries together with the daily filters.
What this study is about: the assignment flipped around
The death-cross 5m study found that a seller on minute candles could in theory have exited ten trading days earlier — but only by already knowing the later high. Followed in real time, the minute death cross brought ten false alarms per rally and an exit 25% below the high. The obvious question: does the same hold for the buy side after a crash, or does a reversal cross behave differently from a death cross?
This study's design is an exact mirror of the sister study — the same cross logic, the same three time scales (1x, 6x, 13x), the same universe tiers (BASE, MAIN, STRONG), pre-registered on August 10, 2026, before the results were in. Only the direction is flipped: instead of a death cross during an advance, we search for a reversal cross (a short moving average crossing from below to above the long one) after a crash, and all returns are computed long instead of short.
Data & pre-registered design
The universe covers 4,336 US stocks with usable 5-minute history (4,361 loaded), survivorship-free including delisted names, with a market capitalization of at least $300 million at any month-end in 2020. We analyzed 887 million 5-minute candles, aggregated from 3.13 billion 1-minute candles, across regular trading hours 9:30 a.m. to 3:55 p.m. New York time (78 candles on a regular trading day, 42 on an early-close day). The period runs from 2010 through early August 2026.
The signal is the 5-minute reversal cross: a short moving average (MA) crosses from below to above a long MA after a crash of at least 30% (high to low, adjusted 5-minute closes), the low sits before the cross, and the raw close at the low is at least $1. Three scales were computed: 1x (MA10/MA20), 6x (MA60/MA120) and 13x (MA130/MA260). Chapter A of this study — the standalone minute reversal — runs on the finest scale, 1x; the core chapter B — the comparison against the daily entry — runs on the mid scale, 6x (the pre-registered main scale). Three universe tiers filter the events: BASE (clean data hygiene), MAIN (BASE plus a median dollar volume of at least $1 million) and STRONG (MAIN plus a crash of at least 50% and a 120-day low).
| Scale | BASE (N) | MAIN (N) | STRONG (N) |
|---|---|---|---|
| 1× (MA10/20) | 5,725 | 2,690 | 317 |
| 6× (MA60/120) | 15,069 | 7,998 | 740 |
| 13× (MA130/260) | 23,100 | 13,726 | 1,373 |
Event counts for the stand-alone minute reversal (chapter A), excluding edge cases in the last 30 trading days. BASE = clean data hygiene, MAIN = BASE plus median dollar volume ≥ $ 1m, STRONG = MAIN plus a drawdown ≥ 50 % and a 120-day low. Source: price data, own calculations.
For the core chapter B the event set is fixed: 13,682 daily reversal events from the daily study (3,413 stocks), of which 11,609 were assessable within the 5-minute window, 6,231 events in the MAIN universe. A 5-minute reversal cross was actually found in 99.95% of these cases (6,228).
The core finding: cheaper, not earlier
The decisive question of this study: taking the same crash events as in the daily reversal study, and searching for the first 5-minute reversal cross after the known daily low instead of the daily entry E5 — how much earlier and how much cheaper do you buy?
MANDATORY CAVEAT: The search for the minute cross only starts after the daily low, which itself is only known in hindsight. This chapter is therefore a hindsight-conditioned timing measurement, not a tradable recipe. Premature crosses that would have occurred before the eventual low are not observable in this construction at all — the false-signal figure quoted further below is therefore a lower bound.
On the main scale, 6x (N 6,228), the time balance is sobering: the median time lead is 0 trading days. The minute cross comes before the daily entry E5 in only 40.7% of cases, on the same day in 28.3%, later in 30.9% — the search window deliberately runs past the E5 day. The minute entry brings almost no time.
The price picture looks different: buying at the 5-minute cross happens at a median 5.12% above the low, buying at the daily entry E5 only at 11.49% above it. The advantage: median +5.00 percentage points gross, or +4.60 percentage points net, robust average (winsorized mean, capping the most extreme 1% at each end) +10.8 percentage points, at an 87.8% hit rate (85.1% net). The middle half of cases falls between +1.6 and +12.2 percentage points of advantage.
| Scale | N | Lead median (trading days) | Ahead of the daily entry (%) | 5m buy above the low, median (%) | E5 buy above the low, median (%) | Price advantage gross median (pp) | Price advantage net median (pp) | Net hit rate (%) | False signal median (%) | K5 net E5 (%) | K5 net 5m (%) | K5 difference median (pp) |
|---|---|---|---|---|---|---|---|---|---|---|---|---|
| 1× (MA10/20) | 6,228 | 0 | 46.4 | +2.71 | +11.49 | +7.99 | +7.59 | 92.9 | 0.41 | +6.64 | +12.51 | +4.90 |
| 6× (MA60/120) | 6,228 | 0 | 40.7 | +5.12 | +11.49 | +5.00 | +4.60 | 85.1 | 0.41 | +6.64 | +12.05 | +3.00 |
| 13× (MA130/260) | 6,226 | 0 | 14.5 | +8.35 | +11.49 | +1.72 | +1.32 | 63.7 | 0.00 | +6.64 | +11.40 | +1.17 |
Same crash events as in the daily study, MAIN universe. E5 = daily entry (first close above the 5-day moving average). Price advantage = how much closer to the low the minute cross buys. False signal = drawdown after the minute entry until the end of the E5 day — a LOWER BOUND, because crosses that fire before the final low are not observable here. Net = after 0.4 % round-trip costs. pp = percentage points. The search starts after the daily low, which is only known in hindsight: a timing measurement, not a tradable recipe.
What an early entry costs when it fires too soon: the drawdown after the minute entry through the end of the E5 trading day sits at a median 0.41%, at the 90th percentile 4.5%, above 5 percentage points in only 8.4% of cases — larger than the price advantage itself in only 24.4% of cases. This too is a lower bound, as noted above. Carrying both entries through to the K5 exit (target +11% or trading day 12), the net return per trade rises from a median +6.64% (E5) to +12.05% (5-minute entry), a paired difference of median +3.00 percentage points, and the target rate rises from 44.0% to 73.4%.
Series-break hygiene (documented post hoc, as with the sister study): for 1,188 of the 4,336 stocks, the 5-minute series and the daily series sit on different adjustment levels at times. In the core chapter this affects 84 of 6,228 rows (1.4%) with a break day on the 5-minute cross day. Cleaned, the advantage sits at a median +5.03 percentage points gross, 88.5% hit rate, +4.20 percentage points excluding 2020 — the core message barely changes. That is a contrast to the death-cross sister study, where the same cleanup was mandatory because it shifted the result there noticeably.
| Scale | Rows | N | Price advantage median (pp) | Hit rate (%) |
|---|---|---|---|---|
| 1× (MA10/20) | all rows | 6,228 | +7.99 | 94.2 |
| 1× (MA10/20) | cleaned | 6,139 | +8.05 | 95.0 |
| 6× (MA60/120) | all rows | 6,228 | +5.00 | 87.8 |
| 6× (MA60/120) | cleaned | 6,144 | +5.03 | 88.5 |
| 13× (MA130/260) | all rows | 6,226 | +1.72 | 68.1 |
| 13× (MA130/260) | cleaned | 6,142 | +1.75 | 68.6 |
For some tickers the minute series and the daily series sit on different adjustment levels for a while. “Cleaned” drops those events where such a series break falls exactly on the day of the minute cross (6×: 84 of 6,228 rows, 1.4 %). The core message does not change. Price advantage gross. pp = percentage points.
The price advantage also holds practically unchanged excluding the Covid year: +4.18 percentage points (87.2% hit rate), excluding 2020 and 2021 +4.14 percentage points (87.1%) — the advantage is therefore Covid-independent, unlike the standalone minute buy in the next chapter.
| Sample | N | Price advantage median (pp) | Price advantage winsor. mean (pp) | Hit rate (%) | K5 difference median (pp) |
|---|---|---|---|---|---|
| Full sample | 6,228 | +5.00 | +10.78 | 87.8 | +3.00 |
| excl. 2020 | 4,411 | +4.18 | +9.63 | 87.2 | +2.82 |
| excl. 2020+2021 | 3,965 | +4.14 | +9.57 | 87.1 | +2.83 |
Main scale 6×, MAIN universe, split by the year of the minute cross. Price advantage gross (before costs); K5 difference = paired difference per event between the minute entry and the daily entry. Winsorized mean = robust average with the most extreme 1 % at each end capped. pp = percentage points. The price advantage holds virtually unchanged when the pandemic year is removed.
Is there a standalone minute reversal?
So far this has been about the minute cross as a complement to a known daily crash. The second question: does the 5-minute reversal cross also carry entirely without that daily context — searching directly on minute candles for a crash of at least 30% followed by a cross?
The pattern anatomy (MAIN universe) looks similar across all three scales: the median crash is 36.1% (1x), 35.7% (6x) or 35.8% (13x), and the cross follows a median 14 bars (roughly 70 minutes) after the low on the finest scale, 77 bars on the 6x scale, 160 bars on the 13x scale. The recovery from the low to the cross runs a median +6.7% (1x) up to +14.3% (13x). The full recovery from the low to the subsequent high sits at a median +43.1% (1x MAIN), of which the majority — a median 84.6% on the finest scale — happens only AFTER the cross. The reversal does therefore exist as a pattern.
As a buy signal the picture is more sober. Buying at the cross (1x MAIN, N 2,690): net median H5 −0.53% (49.8% hit rate), H20 +0.77% (51.8%), H60 +5.66% (56.8%). Against the S&P 500, H20 even delivers a negative excess return (−1.43 percentage points) — no edge over the market. A further problem: a new low below the entry price within 20 trading days occurs in 74.8% of cases (1x), 56.8% at 6x, 47.5% at 13x. The maximum drawdown within 20 trading days sits at a median −16.0% (1x) to −12.2% (13x).
| Scale | Horizon (trading days) | N | Net median (%) | Hit rate (%) | Excess return vs. S&P 500, median (pp) | Entry too early (%) | Max. drawdown within 20 trading days, median (%) |
|---|---|---|---|---|---|---|---|
| 1× (MA10/20) | 5 | 2,690 | −0.53 | 49.8 | −0.16 | 74.8 | −15.95 |
| 1× (MA10/20) | 20 | 2,690 | +0.77 | 51.8 | −1.43 | 74.8 | −15.95 |
| 1× (MA10/20) | 60 | 2,679 | +5.66 | 56.8 | +0.40 | 74.8 | −15.95 |
| 6× (MA60/120) | 5 | 7,998 | +1.58 | 55.6 | +1.01 | 56.8 | −13.63 |
| 6× (MA60/120) | 20 | 7,998 | +4.07 | 57.6 | −0.26 | 56.8 | −13.63 |
| 6× (MA60/120) | 60 | 7,958 | +14.39 | 63.6 | +4.41 | 56.8 | −13.63 |
| 13× (MA130/260) | 5 | 13,726 | +0.56 | 53.4 | −0.47 | 47.5 | −12.23 |
| 13× (MA130/260) | 20 | 13,726 | +3.11 | 56.8 | −1.92 | 47.5 | −12.23 |
| 13× (MA130/260) | 60 | 13,681 | +10.98 | 61.6 | +0.17 | 47.5 | −12.23 |
Buying at the 5-minute reversal cross, MAIN universe. Net = after 0.4 % round-trip costs. Hit rate = share of winners before costs. Excess return = stock minus S&P 500 over the same holding span; pp = percentage points. Entry too early = price falls below the entry price within 20 trading days. Drawdown and the too-early share depend on the scale only and therefore repeat for each horizon.
STRONG events (the fiercest crashes) come out substantially stronger: 6x STRONG (N 740) delivers net +39.2% after 60 trading days, excess return +27.0 percentage points — though at a small N and extreme dispersion, no robust recipe.
On the exit side a clear pattern emerges: every stop and trailing stop worsens the result. Example, 6x H20: no stop nets +4.07%, a 15% stop −6.54%, a 15% trailing stop −4.63%. A re-cross exit also comes out negative (6x: −1.68%, a 100% trigger rate). Only the K5 exit (target +11% or trading day 12) remains viable: net median +8.06% (1x), +10.85% (6x), +9.23% (13x); robust average +2.42 / +3.78 / +3.35%; hit rate 58.5 / 62.4 / 62.2%; target rate 49.0 / 52.3 / 49.2%.
| Scale | Exit | N | Net median (%) | Net winsor. mean (%) | Net hit rate (%) | Target / trigger rate (%) |
|---|---|---|---|---|---|---|
| 1× (MA10/20) | K5: target +11 % or trading day 12 | 2,690 | +8.06 | +2.42 | 58.5 | 49.0 |
| 6× (MA60/120) | K5: target +11 % or trading day 12 | 7,998 | +10.85 | +3.78 | 62.4 | 52.3 |
| 13× (MA130/260) | K5: target +11 % or trading day 12 | 13,726 | +9.23 | +3.35 | 62.2 | 49.2 |
| 6× (MA60/120) | hold 20 trading days, no stop | 7,998 | +4.07 | +7.74 | 56.9 | – |
| 6× (MA60/120) | hold 20 trading days, 15 % stop | 7,998 | −6.54 | +3.39 | 42.8 | 45.8 |
MAIN universe. Net = after 0.4 % round-trip costs. Winsorized mean = robust average with the most extreme 1 % at each end capped. Target rate = share of cases reaching the +11 % target; for the stop rows this column shows how often the stop was triggered. The last two rows show the same window with and without a stop — the stop makes things worse (shown for 6×; all scales behave alike).
Excluding Covid, the picture flips. 2020 accounts for 26.4% (1x), 38.6% (6x) or 33.8% (13x) of all standalone events. Removing 2020, the plain holding cells are negative throughout, on every scale: 1x H20 net −1.39% / H60 −2.31%, 6x −1.13 / −1.47%, 13x −1.31 / −1.32%, excess return H60 between −4.69 and −5.05 percentage points. K5 stays positive, but thin: net median +3.56% (1x), +3.10% (6x), +2.41% (13x); robust average only +0.85 to +1.21%. Excluding 2020 and 2021 the picture is similar (6x K5 +2.76%, H60 +1.60% median, excess return H60 −1.94 percentage points).
| Sample | Scale | N | H20 net median (%) | H60 net median (%) | H60 excess return median (pp) | K5 net median (%) | K5 net winsor. mean (%) |
|---|---|---|---|---|---|---|---|
| Full sample | 1× (MA10/20) | 2,690 | +0.77 | +5.66 | +0.40 | +8.06 | +2.42 |
| Full sample | 6× (MA60/120) | 7,998 | +4.07 | +14.39 | +4.41 | +10.85 | +3.78 |
| Full sample | 13× (MA130/260) | 13,726 | +3.11 | +10.98 | +0.17 | +9.23 | +3.35 |
| excl. 2020 | 1× (MA10/20) | 1,980 | −1.39 | −2.31 | −4.69 | +3.56 | +0.85 |
| excl. 2020 | 6× (MA60/120) | 4,909 | −1.13 | −1.47 | −4.95 | +3.10 | +1.21 |
| excl. 2020 | 13× (MA130/260) | 9,083 | −1.31 | −1.32 | −5.05 | +2.41 | +1.04 |
| excl. 2020+2021 | 1× (MA10/20) | 1,751 | −0.90 | −0.12 | −3.05 | +3.71 | +0.95 |
| excl. 2020+2021 | 6× (MA60/120) | 4,131 | −0.61 | +1.60 | −1.94 | +2.76 | +1.11 |
| excl. 2020+2021 | 13× (MA130/260) | 7,802 | −0.41 | +1.58 | −2.17 | +2.63 | +1.22 |
Buying at the minute cross, MAIN universe, split by the year of the cross. H20/H60 = fixed holding period of 20 resp. 60 trading days, K5 = target +11 % or trading day 12. Net = after 0.4 % round-trip costs. Winsorized mean = robust average with the most extreme 1 % at each end capped. pp = percentage points. Excluding the pandemic year 2020, the plain holding cells are negative throughout.
Honest reading: the broad pattern of the standalone minute reversal is overwhelmingly a Covid cohort. As a standalone buy signal without any daily context, the naked minute cross does not carry.
The single-day-plunge finding
A further filter suggests itself: does a crash that stretches across several trading days differ from one that happens on a single trading day — say, a sudden bad-news shock? For this we measured the largest single-session loss (adjusted daily close) within the crash window; a "single-day plunge" means a loss of at least 20% on a single trading day. 23,876 of 24,414 MAIN events across all scales were assessable; "stretched" means trading days, not weeks — the crash window sits at a median three to six trading days.
On the main scale, 6x, the K5 exit delivers a net +8.84% (60.9% hit rate) for single-day plunges in the full sample, versus +11.30% (64.4%) for stretched crashes — a gap that widens further excluding Covid: excluding 2020, only +1.39% (53.1%) for single-day plunges versus +8.88% (58.7%) for stretched crashes. On the 13x scale excluding 2020, the gap is similar (+0.32% versus +4.36%). Fixed holding periods (H20/H60) excluding 2020 sit between negative and zero for both groups.
| Scale | Sample | Group | N | K5 net median (%) | K5 net winsor. mean (%) | K5 hit rate (%) | H60 net median (%) |
|---|---|---|---|---|---|---|---|
| 6× (MA60/120) | Full sample | single-day plunge (≥ 20 % in one day) | 4,450 | +8.84 | +3.57 | 60.9 | +14.71 |
| 6× (MA60/120) | Full sample | stretched (below 20 % in one day) | 3,437 | +11.30 | +4.09 | 64.4 | +14.45 |
| 6× (MA60/120) | excl. 2020 | single-day plunge (≥ 20 % in one day) | 2,861 | +1.39 | +0.68 | 53.1 | +0.63 |
| 6× (MA60/120) | excl. 2020 | stretched (below 20 % in one day) | 1,978 | +8.88 | +1.93 | 58.7 | −5.06 |
| 13× (MA130/260) | Full sample | single-day plunge (≥ 20 % in one day) | 5,009 | +6.02 | +3.43 | 60.4 | +12.19 |
| 13× (MA130/260) | Full sample | stretched (below 20 % in one day) | 8,675 | +10.69 | +3.33 | 63.2 | +10.36 |
| 13× (MA130/260) | excl. 2020 | single-day plunge (≥ 20 % in one day) | 3,299 | +0.32 | +0.05 | 51.2 | −0.66 |
| 13× (MA130/260) | excl. 2020 | stretched (below 20 % in one day) | 5,751 | +4.36 | +1.63 | 57.2 | −1.79 |
MAIN universe, split by the largest single-day loss inside the crash window (measure A). “Stretched” means the crash spreads over several days — three to six trading days in the median, not weeks. Net = after 0.4 % round-trip costs. Winsorized mean = robust average with the most extreme 1 % at each end capped. Crashes containing a single-day loss of 20 % or more are unsuitable for re-entry.
The reason isn't hard to find: a crash of 20% or more on a single trading day is usually news-driven — a broken balance sheet, a collapsed takeover, a profit warning — not a technical sell-off that recovers quickly. This finding is stable across scales and time cuts.
Recipe candidate R1
The findings so far combine into a concrete recipe candidate, pre-registered before the full run: chapter A, scale 6x, MAIN universe, excluding events with an assessable single-session loss of at least 20% within the crash window; entry at the 5-minute reversal cross; exit K5 (target +11% or trading day 12); costs 0.4% round trip. Build-up: 7,998 MAIN events, minus 23 without an assessable measure, minus 4,451 single-day plunges = N 3,524.
IN-SAMPLE CAVEAT: R1 was derived from the very subset in which it was first measured; the combination of mid scale, K5 exit and single-day-plunge filter was chosen BECAUSE it survived the ex-Covid cuts there. The actual test was the full run with roughly 3,900 new tickers that had never seen the selection: there, R1 excluding 2020 remains jointly positive in median, robust average and market excess return — the pre-registered criterion is met, but at a clearly lower level than in-sample. This origin will not be renegotiated, redefined or hidden behind a replacement metric — it is stated openly.
"R1 is only considered viable if, excluding 2020, it stays positive on average — jointly in median, winsorized mean and market excess return. If any one of the three cells breaks down, the study will report exactly that and carry R1 as a failed candidate; it will not be renegotiated, redefined, or replaced with alternative parametrization."
That exact criterion is met in the full run.
| Variant | Sample | N | Net median (%) | Net winsor. mean (%) | Hit rate (%) | Target rate (%) | p25 / p75 (%) | Drawdown median (%) | S&P 500 median (%) | Excess return median (pp) | Excess return rate (%) |
|---|---|---|---|---|---|---|---|---|---|---|---|
| R1 | Full sample | 3,524 | +11.28 | +4.01 | 64.1 | 56.0 | −8.36 / +15.56 | −7.00 | +1.62 | +7.86 | 62.3 |
| R1 | excl. 2020 | 2,028 | +8.68 | +1.88 | 58.5 | 48.7 | −10.52 / +14.36 | −6.68 | +1.32 | +5.61 | 57.4 |
| R1 | excl. 2020+2021 | 1,558 | +6.32 | +1.34 | 57.0 | 46.4 | −10.70 / +13.76 | −7.20 | +1.20 | +4.00 | 56.0 |
| all 6× MAIN (reference) | excl. 2020 | 4,909 | +3.10 | +1.21 | 55.4 | 41.9 | −9.39 / +12.89 | −6.53 | +1.07 | +2.11 | 54.0 |
| single-day plunges only (reference) | excl. 2020 | 2,861 | +1.39 | +0.68 | 53.1 | 36.9 | −8.84 / +12.14 | −6.46 | +0.88 | +0.48 | 51.4 |
R1 = pre-registered recipe candidate: scale 6×, MAIN universe, excluding crashes with a single-day loss of 20 % or more, entry at the minute cross, exit K5 (target +11 % or trading day 12). Net = after 0.4 % round-trip costs. Winsorized mean = robust average with the most extreme 1 % at each end capped. p25 / p75 = one in four events is worse than the first value, one in four better than the second. Drawdown = largest paper loss during the holding period. S&P 500 over the same holding span, recipe net against index gross — a conservative comparison. pp = percentage points. The last two rows show that the filter does the work, not the choice of period.
The pre-registered criterion is met: excluding 2020, median (+8.68%), robust average (+1.88%) and market excess return (+5.61 percentage points) are jointly positive. But honestly: clearly weaker than measured in-sample (median 11.99 → 8.68%; robust average 4.99 → 1.88%; excess return 10.48 → 5.61 percentage points). Across the interim runs the effect visibly weakens as more new tickers are added: 454 tickers +12.0% median → 1,186 +10.7% → 2,365 +8.5% → 2,914 +8.0% → full sample +8.7%.
The quasi-holdout — only tickers loaded after the recipe was chosen, which never saw the selection (N 3,320 of 3,524; 204 in-sample tickers) — confirms this: excluding 2020, median +7.41%, robust average +1.70%, hit rate 57.8%, excess return +4.96 percentage points. R1 therefore holds up on fresh tickers too, at this level. As a check: the in-sample tickers deliver +11.99% — exactly the original amendment figure.
| Group | Sample | N | Net median (%) | Net winsor. mean (%) | Hit rate (%) | Excess return median (pp) |
|---|---|---|---|---|---|---|
| In-sample tickers | Full sample | 204 | +12.61 | +6.84 | 74.5 | +10.51 |
| In-sample tickers | excl. 2020 | 118 | +11.99 | +4.99 | 69.5 | +10.48 |
| Holdout (new tickers) | Full sample | 3,320 | +11.17 | +3.83 | 63.5 | +7.50 |
| Holdout (new tickers) | excl. 2020 | 1,910 | +7.41 | +1.70 | 57.8 | +4.96 |
Quasi-holdout: the “holdout” group contains only tickers loaded after the recipe was chosen, so the selection never saw them. Net = after 0.4 % round-trip costs. Winsorized mean = robust average with the most extreme 1 % at each end capped. R1 holds up on fresh tickers as well — but at a clearly lower level than where the recipe was found.
Across the years, 13 of 17 cross years are positive; 2020 alone accounts for 42% of events (1,496 of 3,524) — single-year medians are an illustration, not standalone evidence.
| Year of the cross | N | Net median (%) | Hit rate (%) |
|---|---|---|---|
| 2010 | 17 | −0.17 | 47.1 |
| 2011 | 47 | +10.84 | 59.6 |
| 2012 | 19 | −4.54 | 47.4 |
| 2013 | 23 | +3.33 | 56.5 |
| 2014 | 45 | +0.77 | 53.3 |
| 2015 | 77 | +1.38 | 58.4 |
| 2016 | 92 | +10.91 | 67.4 |
| 2017 | 32 | +0.56 | 50.0 |
| 2018 | 88 | +3.44 | 55.7 |
| 2019 | 80 | −0.15 | 48.8 |
| 2020 | 1,496 | +12.80 | 71.8 |
| 2021 | 470 | +11.24 | 63.4 |
| 2022 | 288 | +12.25 | 68.8 |
| 2023 | 157 | −0.77 | 47.8 |
| 2024 | 204 | +3.31 | 53.9 |
| 2025 | 300 | +4.58 | 53.7 |
| 2026 | 89 | +6.56 | 57.3 |
R1, full sample, broken down by the year of the minute cross. Net = after 0.4 % round-trip costs. 13 out of 17 years are positive. 2020 alone accounts for 1,496 of the 3,524 events — single-year medians are an illustration, not standalone evidence. 2026 runs to early August.
R1 is cost-robust too: multiplicative costs of 0.2% per side deliver excluding 2020 +8.65%, 0.4% +8.21%, 0.5% +8.00% median (against the additive base convention of +8.68%) — the finding barely changes.
| Sample | N | Base: 0.4 % additive (%) | 0.2 % per side (%) | 0.4 % per side (%) | 0.5 % per side (%) |
|---|---|---|---|---|---|
| Full sample | 3,524 | +11.28 | +11.23 | +10.79 | +10.56 |
| excl. 2020 | 2,028 | +8.68 | +8.65 | +8.21 | +8.00 |
| excl. 2020+2021 | 1,558 | +6.32 | +6.29 | +5.87 | +5.66 |
R1, median per trade. All values net. “Additive” is the study's base convention (a flat 0.4 % round-trip deduction); the other columns apply costs multiplicatively on both sides. The result barely changes — the recipe is cost-robust.
A mini-sweep around K5 forms a plateau, not a ridge — no alternative recipe choice is derived from the sweep.
R1b (core chapter with the same filter, entry at the minute cross instead of E5): of 6,228 events, 1,004 single-day plunges are excluded, leaving N 5,224. Net median full sample +11.95%, excluding 2020 +11.52% (robust average +10.15%, hit rate 89.7%, excess return +9.39 percentage points). Two mandatory caveats: first, the filter barely bites in the core chapter (excluding 2020: +11.52% filtered versus +11.49% unfiltered) — the single-day plunge is a finding of the standalone minute reversal, not of the core chapter. Second, these figures too are hindsight-conditioned, because the search starts from a low only known afterwards — a timing measurement, not a tradable recipe.
| Variant | Sample | N | Net median (%) | Net winsor. mean (%) | Hit rate (%) | Target rate (%) | Excess return median (pp) |
|---|---|---|---|---|---|---|---|
| R1b | Full sample | 5,224 | +11.95 | +10.95 | 91.0 | 72.3 | +9.45 |
| R1b | excl. 2020 | 3,970 | +11.52 | +10.15 | 89.7 | 67.2 | +9.39 |
| R1b | excl. 2020+2021 | 3,563 | +11.53 | +10.28 | 90.2 | 67.4 | +9.30 |
| all 6× core chapter (reference) | excl. 2020 | 4,411 | +11.49 | +10.08 | 89.6 | 66.5 | +9.39 |
R1b = the same single-day-plunge filter, applied to the core-chapter events (entry at the minute cross instead of the daily entry). Net = after 0.4 % round-trip costs. Winsorized mean = robust average with the most extreme 1 % at each end capped. Two mandatory caveats: the filter barely bites here — the unfiltered reference row is practically level; the single-day plunge is a finding of the stand-alone minute reversal. And these figures are hindsight-conditioned (the search starts from a low only known afterwards), so they are a timing measurement, not a tradable recipe.
Comparison against the daily reversal study
Our daily reversal study showed that the daily entry E5 with a K5 exit was the only parabola recipe to beat the index (net blended median +6.39%, excess return against the S&P 500 at a robust average of +1.87 percentage points). This study answers the question on the same events, now on a minute basis:
- Time: barely — a median 0 trading days earlier, and only in 40.7% of cases even ahead of E5 at all.
- Price: yes — entry at a median 5.12% instead of 11.49% above the low, net +4.60 percentage points; K5 per trade rises from +6.64% (E5) to +12.05% net (minute entry), a paired difference of median +3.00 percentage points, target rate 44 → 73%.
- The K5 recipe holds up on the finer scale too: chapter A 6x K5 delivers +10.85% net for the full sample, +3.10% excluding 2020; with the single-day-plunge filter (R1) +8.68%.
- But: the core-chapter figures are hindsight-conditioned (see above). The honestly tradable path on a minute basis is chapter A / R1 — and that is weaker than the hindsight-conditioned timing measurement of the core chapter.
Comparison against the death-cross 5m sister study
The death-cross study on 5-minute candles arrived at "faster, not smarter": in hindsight a sale 7.4 percentage points better ten trading days before the daily death cross — but ex ante ten false alarms per advance, and the first cross after the low sold 25% below the high (14.7 percentage points worse than the daily exit, only a 9.7% hit rate). This study's long side is therefore not simply the mirror image:
- Time gained: ten trading days in the sister study, against the sluggish daily death cross; here 0 trading days — because the daily entry E5 (the first close above MA5) already reacts quickly.
- Instead: a price advantage of +5 percentage points that holds even without Covid.
- Ex ante: catastrophic in the sister study (a hail of false alarms during the advance), moderate here — the reversal cross only fires AFTER the crash, the low and the start of the recovery, at a point when everything relevant is already known and lookahead-free. Wrong entries cost a bounded amount (median drawdown −6.7% in R1), whereas false alarms in the death cross cost the entire rally. The reason for this asymmetry: after a 30% crash the remaining downside is small, and K5 caps the holding time; during an advance, by contrast, the missed continuation of the rally is expensive.
- Shared lesson of both studies: minute candles do not replace the daily filters — the naked 1x cross excluding 2020 stays negative on holding — they refine them, through the price advantage and the R1 filter.
Limitations of this study
- Closing / session prices, no intraday execution. Spreads and slippage beyond the flat 0.4% are not included, especially relevant for smaller stocks (small caps!). Reinvestment is assumed.
- A 2020 cluster. Event overlap is possible (the same stock repeatedly); the hindsight caveats of the core chapter and of R1b apply without exception.
- R1 has an in-sample origin. The pre-registered criterion is met, but the selection was made in the very subset in which it was first measured (see caveat above). STRONG cells are also small.
- The false-signal figure in the core chapter is a lower bound — premature crosses before the eventual low are not observable in this construction.
- No scanner, no trading recommendation, no investment advice. This study is published regardless of a negative finding — that is the series principle.
A worked example: SITC, August 5, 2026
How the pattern feels in practice shows up in a single event from the verification sample: SITC (6x scale). The stock crashed 34.0% from high to low on August 4, 2026 at 9:45 a.m. New York time. The 5-minute reversal cross followed on August 5, 2026 at 11:05 a.m. New York time. Between the low and the cross sat a good trading day and roughly ninety additional minutes — roughly the order of magnitude that also holds at the median of this study for the 6x scale (77 bars, about 6.4 trading hours). We deliberately do not quote specific price levels here, because they fall outside this study's verification sample and were not cross-checked — what matters is the sequence: crash, low, and only then the signal that triggers the buy.
How we ran the numbers
The dataset consists of 5-minute price series for 4,336 US stocks with usable minute history (4,361 loaded), survivorship-free including delisted names, with a market capitalization of at least $300 million at any month-end in 2020. The period runs from 2010 through early August 2026; we analyzed roughly 887 million 5-minute candles, aggregated from 3.13 billion 1-minute candles. Only regular trading hours count, 9:30 a.m. to 3:55 p.m. New York time — 78 candles on a regular trading day, 42 on an early-close day, adjusted using daily adjustment factors.
The design was pre-registered on August 10, 2026, before the results were in — an exact mirror of the death-cross 5m sister study's design, with a bit-identical mirror proof. Amendments are documented (docs/parabel-umkehr-5m-studie-design.md), including the series-break hygiene and the single-day-plunge filter for R1, both added post hoc but stated openly as a deviation from the original design.
Chapter A computes strictly within one series, using only 5-minute closes; only the STRONG classification (120-day low) touches a break day for 61 of 2,430 STRONG events (2.5%) — immaterial for the core findings. All returns are computed long; net means gross minus 0.4% round-trip costs; winsorized mean is a robust average in which the most extreme 1% at each end is capped, so individual outliers don't distort the picture.
Source: price data (1-/5-minute and daily closing prices), own calculations. Figures as of August 22, 2026. Design pre-registered on August 10, 2026, addenda documented.
This article is a historical analysis of publicly available price data and not investment advice. It contains no buy or sell recommendation and no forecast for any individual company trading today. Past results — whether simulated or real — are not a reliable indicator of future returns. Anyone making investment decisions should assess their own situation and risks, if in doubt with professional advice.
Frequently Asked Questions
On price yes, on time barely. Waiting for the first 5-minute reversal cross instead of the daily entry E5 buys at a median 5.12% above the low instead of 11.49% — an advantage of 5.00 percentage points gross, or 4.60 percentage points net, at an 87.8% hit rate. It barely produces a time lead: the minute cross comes before the daily entry at all in only 40.7% of cases, at a median lead of 0 trading days.
Because the daily entry E5 (the first close above the 5-day moving average) already reacts quickly on its own. Unlike the sluggish daily death cross in the sister study, there is barely any time to gain here — only a better price, because the minute resolution buys closer to the low.
Little, at the median: the largest drawdown after the minute entry through the end of the E5 trading day sits at a median 0.41%, above 5 percentage points in only 8.4% of cases. That figure is a lower bound, though, because crosses that fire before the eventual low are not observable in this construction at all — the search only starts after the daily low, which itself is only known in hindsight.
Barely. Searching for the pattern directly on minute candles, without waiting for a known daily crash, leaves the plain holding cells negative throughout excluding the Covid year 2020 (6x: −1.13% after 20 and −1.47% after 60 trading days). 2020 accounts for between 26 and 39 percent of all events depending on scale — without that cluster, the naked cross does not carry as a standalone buy signal.
R1 combines the mid time scale with a time-capped exit (target +11% or trading day 12) and excludes crashes with a single-day loss of 20% or more. Excluding the Covid year, median (+8.68%), robust average (+1.88%) and market excess return (+5.61 percentage points) remain jointly positive — the pre-registered criterion is met. Honestly: R1 was found in exactly the subset in which it was first measured, and on the full dataset it sits clearly below the level originally measured (+11.99% in-sample).
Based on these figures, better not. Every tested stop and trailing-stop variant worsens the result against simple holding. Re-cross exits also deliver a negative result at a 100% trigger rate. Only the K5 exit with a fixed target and a time cap stays positive across all scales.
No, the two sides are not mirror images. For the death cross (the sell side during an advance), the minute resolution brings ten trading days of lead, but at the cost of ten false alarms per rally and a catastrophic ex-ante result. For the reversal cross (the buy side after a crash), it brings barely any time, but a moderate and robust price advantage, because the signal only fires after the crash, the low and the start of the recovery — everything relevant is already known at that point.


