The Signal Holds, the Recipe Doesn't: 22 Years of Backtesting the Velez Open Trade
We rebuilt Oliver Velez's famous opening setup — the first 2-minute candle after the US open — exactly as he describes it, and ran it across 22 years and ten large-cap US stocks. The result has two halves: the first candle carries real information, but the complete recipe does not make money after realistic costs.
 Thomas Mücke
Founder & Publisher
Thomas Mücke
Founder & Publisher
Oliver Velez is one of the best-known names in American day trading. In “Tools and Tactics for the Master Day Trader,” written with Greg Capra, he describes a setup countless traders still replicate today: reading the first candle after the US open as a compass for the rest of the day. We wanted to know whether that compass actually points anywhere useful — and whether it can genuinely be turned into money over two decades. So we rebuilt the setup exactly as Velez describes it, without any interpretation of our own, and ran it against 22 years of minute-level data and a random baseline.
The result comes in two halves, and both matter. The first candle carries real information — all eight exit variants and 13 of the 16 sensitivities beat random chance. The complete recipe Velez himself describes still loses money after realistic costs. How both of those can be true at once is what this study is really about.
The result in four numbers
Did Velez's first candle actually carry information, and could that be turned into money over 22 years? Four numbers carry the answer:
- -0.021% per trade net is what Velez's own exit system — our main rule — lost across 5,895 trades and 22 years.
- -0.031% per trade is where the random baseline landed: all eight exit variants and 13 of the 16 sensitivities beat it, so the first candle carried genuine information.
- +0.019% per trade is what the main rule earned gross, before costs — smaller than the 0.04 percentage points a single round trip costs. That is where the recipe failed.
- -0.037% per trade is what the one idea that looked positive in 2025 (gap-fade, +0.117% in the screening) returned once tested across the full history — the study's most important stress test.
Across the 2004-2026 test window, Velez's first candle demonstrably carried information without that information turning into a profitable trading recipe after costs.
The setup: Velez's first candle
The core idea is simple to describe. In the first few minutes after the US market opens at 9:30 a.m. New York time, a stock often carves out an initial trading range. When price subsequently breaks above its high or below its low, that break is read as a signal for the day's direction. Velez's complete system goes well beyond the entry itself: he sells half the position once it reaches a gain equal to the initial risk (1R), moves the stop on the remaining half to breakeven, and then trails that stop candle by candle in the direction of the trade.
We mechanized these rules as literally as we could, so the test actually measures Velez's recipe rather than a friendlier version of our own making:
- Universe and period: AAPL, MSFT, NVDA, AMZN, META, GOOGL, TSLA, AMD, NFLX, JPM; every available trading day from 2004-01-02 through 2026-08-06.
- Signal: the first 2-minute candle from 9:30:00 to 9:31:59 a.m. New York time, built from the 1-minute candles of the regular session.
- Direction filter: long only on a green signal candle closing above the prior day's close; short only on a red candle closing below it. The prior close is converted onto the raw-price basis of the current day in a split-safe way.
- Size filter: the signal candle's range (high minus low, which also sets the stop distance) may be at most 0.4% of the candle's close — our own addition, because a huge first candle means a huge risk on every trade.
- Entry: a stop order 1 cent beyond the signal candle in the filtered direction, with a window running until 9:50 a.m. New York time. If price never breaks the level by then, the day is skipped.
- Stop: 1 cent beyond the opposite side of the signal candle.
- Exit (Velez's system): close half the position at +1R, move the remaining stop to breakeven, then trail the full open position bar by bar on a 2-minute basis, flat at the close at the latest — no overnight holds.
- Costs: 0.04 percentage points per round trip (0.02% per side), deducted from every return.
As in the rest of our backtest series, our yardstick is a random baseline: same day, same stock, entry at market price at 9:32 with a random rather than signal-driven direction, identical exit system. Only the gap to this baseline shows whether the first candle really carries information, or whether it just measures a general morning drift that a coin flip would have caught equally well. That principle is written into our own decision protocol for this study:
“Only the gap to the baseline shows whether the first candle carries information, or whether it merely measures a morning drift.”
— from our own decision and methodology protocol for this backtest.
How we tested it
We ran every one of 50,274 checked stock-days individually — ten tickers across 5,684 shared trading days. The size filter turns out to be the steepest hurdle by far: on 72.3% of all days, the first candle is larger than the 0.4% we allow, and the day is dropped entirely. On a further 12.2% of days, the candle color doesn't match the prior close. That leaves 5,895 actual trades from 11.7% of all days — plus another 3.0% of days where the candle qualified but price never broke out by 9:50.
That alone is a finding worth sitting with: Velez's setup, in our risk-bounded form, is rarely playable. Quiet, small opening candles with a clear direction are the exception, not the rule.
The result: eight exits, one picture
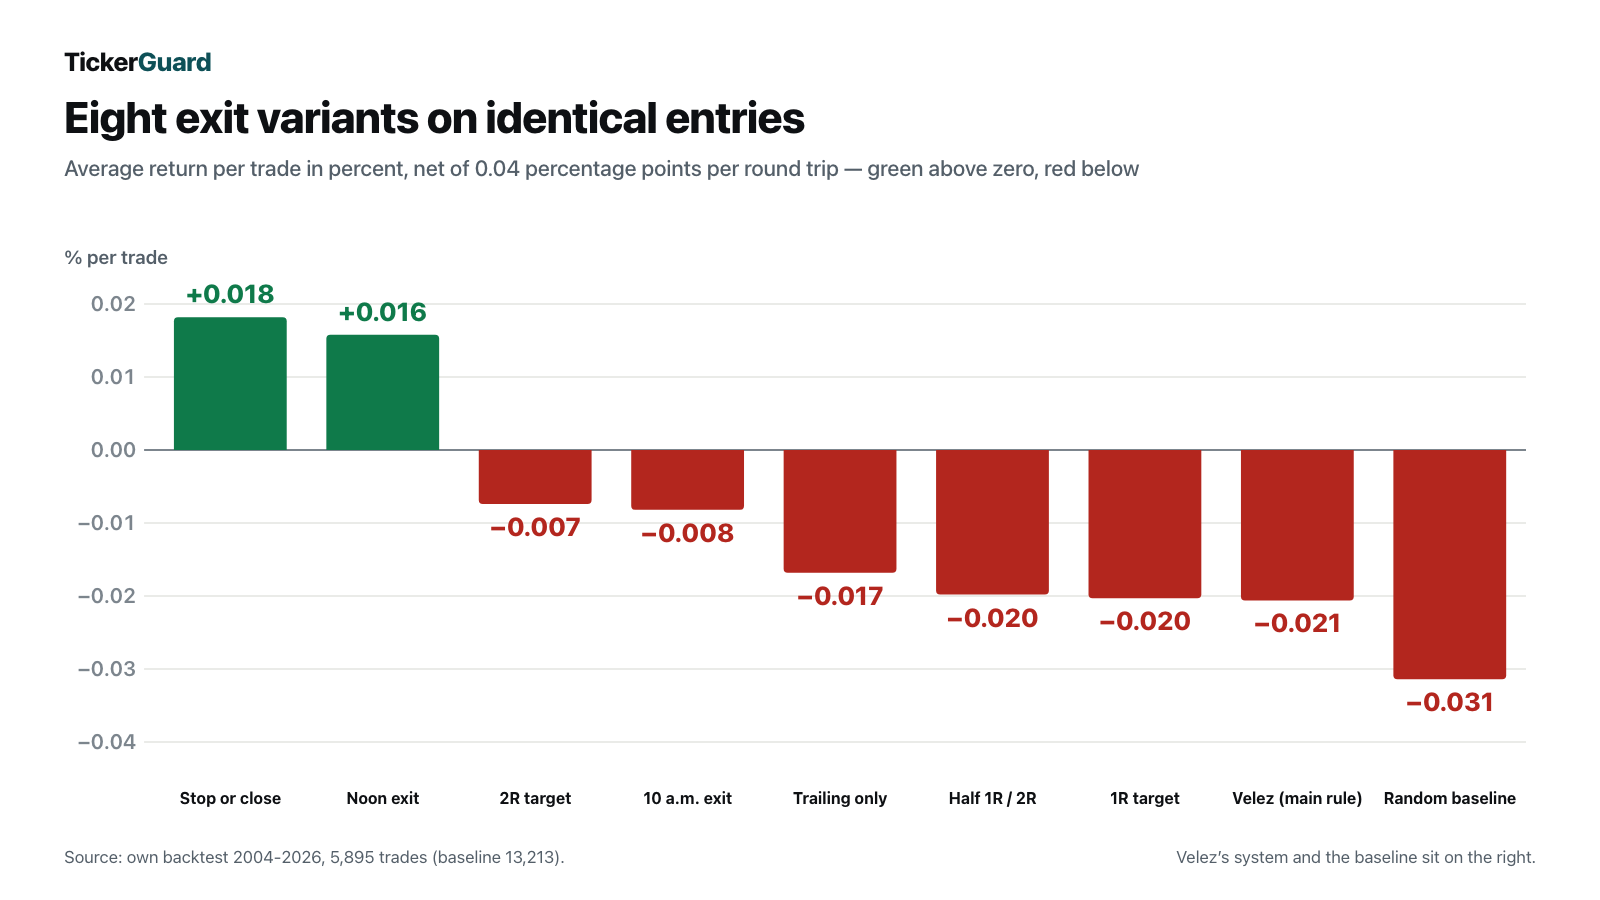
Because the entry is identical across every variant, we could compare eight different exit rules on the exact same 5,895 trades — Velez's own system among them, several fixed profit-target and time exits, and the simplest rule of all: hold the stop, otherwise ride the position to the close.
| Exit variant | Trades | Avg. net per trade | Hit rate | Profit factor | Sum |
|---|---|---|---|---|---|
| Stop or close (stop only, otherwise exit at close) | 5,895 | +0.018% | 26.5% | 1.07 | +107.3 |
| Noon exit (flat at 12:00) | 5,895 | +0.016% | 32.0% | 1.07 | +93.3 |
| Full position at 2R target | 5,895 | -0.007% | 37.8% | 0.97 | -43.4 |
| 10 a.m. exit | 5,895 | -0.008% | 40.0% | 0.96 | -48.6 |
| Trailing only, no partial exit | 5,895 | -0.017% | 44.0% | 0.88 | -99.1 |
| Half at 1R, rest at 2R target | 5,895 | -0.020% | 53.5% | 0.88 | -116.6 |
| Full position at 1R target | 5,895 | -0.020% | 53.5% | 0.88 | -119.6 |
| Velez (main rule, Velez's full system) | 5,895 | -0.021% | 48.8% | 0.85 | -121.2 |
| Random baseline | 13,213 | -0.031% | 39.4% | 0.68 | -415.1 |
Velez's own complete system lands at -0.021% per trade — near the back of the pack, beaten by all seven alternatives, ahead only of the random baseline. The simplest exit of all, “hold the stop, otherwise ride to the close,” comes out on top at +0.018%, closely followed by the noon exit at +0.016%. Both are barely positive — but that is the best of eight comparisons run on identical trades, not independent confirmation of an edge. With eight comparisons on the same data, one is statistically almost guaranteed to come out ahead even if no real difference exists.
What actually decides the sign is costs. Before costs, the main rule sits at +0.019% per trade, genuinely positive. After deducting the 0.04 percentage points a round trip costs, it flips to -0.021%. The gross edge is smaller than the price of a single buy-and-sell cycle — a recipe that only works with no trading costs does not, in the end, work.
Do the rules hold up when you turn the knobs?
Testing a single main rule is only the start. We ran 16 sensitivity variants, each changing exactly one knob relative to the main rule — the direction filter, a trend filter, the length of the signal candle, the entry window, the exit, an add-on entry, the size filter, and costs. Each row stands on its own; they are not meant to be read in combination. The three size-filter steps get their own table in the next section, which is why the one below lists 13 rows.
| Sensitivity | Trades | Avg. net per trade | Δ vs. main rule | Hit rate | Profit factor |
|---|---|---|---|---|---|
| OCO instead of direction filter (both sides live) | 13,270 | -0.003% | +0.018 | 51.5% | 0.98 |
| Trade only in gap direction | 4,789 | -0.025% | -0.004 | 48.2% | 0.82 |
| Daily trend filter, 200-day MA | 3,241 | -0.013% | +0.008 | 49.5% | 0.90 |
| Daily trend filter, 20-day MA | 3,016 | -0.021% | -0.001 | 48.2% | 0.84 |
| Color only (no prior-close check) | 10,461 | -0.017% | +0.003 | 48.9% | 0.87 |
| Entry window to 10:30 | 6,320 | -0.021% | -0.000 | 48.7% | 0.84 |
| 1-minute signal candle | 9,666 | -0.033% | -0.012 | 47.2% | 0.75 |
| 5-minute signal candle | 2,275 | -0.019% | +0.002 | 49.0% | 0.87 |
| Trail on 20-period MA instead of prior candle | 5,895 | -0.018% | +0.003 | 51.9% | 0.89 |
| Simple 9:50 time exit | 5,895 | -0.014% | +0.007 | 41.2% | 0.92 |
| One add-on at the 20-period MA | 5,895 | -0.020% | +0.001 | 48.9% | 0.85 |
| Zero costs | 5,895 | +0.019% | +0.040 | 54.2% | 1.17 |
| Costs at 0.05% per side (0.10 per round trip) | 5,895 | -0.081% | -0.060 | 41.8% | 0.52 |
Of the 14 sensitivities that actually change a rule (the two cost rows are a cost assumption, not a rule), 8 beat the main rule — but not one clears zero. The strongest single change is OCO instead of the direction filter at -0.003% per trade, still negative. Measured against the random baseline (-0.031%), the picture looks friendlier: 13 of the 16 sensitivities beat chance. That is the real message in this table — not which single row wins, but that nearly every version of this setup carries more information than a coin flip at the same time of day. None of them turns that into profit.
The size filter: smaller is better
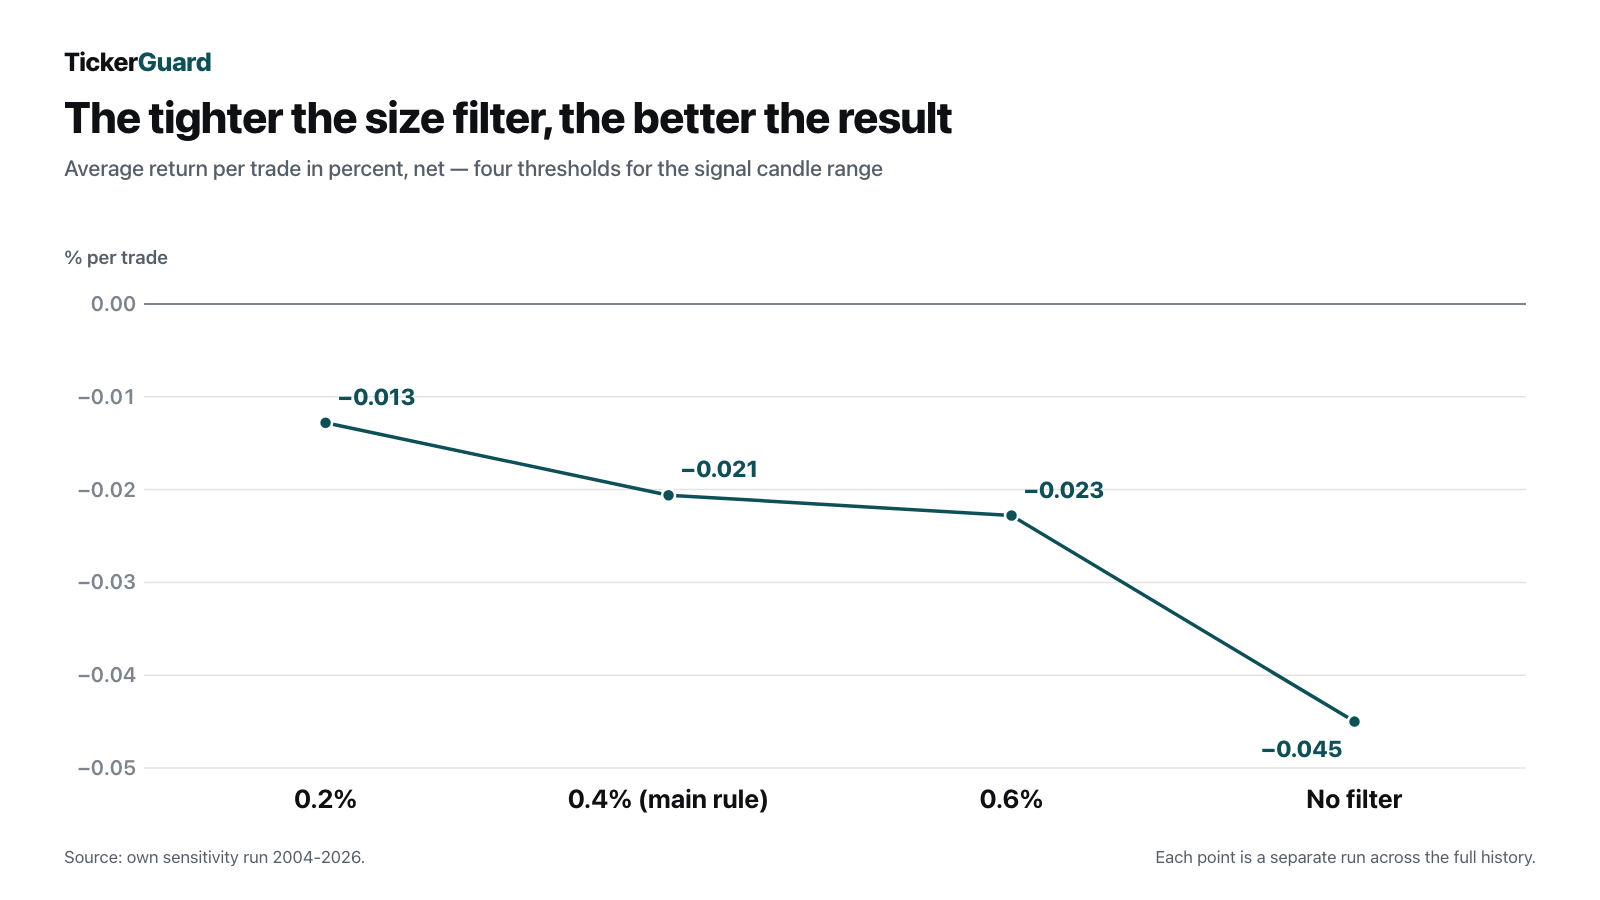
One knob deserves its own look, because it produces a clean, unbroken pattern: the size-filter threshold itself.
| Size-filter threshold | Trades | Avg. net per trade | Hit rate | Profit factor |
|---|---|---|---|---|
| 0.2% (tighter than the main rule) | 711 | -0.013% | 50.6% | 0.87 |
| 0.4% (our main rule) | 5,895 | -0.021% | 48.8% | 0.85 |
| 0.6% (looser than the main rule) | 11,870 | -0.023% | 49.4% | 0.86 |
| No size filter at all | 23,214 | -0.045% | 50.6% | 0.82 |
The pattern is monotonic, without a single exception: the tighter the filter, the less negative the result. Small, quiet opening candles carry more information; large, agitated opening candles dilute the edge until it hits -0.045% per trade with no filter at all — more than twice as negative as our main rule. The filter is not just risk control; it is itself a quality signal. It is also the setup's steepest single hurdle: as shown above, 72.3% of all stock-days already fail our 0.4% threshold, and at 0.2% the pool of tradable days would shrink much further still.
Our own idea: gap-fade, and its hardness test
Beyond a pure replication, we also freely screened 2025 for other intraday approaches — pure exploration, no fixed rule attached. We tested a 15-minute opening-range breakout, momentum on the large first candles our size filter throws out, a reversal on small candles, last-hour momentum, a first-hour reversal, and gap-fade: trading against an opening gap on the assumption it partially closes.
Of six ideas examined, exactly one was clearly positive in 2025 alone:
| Idea (2025 screening) | Trades | Avg. net per trade | Hit rate | Profit factor |
|---|---|---|---|---|
| Gap-fade | 789 | +0.117% | 52.0% | 1.17 |
| 15-minute opening-range breakout | 2,293 | -0.014% | 43.9% | 0.98 |
| Last-hour momentum | 2,465 | -0.034% | 45.5% | 0.86 |
| First-hour reversal | 1,549 | -0.033% | 42.5% | 0.94 |
| Momentum on large first candles | 1,677 | -0.049% | 52.2% | 0.88 |
| Reversal on small candles | 196 | -0.121% | 23.0% | 0.58 |
Gap-fade looked genuinely promising — until we ran the actual hardness test: the identical rule across the full 2004-2026 history, 13,661 trades instead of 789. The result flips entirely: -0.037% per trade, a 0.951 profit factor, a 50.3% hit rate. The year-by-year figures show why: 2025, at +0.12% per trade, was simply one of the good years in a series that swings wildly between +0.27% (2008) and -0.24% (2020) and averages out slightly negative.
| Gap-fade | Period | Trades | Avg. net per trade | Profit factor |
|---|---|---|---|---|
| Screening (2025 only) | 2025 | 789 | +0.117% | 1.17 |
| Hardness test (full history) | 2004-2026 | 13,661 | -0.037% | 0.951 |
This is a textbook overfitting story: an idea born on a short, favorably-drawn sample that disappears under a longer test. We show it here deliberately, instead of quietly dropping it, because a one-year screen is a hint, not a result — and this hardness test is the proof of exactly why that rule holds throughout our own backtest series.
What survives this study
Two statements stand at the end, and both are true. First: Velez's first candle carries real information. All eight exit variants and 13 of the 16 sensitivities beat the random baseline, usually by a wide margin — that is not a pure morning drift, but a measurable pattern. Second: over 22 years, that pattern never becomes a profitable, cost-adjusted recipe, not even with Velez's own comparatively elaborate exit system. The gross edge of 0.019% per trade is smaller than the 0.04 percentage points a round trip costs, and none of the 14 rule changes flips that sign. The best rule change still stays negative, the best exit variant is one winner among eight comparisons on the same trades, and the only idea from our free exploration that showed an edge fails its own hardness test across the full history.
We reached a related conclusion in our Qullamaggie backtest study and in our surge-signal portfolio backtest: a signal that reliably beats chance is only half the job. The other half is a recipe that still holds up after real trading costs, and that is exactly the part that doesn't survive here.
Method and measurement limits
Several assumptions shape this result and belong openly in the writeup:
- Ten survivors. The universe consists of ten large stocks that still exist today — not a survivorship-free sample. That mainly lifts the long side: long trades average -0.010% per trade against -0.035% for short (main rule), and the random baseline shows the same gap (-0.026% long versus -0.037% short).
- Unadjusted raw prices. The minute-level data from the US exchanges is not adjusted for splits or dividends. Within a single day that is correct — triggers and stops sit on the prices that actually traded at the time. Only the prior close is converted in a split-safe way, so the direction filter does not flip on split days.
- Short trading days end at 12:59. On abbreviated trading days, the data can carry rough, thinly-traded phantom prints after the close; we cap those sessions on a data-driven basis, and all 46 detected short days match the official NYSE calendar exactly.
- Data gaps. Two tickers are missing stretches of data: NVDA for 31 trading days (mid-2024), TSLA for 208 consecutive trading days (July 2023 through May 2024) plus three further single days. During those windows, the affected stock is simply absent from the backtest.
- Eight exit variants, 16 sensitivities — the same data. That many comparisons on the same trades means the top performer in each set is partly selection luck. What is meaningful is the spread and the sign, not which single row comes out ahead.
- Costs as a flat assumption. 0.04 percentage points per round trip (0.02% per side) is a realistic but flat assumption for liquid large caps — not a measurement of actual spreads, which can run wider in early years and in the frantic first minutes of trading.
This review evaluates a published trading setup, not the person behind it. We mechanized Velez's rules as literally as we could and held them to an impartial yardstick — random chance and real trading costs. The full run history behind this study, alongside our other backtests, sits together in Studies.
Figures as of 8 August 2026.
This article is a historical analysis and not investment advice. It contains no buy or sell recommendation, no price target, and no forecast about any individual, currently listed company. Anyone making investment decisions should assess their own situation and risks, if in doubt with professional advice.
Frequently Asked Questions
Oliver Velez, known for the day-trading classic “Tools and Tactics for the Master Day Trader,” uses the first few minutes after the US open as a directional signal. When price breaks above or below that opening range, he enters in the breakout direction and manages the position with a multi-stage system of partial profit-taking, a breakeven stop, and trailing.
The signal is the first 2-minute candle from 9:30 to 9:32 a.m. New York time. We go long only on a green candle closing above the prior close, short only on a red candle closing below it. Entry is 1 cent beyond the candle until 9:50, the stop sits 1 cent beyond the opposite side, and the exit follows Velez's own system: half off at 1R, the rest trailed bar by bar, flat by the close at the latest.
Yes. Against a random baseline with the identical exit, same stock, same day, but a random instead of signal-driven direction, all eight exit variants and 13 of the 16 sensitivities beat chance (-0.031% per trade), usually by a wide margin. Only three sensitivities fall below it: the 1-minute signal candle, dropping the size filter, and costs at 2.5 times the main rule (0.10 instead of 0.04 percentage points per round trip). That is the key difference from a pure morning drift, which a coin flip would have caught equally well.
Because the real edge is razor-thin. Before costs, the main rule sits at +0.019% per trade — smaller than the 0.04 percentage points a single round trip (buy and sell) costs. A genuine but tiny signal gets eaten by realistic trading costs before it ever reaches a portfolio.
“Hold the stop, otherwise exit at the close” (no partial profit-taking, no trailing) came out on top at +0.018% per trade, just ahead of a flat noon exit at +0.016%. Both are simply the best of eight comparisons on identical entries — with that many comparisons, one always wins even without a real edge. Velez's own full system landed near the bottom at -0.021%.
The tighter the first candle, the better the result — consistently, without a single exception: a 0.2% range threshold nets -0.013%, 0.4% -0.021%, 0.6% -0.023%, and no filter at all -0.045% per trade. Small, quiet opening candles carry more information. The filter is also the setup's steepest hurdle: 72.3% of all stock-days already fail our 0.4% threshold.
In our 2025-only screening, fading the opening gap looked promising at +0.117% per trade. Run across the full 2004-2026 history — the actual hardness test — the result flips to -0.037% per trade. A textbook case of overfitting to too short a sample.
No. We mechanized his published setup as faithfully as we could and tested it against an impartial yardstick — random chance and real trading costs. That is a test of the rules, not a judgment of the person. His observation carries measurable information; the complete, cost-adjusted trading rule built on it does not reliably make money over 22 years.


