The Signal Hits, the Portfolio Loses: 16 Years of Surge-Signal Backtesting
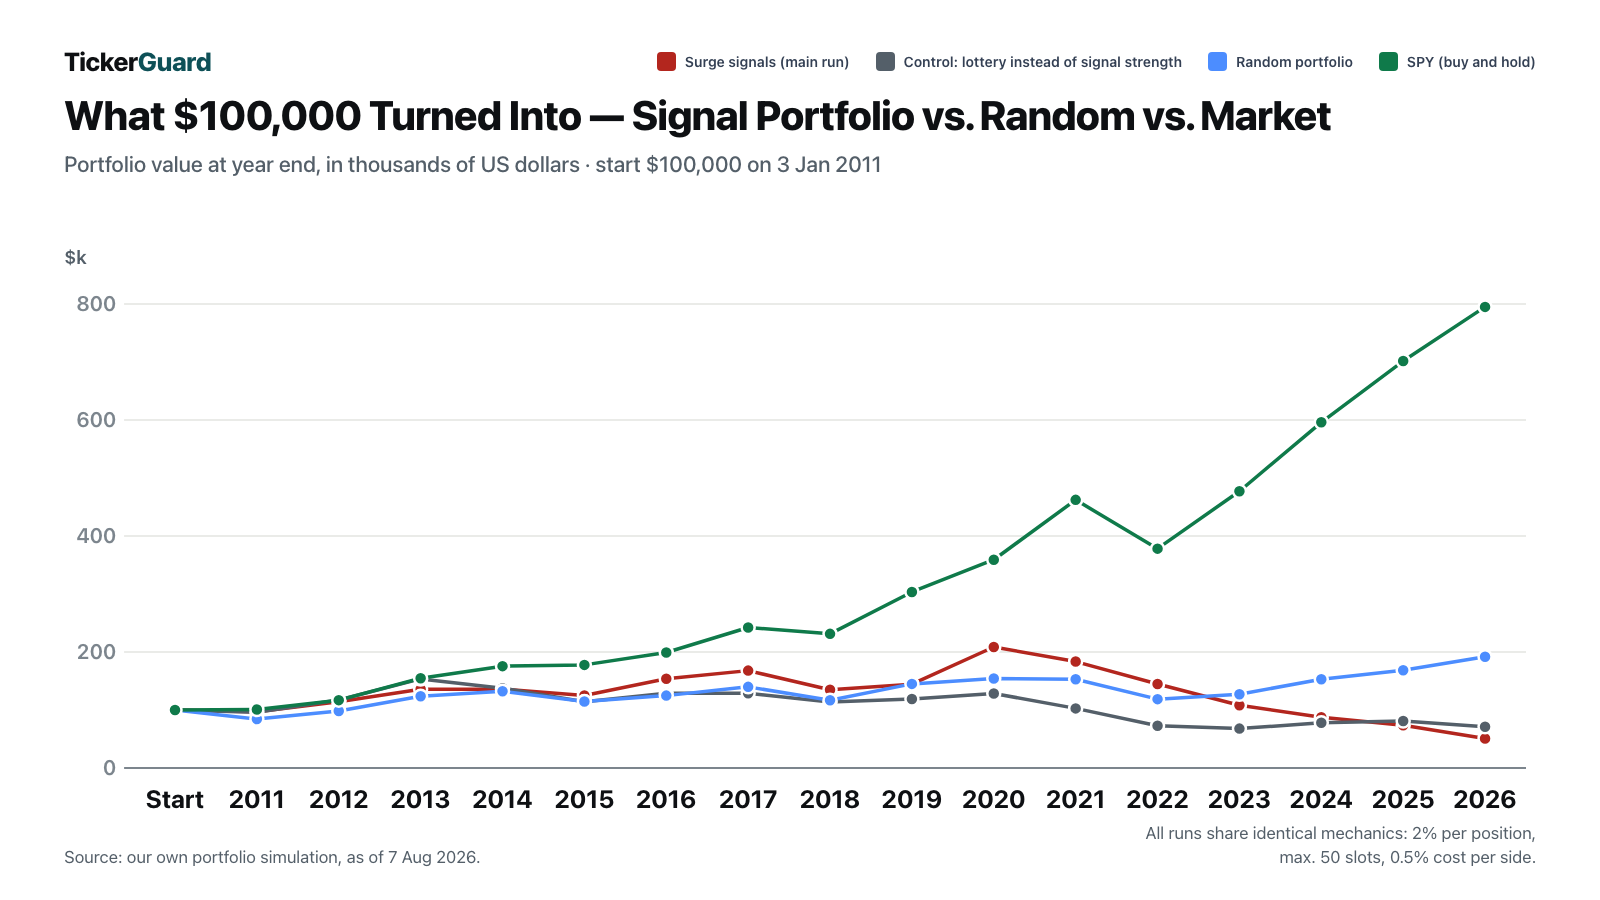
Our signal backtest proved that our surge patterns find genuine doubler candidates: 7.1 percent against 4.4 percent for random picks, and it held in all sixteen years we tested. The obvious question was whether that makes a profitable portfolio. We simulated it — $100,000, 2011 through 2026, fixed rules, full costs. The result was $51,023, while a random portfolio running the identical mechanic reached $191,938 and simply holding SPY reached $794,976. Why both are true at once — more doublers and still a loss — is the real finding of this study.
 Thomas Mücke
Founder & Publisher
Thomas Mücke
Founder & Publisher
Our own signal backtest found something real. Stocks that print a sharp volume surge or a positive catalyst hit a doubling of price at roughly 1.6 times the rate of a randomly matched comparison stock — 7.1% against 4.4% — and that edge held in every one of the sixteen years we tested. The obvious next question is whether that edge can be turned into a portfolio. We built one, ran it from 2011 through 2026 with a fully disclosed mechanic, and the answer surprised us.
The result in four numbers
Can the signal's edge be turned into a portfolio that outperforms the market itself? We ran the numbers with $100,000 starting capital, mechanically, over a full 15 years. Four numbers carry the result:
- 7.1% of signal stocks doubled, against 4.4% for the random comparison — and that edge held in all sixteen years we tested. The signal held up.
- $51,023 is what remained of the original $100,000 at the end of the main run — a loss of -48.98% overall, or -4.23% per year.
- $191,938 is what a random portfolio running the identical mechanic reached over the same period, and $794,976 is what simply holding SPY reached.
- -0.46% was the main run's average trade, against +1.53% for the random portfolio — more doublers and, at the same time, the worse average.
In the tested window, the signal held up in the hit statistics, while the portfolio rule built on it lost against both a simple random portfolio and the held market.
The signal we started with
The underlying scan flags two kinds of setups: a sudden volume surge and a positive news catalyst. Across 358,079 signals, measured against a randomly drawn comparison ticker for each one, the signal stocks reached a doubling (at least +100%) 7.1% of the time, against 4.4% for the random comparison. They also cleared +50% more often (16.6% versus 10.8%) and +25% more often (34.0% versus 24.8%). The advantage in doublers held in all sixteen years of the sample, not just in a favorable stretch.
The scan is survivorship-free: 22,872 US tickers went into the sample, and 16,472 of them are delisted today. A signal backtest built only on companies that still trade would quietly erase every failure and flatter the doubler rate for no honest reason.
We have made a version of this argument before. Our Qullamaggie backtest study found a well-defined momentum setup with a real, measurable edge per trade, while a second setup under the same rules barely broke even. A signal proving its worth on paper is a first step, not a conclusion.
The question this study asks
A signal that beats chance per trade does not automatically make a good portfolio. Position sizing, capacity limits, and which signal wins when several compete for the same slot can all change the outcome. So we simulated an actual account: $100,000 starting capital, running from 3 January 2011 to 6 August 2026, 3,921 trading days.
Each position was sized at 2% of portfolio value, at most 50 positions open at once, and capped at 1% of a stock's dollar volume on the purchase day so no single trade could move a thin, illiquid name. We bought at the closing price of the day after the signal, never at the signal day's own close, since nobody can trade at a price they only learn once it is final. Positions closed on a 62-trading-day time exit, a -30% stop on closing prices, or an exit signal of their own, with 0.5% slippage on each side of every trade. On average, the portfolio sat 98.23% invested.
The result: a real edge, a losing portfolio
The main run — buying every volume-surge and catalyst signal under those rules — turned $100,000 into $51,023. That is a total loss of -48.98%, or -4.23% per year, with a maximum drawdown of 80.95% and annual volatility of 15.61%. Across 3,658 trades, 41.93% were winners, for a profit factor of 0.94, an average trade of -0.46%, and a median trade of -0.90%.
A random portfolio, built and traded under the identical mechanic but buying names with no edge at all, closed at $191,938 — a gain of +91.94%, or +4.28% per year, on a smaller 47.78% maximum drawdown. Simply buying and holding the S&P 500 ETF SPY over the same period turned $100,000 into $794,976, a gain of +694.98%, or +14.26% per year.
| Run | Ending capital | Total | Per year | Max drawdown | Volatility | Trades | Hit rate |
|---|---|---|---|---|---|---|---|
| Main run: volume + catalyst | 51,023 $ | -48.98 % | -4.23 % | 80.95 % | 15.61 % | 3,658 | 41.93 % |
| Control: lottery instead of signal strength | 71,171 $ | -28.83 % | -2.16 % | 66.83 % | 21.21 % | 3,574 | 44.75 % |
| Random portfolio (identical mechanics) | 191,938 $ | +91.94 % | +4.28 % | 47.78 % | 19.93 % | 3,385 | 50.76 % |
| SPY (buy and hold) | 794,976 $ | +694.98 % | +14.26 % | 33.72 % | 17.06 % | 1 | — |
A portfolio built entirely on a signal that reliably out-predicts chance finished behind a portfolio built on no signal at all, and both finished far behind simply owning the market. That is the finding worth sitting with before anything else in this study.
Why both are true at once
This is the part that actually explains what happened, and it does not require any statistics background to follow. The signal stocks produced more doublers than random stocks, and at the same time a worse average outcome per trade. More lottery tickets, and a worse expected payout per ticket. Both statements are true, and neither cancels the other.
The evidence sits side by side in our own numbers. The main run's average trade came in at -0.46%, against +1.53% for the random portfolio traded under the identical rules — a nearly two-point gap on every single trade, repeated across thousands of trades. And in the underlying signal backtest, the median low point reached during the holding window was -14.8% for signal stocks against -9.8% for random ones. Signal stocks fall harder on the way to sometimes doubling.
Picture two envelopes. One holds mostly small losses with an occasional huge win; the other holds smaller, steadier gains and losses. The first envelope can produce more headline doublers and still pay out less on average, because the extra volatility that creates the big winners also creates deeper, more frequent losers on the way there. A signal that correctly flags where outsized moves happen is not the same thing as a signal that flags where the expected value of buying is positive. A signal is not a system.
Capacity: most of the edge could never be captured
There is a second, independent reason the portfolio underperformed, and it has nothing to do with which stocks the signal picked. Of the roughly 333,000 signals this simulation had to choose from, 314,937 were crowded out in the main run — no free portfolio slot, or no cash — leaving only 3,658 that were actually traded. That is roughly 1 in 91 signals.
The crowding was not spread evenly. On 13 March 2020 alone, 1,937 signals competed for the portfolio's 50 available slots. Other flood days piled up in the same stretch: 17 March 2020 (1,279 crowded out), 10 March 2020 (987), 12 March 2020 (895), and 17 June 2022 (891). Beyond crowding, another 4,023 signals were blocked because the stock was already held, 10,168 were discarded for failing a tradability check, 165 for data errors, 16 for a stock split, and 6 simply expired unfilled.
This matters for how to read the signal backtest's headline doubler rate. That figure is measured against every one of the 358,079 signals, but a real $100,000 account, following the exact same rules, could only ever have traded 3,658 of them. The signal backtest's hit rate is mostly measuring trades that could never have happened inside any capital-limited portfolio — a capacity problem entirely separate from whether the signal itself is any good.
Three portfolios, one selection rule
The main run does not just buy signals; on a crowded day it also has to choose which of them to buy, and it ranks candidates by signal strength, buying the most extreme cases first. We reran the exact same simulation with one change: replace that ranking with a coin-flip lottery among the day's signals, everything else held identical.
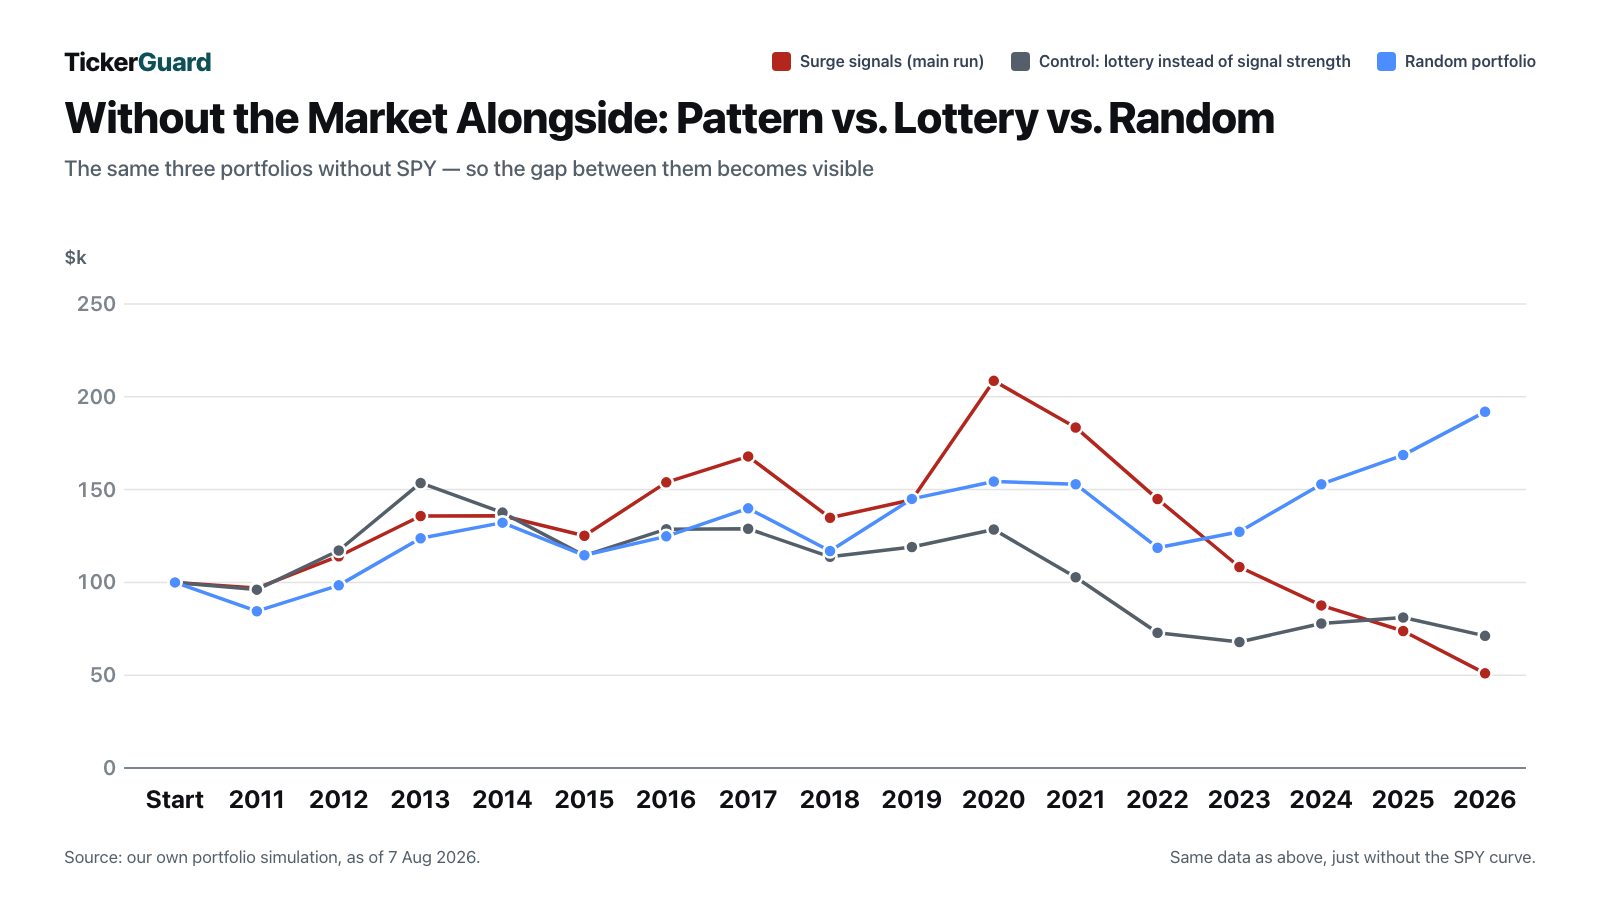
The lottery-selection control closed at $71,171, a total loss of -28.83%, or -2.16% per year, on a 66.83% maximum drawdown, with a hit rate of 44.75% across 3,574 trades. The lottery control's profit factor came in at 0.96, its average trade at -0.13%, and its median trade at -1.22%.
Switching from strength-ranking to a lottery lifted the ending balance from $51,023 to $71,171 — the preference for the most extreme signals on a crowded day costs the strategy roughly 20 percentage points. But the gap between that improved, lottery-based control and the random portfolio's $191,938 is still 121 percentage points — six times as large. The selection rule measurably hurts, but it is not the main reason the strategy loses money.
A data-quality problem we found, and how we fixed it
Honesty about a study includes admitting where the first version of it was wrong. Our first computation of this backtest produced three numbers that are not mathematically possible under a 2%-per-position sizing rule: a +279.53% return for calendar year 2013, a 95.27% maximum drawdown, and 267.52% annual volatility.
The forensic review found neither a calculation error nor a stock-split error. It found that our price-data vendor, for a number of delisted US tickers, mixes in the prices of a same-named ticker from an entirely different exchange into the same data series, alternating day by day. We confirmed the pattern on eight tickers; three examples show the scale: ATX carried Costa Inc at $22.09 alongside the Vienna stock index near 2,471.19; KER carried a US-listed stock near $50 alongside Kering, the Paris-listed luxury group, near €350; EMIS carried Emisphere Technologies at $6.78 alongside EMIS Group of London at 984 pence.
We measured the damage directly: 41 positions built on this data error contributed +$309,901 in phantom gains, while the remaining 3,568 legitimate trades together lost -$310,586. The entire positive result of that first, uncorrected run consisted of prices nobody could ever have traded at. Our calculation logic itself was not at fault — an independent recheck in SQL matched the flawed run to three decimal places — the input prices were simply wrong.
We now run two safeguards before a trade is ever opened, not after the fact. First, an unexplained daily price move of more than +100% or less than -50% during a position's holding window, with no documented adjusted split behind it, discards the signal outright. Second, a trading day with zero volume carries no price anyone could actually have dealt at, so every sale, stop trigger, and mark-to-market valuation uses the most recent price that came with real volume behind it.
After this cleanup, the main run's ending capital fell from $83,472 to the $51,023 reported throughout this study, its maximum drawdown fell from 95.27% to 80.95%, and its volatility fell from 267.52% to 15.61% per year. No single calendar year in the corrected results shows a return above +54%, and every one of the fourteen run variants behind this study now shows zero jump-suspect positions.
Fourteen variants, one destination
We reran the mechanic with individual rules changed one at a time, to see whether some other combination would have closed the gap to the random portfolio. None of them did.
| Variant | Ending capital | Total | Per year | Max drawdown | Trades | Hit rate | Profit factor |
|---|---|---|---|---|---|---|---|
| Main run: volume + catalyst | 51,023 $ | -48.98 % | -4.23 % | 80.95 % | 3,658 | 41.93 % | 0.94 |
| Volume pattern only | 28,326 $ | -71.67 % | -7.79 % | 86.29 % | 3,659 | 41.45 % | 0.89 |
| Catalyst pattern only | 29,215 $ | -70.78 % | -7.61 % | 84.44 % | 3,822 | 41.68 % | 0.91 |
| All four patterns | 55,651 $ | -44.35 % | -3.70 % | 80.54 % | 3,659 | 42.01 % | 0.95 |
| Random portfolio (identical mechanics) | 191,938 $ | +91.94 % | +4.28 % | 47.78 % | 3,385 | 50.76 % | 1.13 |
| No stop, no exit signal | 54,762 $ | -45.24 % | -3.80 % | 77.98 % | 3,230 | 42.92 % | 0.95 |
| No stop | 41,088 $ | -58.91 % | -5.56 % | 79.28 % | 3,247 | 42.10 % | 0.92 |
| Stop at -20%, no exit signal | 65,382 $ | -34.62 % | -2.69 % | 75.03 % | 4,044 | 39.32 % | 0.96 |
| Stop at -20% | 64,761 $ | -35.24 % | -2.75 % | 76.74 % | 4,045 | 39.50 % | 0.96 |
| Stop at -30%, no exit signal | 46,905 $ | -53.10 % | -4.75 % | 82.58 % | 3,645 | 41.56 % | 0.94 |
| Main run without trading costs | 84,275 $ | -15.73 % | -1.09 % | 78.30 % | 3,635 | 50.49 % | 0.99 |
| Random portfolio without trading costs | 321,048 $ | +221.05 % | +7.79 % | 42.39 % | 3,385 | 53.07 % | 1.23 |
| Main run, delisting = total loss | 765 $ | -99.23 % | -26.89 % | 99.35 % | 3,653 | 39.44 % | 0.68 |
| Control: lottery instead of signal strength | 71,171 $ | -28.83 % | -2.16 % | 66.83 % | 3,574 | 44.75 % | 0.96 |
Year by year
The annual returns show when the picture tips over: good and bad years alternate through 2020, and every single year from 2021 onward is negative.
| Run | 2011 | 2012 | 2013 | 2014 | 2015 | 2016 | 2017 | 2018 | 2019 | 2020 | 2021 | 2022 | 2023 | 2024 | 2025 | 2026 |
|---|---|---|---|---|---|---|---|---|---|---|---|---|---|---|---|---|
| Main run: volume + catalyst | -3.1 % | +17.8 % | +19.0 % | +0.1 % | -7.9 % | +22.9 % | +9.1 % | -19.7 % | +7.2 % | +44.4 % | -12.0 % | -21.1 % | -25.3 % | -19.1 % | -15.7 % | -30.9 % |
| Control: lottery instead of signal strength | -3.9 % | +21.9 % | +31.1 % | -10.4 % | -16.9 % | +12.5 % | +0.1 % | -11.7 % | +4.6 % | +8.0 % | -20.0 % | -29.1 % | -6.8 % | +14.6 % | +4.1 % | -12.2 % |
| Random portfolio (identical mechanics) | -15.5 % | +16.5 % | +25.8 % | +6.9 % | -13.4 % | +9.0 % | +12.1 % | -16.4 % | +24.0 % | +6.5 % | -1.0 % | -22.3 % | +7.2 % | +20.1 % | +10.3 % | +13.8 % |
| SPY (buy and hold) | +0.9 % | +16.0 % | +32.3 % | +13.5 % | +1.2 % | +12.0 % | +21.7 % | -4.6 % | +31.2 % | +18.3 % | +28.7 % | -18.2 % | +26.2 % | +24.9 % | +17.7 % | +13.3 % |
Stripping out trading costs entirely on the main run — an unrealistic best case, since real slippage cannot simply be waived — still only lifts the result to $84,275 (hit rate 50.49%, profit factor 0.99), which is still below the $100,000 starting balance. Treating every delisting as a total wipeout, the harshest realistic assumption, collapses the main run to $765. Across every signal-driven variant we tested, not one comes anywhere near the random portfolio's $191,938. The best version of the signal-based recipe, stripped of all costs, does not even reach breakeven.
What survives this study
Not everything about the signal fails. One pattern in our data stands out as the strongest single finding across the entire series: a dilution filing that follows a doubling in price. We tracked 2,136 such cases and found a median outcome at the end of the holding window of -21.1%, against +0.3% for the matched random comparison, with a median low point of -34.8% against -10.1%. That is a genuinely useful warning signal — a reliable marker for when to stop holding a position, not for when to open one.
More broadly, the signals in this study earn their place as a watchlist, not as an autopilot. They reliably identify where above-average price movement is likely to occur; our own 7.1%-versus-4.4% doubler statistic proves that much. What they do not tell a trader is whether the expected value of actually buying the trade is positive. Measured across a full, costed, capacity-limited portfolio, it is not. We reached a related conclusion in our bankruptcy trio short-selling backtest: a real, statistically valid warning signal does not automatically survive the trip into a fixed, mechanical trading recipe.
Method and measurement limits
We buy at the close of the trading day after a signal, never at the signal day's own close — a rule explained in our own calculation report:
"A signal arises from that day's closing price; nobody who only learns that price once it is final can still trade at it. We therefore buy at the close of the next trading day. Whatever happens between the two closing prices flows into the result unfiltered, in both directions."
— From the methodology box of our calculation report.
Stops are measured on closing prices only, since our data has no intraday highs or lows. That cuts both ways: a day that dips under the stop level and recovers by the close never triggers a stop here, which is friendlier than reality, while a day that closes only partway down sells at the full closing loss rather than at the stop level itself, which is harsher than reality.
Trading costs are a flat assumption, not a measurement: 0.5% slippage on each side, deliberately set high. Broker order fees are not included on top; at a roughly $2,000 position size, that could add another 0% to 0.5%, depending on the broker. Sale proceeds are assumed available the same day, a generous assumption against real settlement timing. Splits were checked wherever documented — 6,862 documented split days across 16,607 tickers queried.
Positions at the edge of our data are censored rather than force-closed: if a price series ends within 10 calendar days of the most recent trading day, it is treated as still open — valued, but not sold — and hit rate, profit factor, and median use only fully closed positions. This backtest also inherits every measurement limit of the underlying signal generation: no news filter and no cooldown on the volume pattern, no tradability check on the catalyst pattern, corporate events knowable roughly eight weeks earlier than our data reflects, and incomplete insider-trading data for the most recent quarter. These figures are a model calculation, not a bank statement.
The full run history behind this study, including all fourteen variants and the underlying signal backtest, sits alongside our other work in Studies.
Figures as of 7 August 2026.
This article is a historical analysis of a model portfolio and not investment advice. It contains no buy or sell recommendation, no price target, and no forecast about any individual company. Simulated results, like real trading results, are not a reliable indicator of future returns. Anyone making investment decisions should assess their own situation and risks, if in doubt with professional advice.
Frequently Asked Questions
We put our surge signals into a fully disclosed portfolio and ran it from January 2011 to August 2026: $100,000 starting capital, 2 percent per position, at most 50 positions, buying at the next day's close, a 62-trading-day time exit, a stop at minus 30 percent, and 0.5 percent costs on each side.
The main run ended at $51,023, a loss of 48.98 percent or 4.23 percent per year. A random portfolio running the identical mechanic reached $191,938, and simply holding SPY reached $794,976. The signals beat chance in the hit statistics; the trading rule built on them does not beat chance in a portfolio.
Because two different things are being measured. Signal stocks deliver more extreme winners but a worse average: minus 0.46 percent per trade against plus 1.53 percent for random picks. They are more lottery tickets, not better ones. Across thousands of trades, expectancy decides the outcome, not the best possible case.
Because a portfolio with 50 slots and limited capital cannot absorb every signal. 314,937 signals were crowded out and another 4,023 were blocked because the stock was already held. On 13 March 2020 alone, 1,937 signals were crowded out. The signal backtest's hit rate therefore mostly measures trades that could never have happened.
Only in small part. Replacing the ranking by signal strength with a lottery lifts the result from $51,023 to $71,171, so the selection rule costs roughly 20 percentage points. The gap that remains to the random portfolio is 121 percentage points — six times as large.
The first computation showed a 279.53 percent return for 2013, which is impossible at 2 percent position sizing. Our price-data vendor mixes prices of same-named tickers from other exchanges into the same series for some delisted US symbols. 41 such positions contributed $309,901 while the remaining 3,568 trades lost $310,586. After the cleanup, the loss remained.
Two things. First, the exit pattern as a warning signal: a dilution filing after a doubling produced a median of minus 21.1 percent across 2,136 cases, against plus 0.3 percent for random comparisons. Second, the signals as a watchlist rather than an autopilot — they show where movement happens, not whether buying pays off on average.


