Episodic Pivots: An AI Blind-Read 1,499 SEC Filings — And Was Most Wrong When Most Confident
A price gap after an SEC filing looks like the clearest trading signal there is: something obviously just happened. We wanted to know whether the CONTENT of the filing actually improves the trade — so we had an AI read 1,499 filings completely BLIND, with no price and no outcome, only the text. Across 2,843 trades since 1984, the result is unusually clear: whether the AI judged a filing as bullish barely moved the actual outcome — and the more confident the AI was, the weaker the trade actually performed. What mattered was not the content of the news, but simply THAT quarterly numbers came out at all.
 Thomas Mücke
Founder & Publisher
Thomas Mücke
Founder & Publisher
A price gap after an SEC filing is arguably the clearest signal the market gives: news lands overnight, and the next morning there is a gap in the chart. The obvious assumption is that the CONTENT of the filing decides the outcome — good news, good trade. This study tests that directly, with a purpose-built experiment: an AI read 1,499 SEC filings completely BLIND, with no knowledge of the price or the outcome, and had to judge from the text alone whether the stock should rise afterward. Across 2,843 trades since 1984, the result is unusually clear — and shows that the CONTENT judgment adds almost nothing to the trade.
The result in four numbers
When a stock gaps, does WHAT the SEC filing said matter — or only THAT one came out at all? This study tested that with a purpose-built blind-reading experiment. Four numbers carry the result:
- +4.30% was the average return for trades an AI judged "should rise" while reading the filing blind — with no knowledge of the price or outcome (1,067 trades) — against +4.02% for every other judged case (412 trades). The content of the filing barely moved the result.
- +3.44% was the return at the AI's highest confidence level (481 trades) — against +6.64% at low confidence (212 trades) and +4.09% at medium confidence (374 trades). The more certain the AI was, the weaker the trade actually turned out.
- +4.84% at a 55.2% hit rate is what gaps tied to earnings returned (1,153 trades) — gaps without earnings managed only +3.74% at a 43.4% hit rate (869 trades). THAT numbers came out apparently mattered more than WHAT they said.
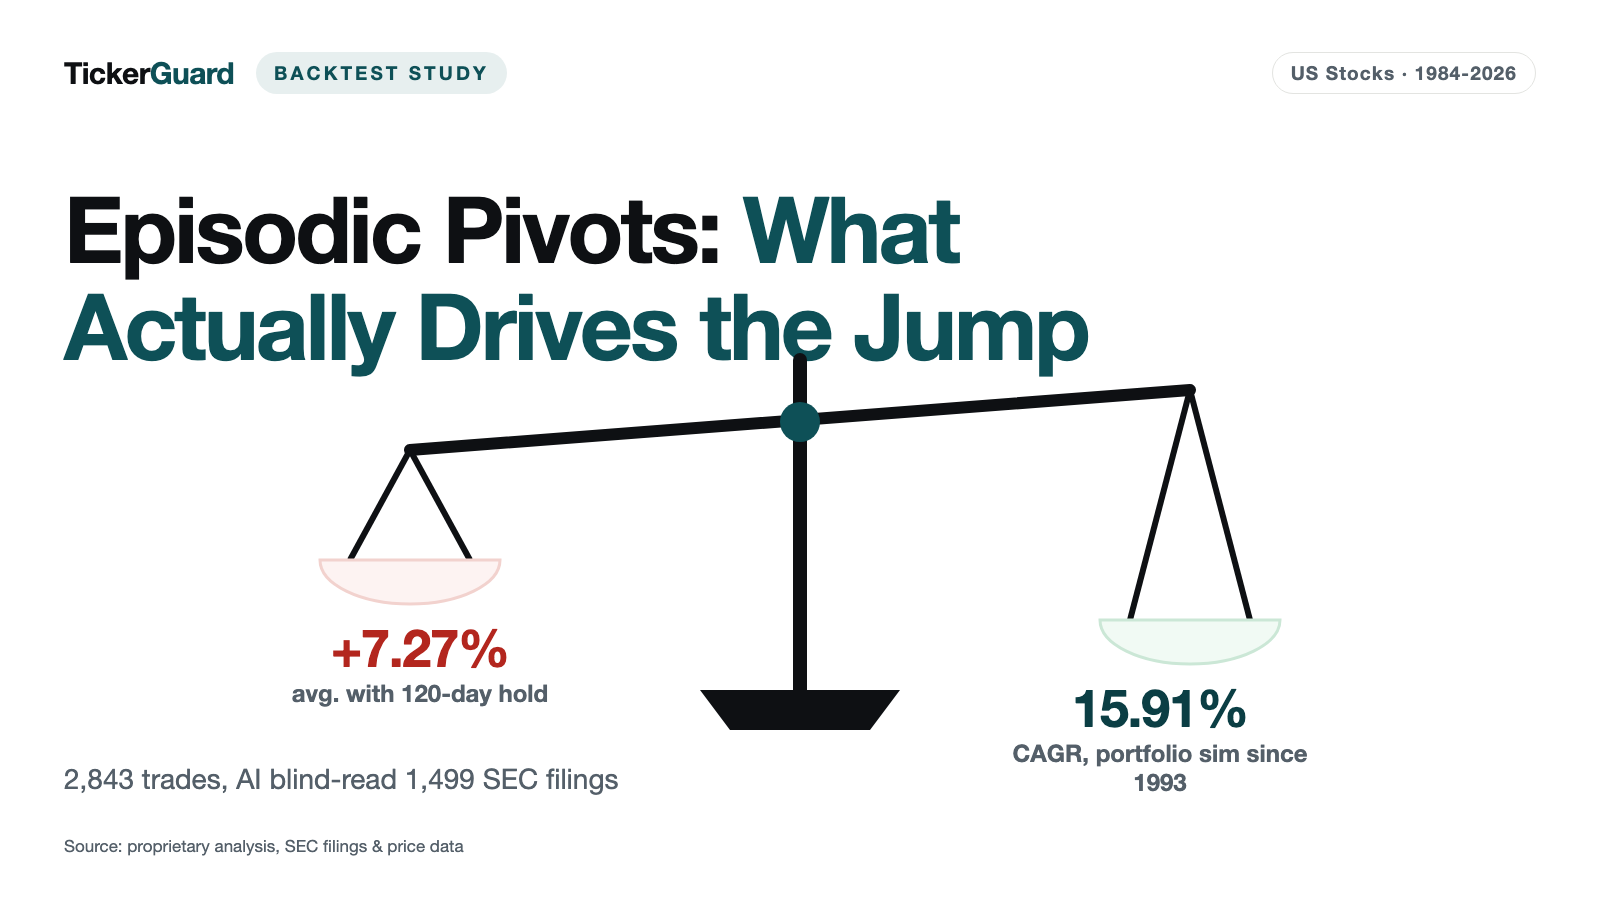
- 15.91% per year is what a portfolio simulation of the base rule (all Episodic Pivot events) returned since 1993 — versus 10.76% for the S&P 500 total return over the same period. The event itself carried the return, not its content.
Over the tested period, what drove an Episodic Pivot event was mainly THAT a filing came out at all — the content judgment, whether from an AI or an attentive reader, made little difference to the trade.
Setup: 2,843 trades, 1984 through 2026, survivorship-free
The base is 2,843 Episodic Pivot events (large price gaps, mostly following an SEC filing) from 23 April 1984 through 24 July 2026. The analysis is survivorship-free: delisted stocks stay in the sample, so the result is not just showing the survivors. Costs of 0.2% per leg (buy and sell) apply throughout. The benchmark is a random baseline — the same stocks, but arbitrary rather than actual event days — which averages around -0.43%, the zero line every figure in this study should be read against.
The experiment: an AI reads 1,499 filings blind
The core of this study is a simple but strict experiment: 1,499 of the total events recorded carried an attributable SEC filing. An AI read each of these filings — text ONLY, with no price, no outcome, no information at all about what happened afterward — and delivered a judgment: should this filing push the stock up or not, and how confident is that judgment?
| Blind judgment | Trades | Avg. return |
|---|---|---|
| "should rise" | 1,067 | +4.30% |
| every other judged case | 412 | +4.02% |
The gap between "the AI expected a positive catalyst" and "it did not" is just 0.29 percentage points — practically no difference. The CONTENT of the filing, read the way an attentive human reader would read it, tells you almost nothing about the actual trade.
The more confident the call, the weaker the trade
More striking than the first finding is the second. Within the cases where the AI judged "should rise," confidence was also recorded, in three tiers (high, medium, low). The ordering runs against intuition.
| Confidence ("should rise" cases only) | Trades | Avg. return |
|---|---|---|
| high | 481 | +3.44% |
| medium | 374 | +4.09% |
| low | 212 | +6.64% |
The more confident the AI was that a filing was bullish, the WORSE the trade actually performed — from +6.64% at low confidence down to just +3.44% at high confidence. A plausible interpretation: whatever obviously sounds good to an attentive reader sounds equally obvious to the market on the gap day itself — and is already priced in before the trade is even possible. Surprise value, not the quality of the news, appears to be what drives the trade.
What actually matters: THAT numbers came out, not WHAT they said
If content barely matters, what does? The answer lies in a much simpler distinction: whether an earnings report was the trigger at all — regardless of whether the numbers were good or bad.
| Catalyst | Trades | Hit rate | Avg. return |
|---|---|---|---|
| Earnings gap | 1,153 | 55.2% | +4.84% |
| No earnings gap | 869 | 43.4% | +3.74% |
Both the hit rate and the average return sit clearly higher for earnings gaps. The bare fact that a company reported numbers that day — with everything that comes attached: analyst reaction, volume, attention — appears to matter more to the trade than any qualitative read of the filing itself.
Holding longer beats the short exit
Beyond event type, holding period was also tested: a fixed 120-trading-day exit against the short Qullamaggie base exit (an MA20 trailing stop with half the position sold after three trading days). The base group covers 2,843 trades, the 120-day run 2,836 — seven events fall out of scope because of the longer observation window.
| Exit rule | Trades | Avg. return |
|---|---|---|
| Fixed 120 trading days | 2,836 | +7.27% |
| Short base exit | 2,843 | +3.89% |
The long approach almost doubled the return versus the short exit. The short exit left a substantial part of the move uncaptured in this analysis.
The sweet spot: gaps between 30% and 50%
Not every price gap is worth the same. The breakdown by gap size shows a clear sweet spot in the middle size bracket — not among the largest, most spectacular jumps.
| Gap size | Avg. return (short) | Avg. return (long, 120 days) | Hit rate (short) |
|---|---|---|---|
| 30-50% | +6.8% | +11.5% | 46.3% |
| 50%+ (giant gap) | +3.0% | +9.4% | 35.3% |
Giant gaps above 50% are actually the weakest of all gap classes short-term, at just a 35.3% hit rate and the lowest average return (+3.0%) — likely because this bucket carries a heavier mix of takeovers, bankruptcies, and other special situations with limited further upside. The 30-50% range delivers the best balance of frequency and return.
The "king setup": a 30-50% gap WITH earnings
Combining the gap sweet spot with an earnings catalyst produces the strongest single setup in this study:
| Setup | Cases | Avg. return (short) | Avg. return (long, 120 days) |
|---|---|---|---|
| 30-50% gap WITH earnings | 52 | +17.9% | +20.2% |
Honesty about the sample size is warranted: 52 events in a good 40 years is rare — barely more than one per year on average. The result is striking but statistically thin, and should not be over-interpreted.
Takeover gaps: essentially worthless as a trade
One result that looks surprising at first glance concerns takeover gaps — price jumps triggered by the announcement of an acquisition.
| Catalyst | Trades | Avg. return |
|---|---|---|
| Takeover gap | 132 | +0.6% |
| Gap with no identifiable catalyst | 1,025 | +3.78% |
Takeover gaps average just +0.6% — essentially nothing. The reason lies in the nature of the event itself: in a cash takeover, the price jumps immediately to the offer price and sticks there until the deal closes. There is simply no further move left for a trader to capture. Gaps with no identifiable catalyst — jumps whose trigger could not be clearly attributed — actually performed notably better, at +3.78%.
The framework: portfolio simulation and cost assumptions
A portfolio simulation of the base rule (all Episodic Pivot events) over the full available period since 1993 returns 15.91% per year — versus 10.76% for the S&P 500 total return index (dividends included) over the same period. As a control, a random baseline (the same stocks, but arbitrary rather than actual event days) averages around -0.43% — the zero line every figure in this study should be read against. A cost of 0.2% per leg applies throughout.
Limitations of this study
- Fine-grained subgroups thin out fast and get noisy. The finer the breakdown — gap size × earnings status, for instance — the smaller the sample sizes get. One example: small gaps (10-15%) WITHOUT earnings held up surprisingly well over a long hold (notably better than their short-term result would suggest) — a single finding that looks more like noise than a robust pattern.
- Filing attribution is only reliable from the early 2000s onward. Before roughly 2001-2004, an SEC filing cannot always be cleanly matched to an event and an exact timestamp — the data foundation for the earlier decades is correspondingly patchier than for the more recent past.
- The blind judgments come from a single AI model snapshot at one point in time. A different model, or a later version of the same model, might judge SEC filings differently; the confidence-versus-outcome relationship measured here is a finding of this specific experiment, not a general property of AI judgment.
- Trading costs are a flat assumption. 0.2% per leg approximates bid-ask spread and fees only roughly; for less liquid names the real drag could run higher.
Readers who want to see the same survivorship-free rigor applied to a different pattern can find it in our Qullamaggie Backtest — another study in this series that, among other things, systematically tests short-term gap trading. The Episodic Pivot events analyzed here run on continuously in our Episodic Pivots scanner. More backtest studies live together in Studies.
Figures as of August 7, 2026.
This article is a historical analysis of publicly available price and filing data and not investment advice. It contains no buy or sell recommendation, no forecast, and no statement about any individual company listed today. Past results — whether simulated or real — are not a reliable indicator of future returns. Anyone making investment decisions should assess their own situation and risks, if in doubt with professional advice.
Frequently Asked Questions
An Episodic Pivot is a large, sudden price gap in a US stock, usually triggered by an SEC filing — earnings, a takeover, an approval, or some other price-moving news. This study analyzed 2,843 such events since 1984 (through July 2026), survivorship-free (delisted stocks included), with 0.2% cost per leg.
Barely. An AI read 1,499 SEC filings blind — text only, with no knowledge of the price or outcome — and judged in advance whether the stock should rise. Cases judged "should rise" returned +4.30%, while every other judged case returned +4.02%. The difference is negligible. More striking: within the "should rise" cases, the more confident the AI was, the weaker the actual trade — high confidence +3.44%, low confidence +6.64%. A plausible reading: whatever obviously sounds good to an attentive reader sounds just as obviously good to the market on the gap day, and is already priced in before the trade is even possible.
Simply whether an earnings report was the trigger at all. Gaps tied to an earnings event averaged +4.84% at a 55.2% hit rate (1,153 trades), versus only +3.74% at a 43.4% hit rate for gaps without earnings (869 trades). The bare fact that a company reported numbers that day appears to matter more than any qualitative read of what those numbers said.
In this analysis, a fixed 120-trading-day exit averaged +7.27% versus +3.89% for the short Qullamaggie base exit, on an almost identical trade count (2,836 versus 2,843). The long hold clearly beat the short one.
Yes — a sweet spot around a 30-50% price jump: +6.8% on the short exit, +11.5% on the long one. Combined with earnings, the result rises to +17.9% (short) / +20.2% (long) — but this "king setup" occurred only 52 times in a good 40 years, so the figure should be read with caution. Giant gaps above 50% are actually the weakest group short-term (just a 35% hit rate). Takeover gaps are practically worthless as a trade (+0.6%), because the price sticks to the offer price; gaps with no identifiable catalyst at all return +3.78%.
The base figures — 2,843 trades, 1984 through July 2026, survivorship-free, 0.2% cost per leg — rest on a broad dataset. A random baseline (the same stocks, arbitrary days) sits around -0.43%, and a portfolio simulation of the base rule returns 15.91% CAGR since 1993 versus 10.76% for the S&P 500 total return. Caveats: fine-grained subgroups thin out fast and get noisy (e.g. small gaps without earnings held up surprisingly well over a long hold), filing attribution is only reliable from the early 2000s onward, and the blind judgments come from a single AI model snapshot at one point in time.


