EVI Industries: Elevenfold Since 2016 — On Its Own, Growth Ran About 7 Percent a Year
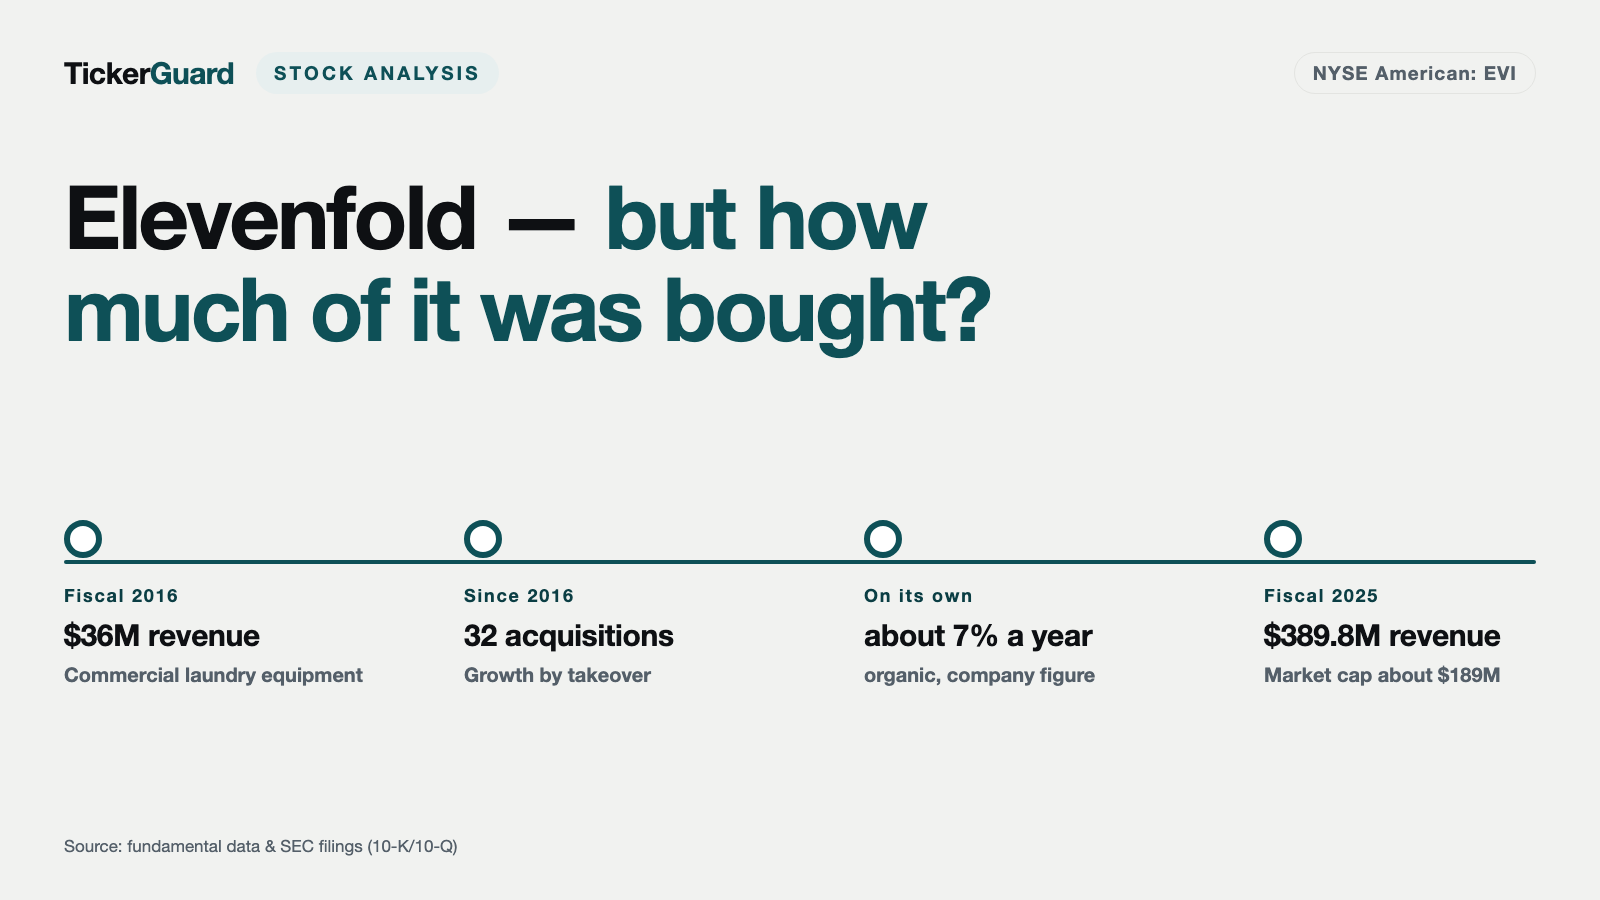
EVI Industries (NYSE American: EVI) grew revenue from $36.0 million in fiscal year 2016 to $389.8 million in fiscal year 2025 — a chart that looks like pure skill. The company's own filings tell a narrower story: growth came almost entirely from acquisitions and price increases, with organic revenue growing only about 7 percent a year by the company's own account. Part of the bill was paid in 83 percent more shares since 2016, plus a fresh debt jump after the largest acquisition in company history. We read the filings to the U.S. securities regulator, the SEC, together — who actually paid for this growth is a question only you can answer for yourself.
 Thomas Mücke
Founder & Publisher
Thomas Mücke
Founder & Publisher
As of Today
As of: October 12, 2026
- Closing price
- 18.70 $ -2.30%
- Market Capitalisation
- 0.2 $B
- P/E
- 39.8
- Growth Score
- 3/10
- AAQS
- 8/10
Price change since August 27, 2026: +27.2%
This analysis has a cut-off date. The Stock Guard tells you when something material changes in the numbers. Reserve your free spot
Chart
Interactive price chart (TradingView).
52-week range: 13.00 $ to 28.50 $ · Last price: 18.70 $ (As of: October 12, 2026)
Note: pure fact-based analysis, not investment advice and not a solicitation to buy or sell. All figures without guarantee.
There is a moment almost every investor recognizes the first time they see a stock chart labeled "since 2016": revenue at some obscure little industrial company climbs from a few dozen million dollars to nearly $400 million, the line looks like a rocket, and something in your brain clicks: "That's a serial acquirer that really knows what it's doing." A chart that multiplies elevenfold feels like skill. It feels like proof that somebody in that boardroom understands the business and deploys capital wisely. The question almost nobody asks in that moment is: who actually paid for this growth? At EVI Industries, Inc. (NYSE American: EVI) of Miami, Florida, that question is worth asking directly. Revenue rose from $36.0 million in fiscal year 2016 to $389.8 million in fiscal year 2025 — an elevenfold increase. But the company itself states, in its own press releases, that organic revenue grew only about 7 percent a year; the rest came from acquisitions and price increases. And while revenue multiplied elevenfold, the share count grew 83 percent. So let's make a deal: we'll read the actual reports EVI filed with the U.S. securities regulator, the SEC — the annual report (10-K) for fiscal year 2025, the latest quarterly report (10-Q), and the recent current reports (8-K) — and see how much of that rocket ride actually belongs to you as a shareholder, and how much you quietly helped pay for.
What EVI Industries Actually Does
In plain terms: EVI Industries is the wholesaler and repair service for the washers and dryers running behind the scenes at hospitals, hotels, prisons, cruise ships and commercial laundries — not the small machine in your basement, but multi-ton industrial equipment. The company sells and leases washing, drying, finishing and material-handling equipment, plus water heating and power generation systems for laundries, and it plans, installs, maintains and repairs that equipment through its own network of technicians. Customers span commercial laundries, hospitals, nursing homes, hotels, cruise lines, professional sports and correctional facilities. The underlying business model is called "buy-and-build": rather than growing organically, EVI has spent since 2016 continuously acquiring small, regional laundry-equipment distributors and stitching them into one national network. In 2016, that meant a single location in Florida with 32 employees; per a May 2026 press release, that has grown into 32 business units with roughly 900 employees (the fiscal year 2025 annual report cites 850 full- and part-time employees as of August 1, 2025). The company describes its own strategy plainly in its annual report: depending on the size of an acquisition, it pays in cash, stock, or a mix of both — and that detail matters more than it sounds, as you'll see shortly.
At the helm since March 2015 is Henry M. Nahmad, Chairman, CEO and President. Before that he ran Chemstar, and according to proxy filings, between 2001 and 2004 and again from 2007 to 2009 he worked at Watsco, Inc. — by its own description, "the largest distributor of HVAC/R products." That is evidently where he learned the distribution playbook he has run at EVI ever since: acquire small, local specialty distributors and scale them through one shared network. Any family connection to Watsco is not documented in SEC filings, so we stick to what is actually on the record: the employment history. If you're looking for a blueprint of controlled companies run by a dominant owner-operator, you may already know the pattern from our analysis of Flanigan's Enterprises — another family-run Florida small-cap with a strikingly similar control block. The parallel isn't a coincidence: small-cap Florida companies with a founder-CEO holding tight onto both capital and voting power show up in this pattern more often than chance would suggest.
Company history for investors
-
2015
Henry Nahmad becomes Chairman, CEO and President
Starting March 2015, a single owner-operator steers the future buy-and-build strategy — the starting point of today's control structure.
-
2016
Buy-and-build strategy begins from one Florida location
32 employees, one location, $36.0 million in revenue and 7.03 million shares — the baseline from which both revenue and share count later climbed.
-
2023
Press release first cites a ten-year CAGR of 37/24/35 percent
On November 9, 2023, management presents striking long-term growth rates — the first data point in a series that has declined ever since.
-
2025
Girbau North America acquisition closes, the largest in company history
On April 1, 2025, EVI acquires Girbau for roughly $38.4 million, financed through its credit facility — the trigger for the later debt jump.
-
2025
Press release first quantifies organic growth at 7 percent
On September 11, 2025, the fiscal year 2025 press release puts organic growth at 7 percent per year — the only such figure across all filings.
-
2026
Sudsies purchase agreements — entry into consumer business
On July 17, 2026, EVI signs $34.6 million in agreements for a consumer garment-care business — its first step outside the core B2B business.
-
2026
$10 million share buyback program announced
On July 28, 2026, EVI announces buybacks via press release, with no accompanying SEC filing — until then the fiscal 2025 annual report reported no formal repurchase program.
How This Stock Landed On Our Desk
EVI Industries surfaced while we were screening serial acquirers among U.S. small caps — companies that grow mainly through acquisitions and like to call themselves "compounders." What made the stock interesting was its price in late August 2026, sitting near its 52-week low: on August 27, 2026, EVI shares traded around $14.70 — 57 percent below the 52-week high of $34.48 (source: fundamental data, as of August 27, 2026). A stock that loses more than half its value in a year while revenue keeps growing at a double-digit clip is a contradiction worth digging into. A second finding made the research more interesting still: per fundamental data, insider ownership stands at roughly 59.6 percent (as of August 27, 2026) — a broader metric than the 56.2 percent and 57.4 percent voting-control figures quoted later from SEC filings, since it also folds in additional insider disclosures (Form 4 filings) that aren't defined the same way as SEC voting power. Either way, management owns a very large slice of this company. Remember this image as you read on: a stock with heavy insider ownership can mean genuinely aligned incentives — or it can simply mean nobody outside the boardroom has a real say. Which reading fits EVI is exactly what the rest of this analysis is for.
The Numbers Over The Years — Honestly Appraised
Before we turn critical, EVI Industries deserves credit: what this company built over ten years is genuinely impressive. Revenue climbed from $36.0 million in fiscal year 2016 to $389.8 million in fiscal year 2025 — and the company turned a profit in every single one of those years, without a single loss. Gross margin, the share of revenue left after the cost of goods sold, rose from 24.7 percent in fiscal year 2021 to 30.4 percent in fiscal year 2025 — a sign that scale and pricing power are genuinely taking hold. The company also paid three consecutive special dividends: $0.28 per share in October 2023, $0.31 in October 2024, and $0.33 in October 2025. That is the side of the story that lives on every investor-relations slide — and it isn't wrong.
One fiscal-year quirk matters for the rest of this piece: EVI's fiscal year does not end on December 31 like most U.S. companies — it ends on June 30. "Fiscal year 2025" therefore covers July 1, 2024 through June 30, 2025, not calendar year 2025. Every figure in this article carries its fiscal year (FY) or a specific quarter-end date, so you never have to guess which period is meant.
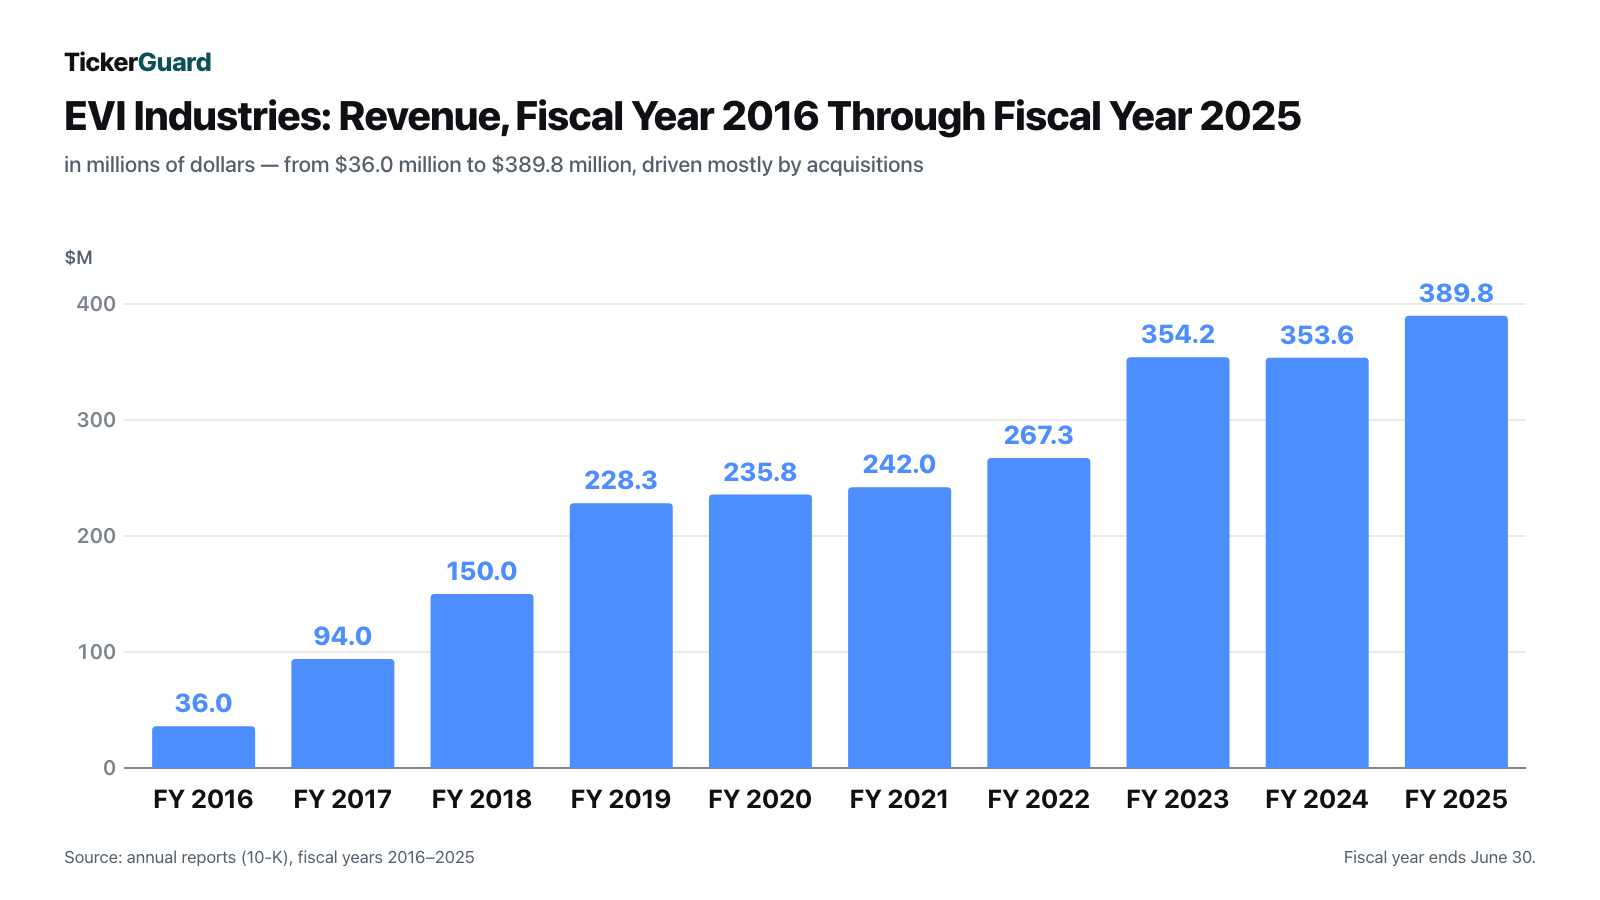
That curve is the reason EVI ended up on our desk in the first place. But a growth curve alone doesn't answer the question this whole analysis is built on: how much of it did the company actually earn itself — and how much did it buy? That's the next chapter.
Organic Growth Or Bought Growth?
This is the core of the analysis. EVI Industries counted 32 business units as of May 2026 — built from 31 acquisitions through September 2025 plus a 32nd, Belenky, Inc. of Ohio, completed on February 28, 2026. Over the years, that has been paid for with roughly $117 million in cash (the sum of cash paid for acquisitions per the cash flow statement, fiscal years 2017 through the first nine months of fiscal year 2026) plus another roughly $76.4 million in company stock (fiscal years 2017 through 2024). The single largest acquisition in company history was Girbau North America, completed April 1, 2025 for roughly $38.4 million in total consideration — financed through the credit facility, with a direct consequence for the balance sheet, as the next chapter shows.
So what's left of those impressive growth rates once you strip out the acquisitions? The fiscal year 2025 annual report (10-K) describes the driver of revenue growth this way:

"Revenues for fiscal 2025 increased by approximately $36.3 million (10%) from fiscal 2024. The increase was primarily attributable to revenues generated by businesses acquired by the Company during fiscal 2025 as well as price increases established throughout the Company's product lines and service offerings aimed at maintaining or increasing margins to cover incremental product and operating cost increases."
— EVI Industries, Inc., SEC annual report 10-K for fiscal year 2025 (filed September 11, 2025), Item 7, Management's Discussion and Analysis
Not one word about organic new business — in the MD&A (Management's Discussion and Analysis, the section of the annual report explaining what drove the numbers), that is the only stated explanation, year after year, in nearly identical language in the most recent quarterly report too.
A number for the organic growth rate shows up in exactly one place — not the annual report itself, but the accompanying press release for the fiscal 2025 results:

"These results have been driven by the acquisition of 31 businesses, along with a 7% compounded annual growth rate in organic revenue, highlighting the effectiveness of EVI's disciplined approach to growth."
— EVI Industries, Inc., current report 8-K, press release dated September 11, 2025, Exhibit 99.1
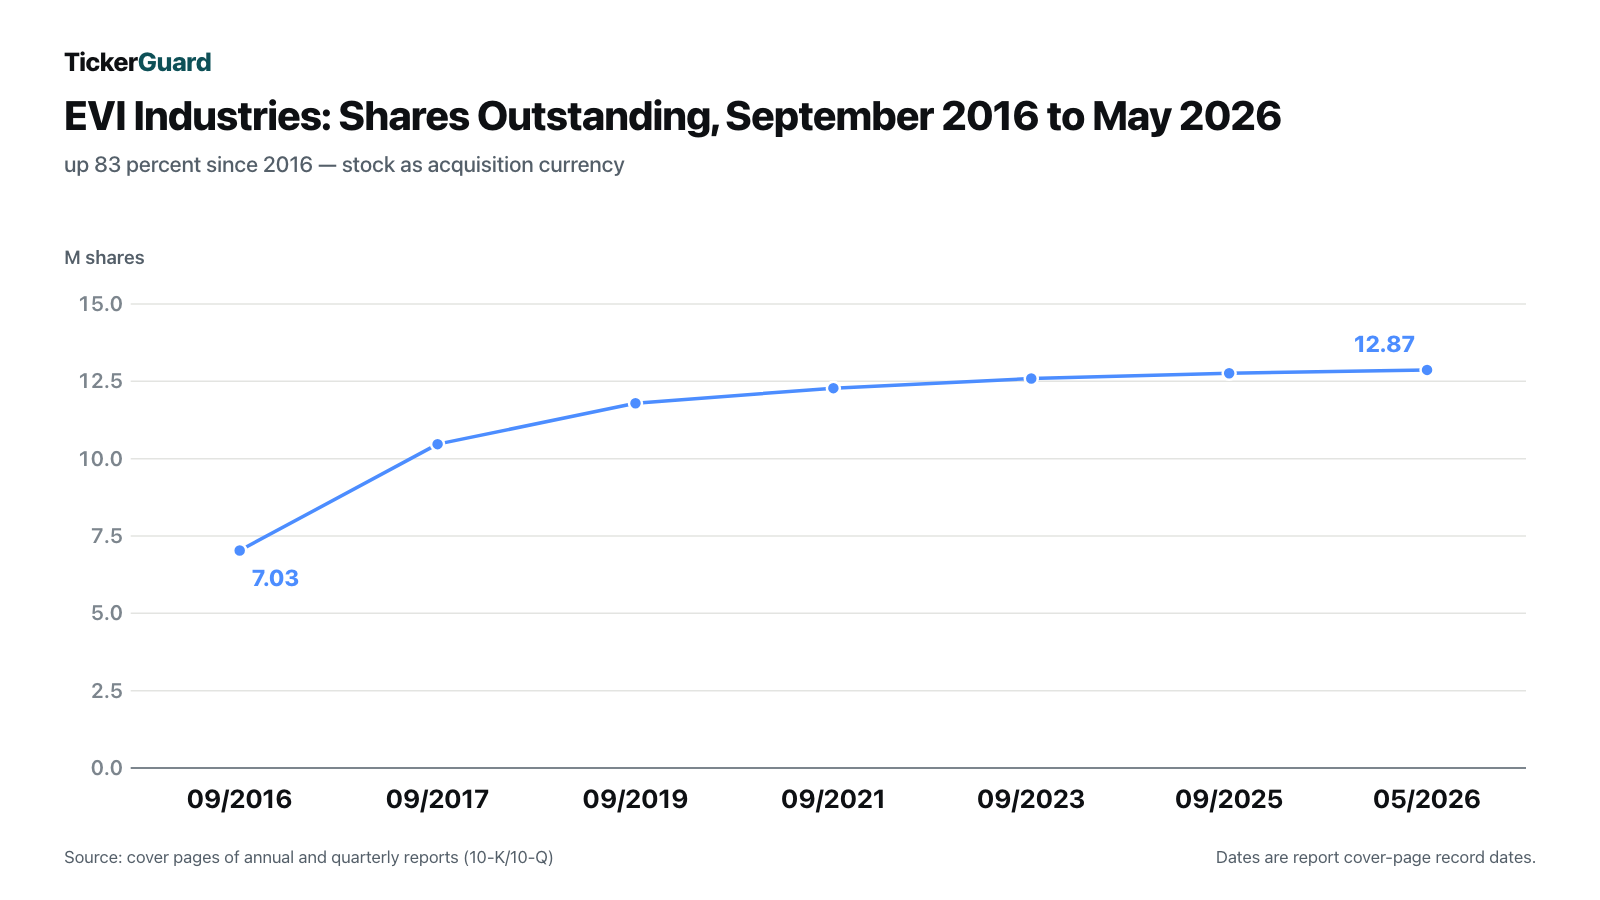
Do the math for a second: the company's own press releases put the ten-year revenue compound annual growth rate (CAGR) at roughly 29 percent. Subtract the self-reported 7 percent organic growth, and the overwhelming remainder — more than 20 percentage points a year — belongs entirely to acquisitions and price increases. A GAAP breakdown (a figure audited under generally accepted accounting principles) of how much revenue in each individual fiscal year came from existing locations versus new acquisitions simply doesn't exist in either the 10-K or the 10-Q. That gap isn't necessarily a red flag by itself — plenty of serial acquirers skip that disclosure — but it does mean: the 7 percent figure is a company claim, not an audited number, and it appears exactly once, not repeated in every quarterly filing. This growth was also paid for with fresh shares: the share count rose from 7.03 million in September 2016 to 12,869,113 as of May 6, 2026 — an 83 percent increase.
For comparison, it's worth glancing at another controlled company we've already dissected: Biglari Holdings, where a single capital allocator also drives every capital decision, though through a completely different structure (investment funds rather than acquisitions). The shared lesson from both cases: growth paid for with fresh shares is never entirely free — your slice of the pie shrinks a little with every new share issued, even as the pie itself keeps getting bigger.
What The Filings Say — Four Uncomfortable Truths
Uncomfortable truth No. 1: Dilution — earnings per share are growing far slower than revenue
Dilution means, in plain terms: your slice of the pie gets smaller every time a new slice gets cut, even as the whole pie grows. That's exactly what happened at EVI. Shares outstanding rose 83 percent since September 2016, and for the earnings-per-share calculation EVI counts an even higher figure because of unvested restricted shares — 13.65 million diluted shares versus 12.87 million basic shares in the nine-month calculation for fiscal year 2026, roughly 6 percent higher. The company's own most recent press release (May 2026) puts the ten-year net income CAGR at only about 15 percent — well below the roughly 29 percent revenue CAGR. In other words: even giving the company full credit for every acquisition, earnings per share grow slower than revenue, because part of the gain is continually handed to new shareholders.
Uncomfortable truth No. 2: the debt jump after Girbau — and a shrinking credit cushion
The largest acquisition in company history left its mark on the balance sheet too. As of March 31, 2026, EVI Industries had drawn $60.0 million under its revolving credit facility, according to its quarterly report (10-Q) — at a weighted average interest rate of 5.04 percent. The facility carries a nominal capacity of $150 million (plus an accordion option to $200 million), but because of loan covenants — contractual borrowing conditions, such as a maximum leverage ratio, whose breach can trigger immediate repayment — only $36.3 million was actually available to borrow as of that date. Interest expense for the first nine months of fiscal year 2026 rose about 72 percent year over year ($2.96 million versus $1.72 million, per the quarterly report). At the end of fiscal year 2024 (June 30, 2024), 21 months before that balance-sheet date, the company carried just $13.0 million in debt — net debt has since more than quadrupled to $55.7 million (as of March 31, 2026). The quarterly report (10-Q) confirms the new scale directly:
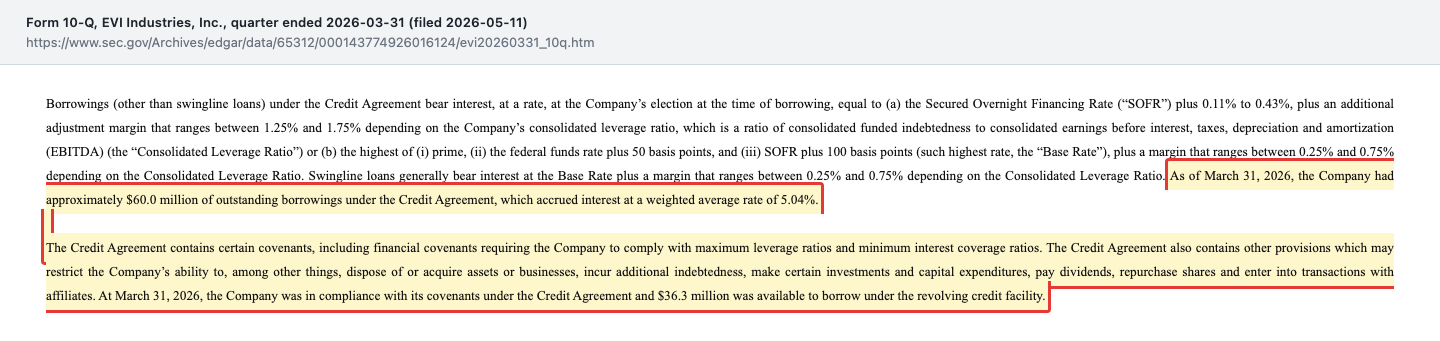
"As of March 31, 2026, the Company had approximately $60.0 million of outstanding borrowings under the Credit Agreement, which accrued interest at a weighted average rate of 5.04%." … "At March 31, 2026, the Company was in compliance with its covenants under the Credit Agreement and $36.3 million was available to borrow under the revolving credit facility."
— EVI Industries, Inc., SEC quarterly report 10-Q as of March 31, 2026 (filed May 11, 2026)
Two more large cash uses have arrived since that balance-sheet date and will put further pressure on the books: the Sudsies acquisition (about $34.6 million, mostly cash) and a newly announced share buyback program — more on both in the "recent developments" chapter below.
Uncomfortable truth No. 3: four manufacturers account for 72 percent of all purchasing
EVI sells other companies' equipment — American Dryer, Chicago Dryer, Cleaver Brooks, Girbau, Dexter, Fulton, Kannegiesser, Maytag, Pellerin Milnor, Unipress, Softrol, Fagor and Whirlpool are listed as suppliers in the annual report. The problem: purchasing is heavily concentrated.
"While the Company purchases the products it distributes from a number of manufacturers and suppliers, purchases from four manufacturers accounted for a total of approximately 72% and 73% of the Company's product purchases for fiscal 2025 and 2024, respectively."
— EVI Industries, Inc., SEC annual report 10-K for fiscal year 2025, Risk Factors
Picture a hardware store that stocks tools from dozens of brands — but nearly three-quarters of the merchandise comes from just four factories. If one of them goes dark, a huge chunk of the shelf empties out, no matter how full the rest of the store looks. The report doesn't name which four manufacturers, and it notes that supplier agreements are often short-term and cancelable, with exclusivity limited to "certain products in certain areas." That this risk is not theoretical is confirmed elsewhere in the same filing: at several acquired businesses, the relationship with the prior principal supplier ended once EVI took over, forcing those locations to distribute other brands from EVI's remaining suppliers instead. A documented precedent, not a hypothetical buried in boilerplate.
Uncomfortable truth No. 4: control sits firmly with a small group — and compensation eats a large share of profit
Who actually runs EVI? Per the proxy statement (DEF 14A) dated November 20, 2025, management and the board of directors together control roughly 56.2 percent of voting power — the fiscal year 2025 annual report cites 57.4 percent as of June 30, 2025. Part of that block — 431,466 shares — is controlled not directly but through stockholders agreements with sellers from prior acquisitions: anyone who sells their business to EVI and receives stock as part of the consideration contractually agrees to vote alongside management. The annual report states it directly:

"The Company's management, including Henry M. Nahmad, the Company's Chairman, Chief Executive Officer and President, and the Company's Board of Directors through stockholders agreement granting it the right to direct the voting of certain shares issued as consideration in acquisitions, may be deemed to control the Company as a result of their collective voting power over shares representing approximately 57.4% of the issued and outstanding shares of the Company's common stock as of June 30, 2025."
— EVI Industries, Inc., SEC annual report 10-K for fiscal year 2025 (filed September 11, 2025)
This exact pattern — an owner-operator who, acquisition by acquisition and stock swap by stock swap, cements his own voting majority — may sound familiar from our analysis of Biglari Holdings, where Chairman Sardar Biglari reaches roughly 73 percent of the vote through a different mechanism (investment funds rather than acquisition contracts). At EVI the mechanism is subtler, but the effect is similar: the acquisition currency comes with votes attached. For you as a minority shareholder, that means even if you were dissatisfied, there is no realistic path to assembling a majority against management.
Then there's CEO Henry Nahmad's compensation. For fiscal year 2025, the proxy statement disclosed total compensation of $5,350,835 ($650,000 salary, $650,000 bonus, $3,999,997 in stock awards, $50,838 other). Measured against the company's net income of $7.5 million for the same fiscal year, that equals 71 percent of total profit — in fiscal year 2024 it was even higher, at 105 percent (compensation of $5,914,510 against net income of $5.65 million). In fairness, there is a mitigating detail: $4.0 million of that compensation consists of restricted shares Nahmad cannot actually access until November 5, 2040, his 62nd birthday — an unusually long vesting schedule that meaningfully reduces any short-term incentive to sell. Still, the underlying mechanics remain: one man controls the voting majority and, in effect, approves his own pay package — one that, in weaker years, has consumed more than the company's entire profit.
One more small but telling footnote on the company's own communication discipline: in its July 20, 2026 press release announcing the Sudsies acquisition, EVI initially cited a wrong figure. It had to correct that three days later in a separate current report:
"In the press release the Company inadvertently overstated the compounded annual growth rate for a five year period for EBITDA of 62%. The corrected percentage is 31%."
— EVI Industries, Inc., current report 8-K dated July 23, 2026, Item 8.01
A growth-rate overstatement of more than double the actual figure, at a company whose entire investment narrative rests on impressive CAGR numbers, is not a trivial slip. At the very least, it suggests the company's own headline metrics aren't always cross-checked carefully before they go public.
What Management Promised — And What Happened
One quirk you should know before taking management's statements at face value: EVI Industries does not hold traditional earnings calls with a live analyst Q&A. No analyst question period is documented in any of the releases reviewed for this analysis; instead, every quarterly and annual release from November 2023 through May 2026 points readers to a "pre-recorded earnings conference call" — prepared remarks from Chairman and CEO Henry Nahmad on the investor relations page, supplemented by written press releases. That means there is simply no opportunity to test how management responds to pointed follow-up questions, because such questions are institutionally never asked at EVI. What follows is therefore an evaluation of pure prepared statements, not of answers given under pressure.
In September 2024, discussing fiscal year 2024 results in which operating profit had fallen 30 percent because of heavy investment spending, management promised: "the Company expects that these investments will yield positive returns in the forthcoming periods." A year later, in fiscal year 2025, operating profit did in fact rise 18 percent. The promise held up, at least partially — until net income fell 8 percent again in the first nine months of fiscal year 2026 (through March 31, 2026), as interest expense and integration costs grew faster than operating profit. A similar pattern applies to the margin promise from the fiscal year 2025 press release, which spoke of progress "toward the Company's operating margin goal" without ever naming a concrete target level — a statement that can be neither confirmed nor disproven after the fact by design.
The tone shift in May 2026 is worth noting. After years in which every release trumpeted new acquisitions and record numbers, the message accompanying the third quarter of fiscal year 2026 suddenly sounded different:
"As our enterprise continues to mature, we believe we are entering a new phase focused on operational optimization, process improvement, and enterprise-wide coordination initiatives intended to improve scalability, efficiency, customer experience, and long-term operating performance."
— Henry M. Nahmad, Chairman & CEO, EVI Industries, Inc., third-quarter fiscal year 2026 press release, Exhibit 99.1 to the current report (8-K) dated May 11, 2026
In plain terms: the company is shifting from buying to cleaning up. A management team that, after a decade of continuous acquisitions, suddenly pivots from "building" to "tidying up" is also signaling something else: integrating all those acquisitions — 850 to 900 employees spread across 32 locations — apparently was not yet finished, even though the ERP system (the company's core business software) was already described as "substantially completed."
What makes this tone shift especially notable: it lines up with the CAGR erosion described earlier. The company's own reported ten-year growth rates (revenue / net income / adjusted EBITDA) have declined steadily over time — from 37/24/35 percent in the November 9, 2023 press release, to 33/16/30 percent (September 12, 2024) and 30/18/27 percent (September 11, 2025), down to just 29/15/26 percent in the May 11, 2026 release. Every single one of those releases used the word "record." But the underlying long-term growth rates get smaller with every letter. Worth remembering the next time a quarterly report announces another "record revenue" quarter.
Recent Developments Since The Last Quarterly Report
One important caveat first: fiscal year 2026 ended on June 30, 2026, and as of this analysis (data as of August 29, 2026) the corresponding annual report (10-K) has not yet been filed. Last year's equivalent report appeared on September 11, 2025, so a similar timing — mid-September 2026 — is reasonable to expect. Until then, there are no audited full-year figures for fiscal year 2026; any statement about the full year would be pure speculation, and we deliberately avoid making one.
Two events since the last quarterly report are still worth knowing. First: on July 17, 2026, EVI signed four purchase agreements to acquire Sudsies, Inc., a Florida garment-care company, disclosed via current report (8-K) on July 23, 2026. Total consideration runs to roughly $34.6 million, mostly in cash. What makes this different: Sudsies isn't another laundry-equipment distributor like the previous 32 acquisitions — it's a consumer-facing garment-care business, EVI's first step from B2B distribution into direct-to-consumer service. Of that total, $7,124,778 is allocated purely to the purchase of Sudsies co-founder Jason Loeb's "personal goodwill" — a legal structure that separately compensates an individual's personal reputation and customer relationships, common in smaller family-run deals but unusual at this scale. Closing was expected 30 to 45 days after signing, with either party able to walk away if it hasn't closed by September 1, 2026.
Second: on July 28, 2026, EVI announced a $10 million share buyback program — per the fiscal 2025 annual report (10-K), the company had no formal share repurchase plan in place until then ("The Company does not have in place any formal share repurchase plans or programs"). Notably, this announcement came exclusively via press release; no separate SEC filing exists for it as of this writing. That leaves an open question only the upcoming annual report can answer: how does a company that just committed roughly $34.6 million to the Sudsies deal, and has already drawn $60.0 million on its credit facility, also fund a buyback program — especially when its credit agreement can explicitly restrict share repurchases? That question remains unanswered until the fiscal year 2026 annual report arrives.
Valuation: A Rich Multiple For A Thin Margin
As of August 27, 2026, EVI Industries carried a market capitalization of roughly $189 million. Against revenue, that works out to a price-to-sales ratio of roughly 0.44 — modest at first glance. The trailing price-to-earnings ratio (P/E), however, sits at roughly 33, and the ratio of enterprise value to adjusted earnings before interest, taxes, depreciation and amortization (EV/EBITDA) at roughly 11.4. A P/E of 33 means investors are paying 33 times annual earnings for a company whose net margin — the share of revenue left as profit — has recently run between 1.6 and 1.9 percent. For context, a "healthy" net margin in manufacturing and distribution often runs in the high single digits; at 1.6 to 1.9 percent, less than two cents of every dollar in revenue actually ends up as profit. A P/E of 33 on a margin that thin signals that the market isn't paying for today's earning power — it's paying for the expectation that future acquisitions and scale will meaningfully improve that margin.
One more caution about the adjusted metric EVI likes to cite: the company's own "Adjusted EBITDA" strips out not just interest, taxes, depreciation and amortization, but also stock-based compensation — the very shares used to pay both management and the sellers of acquired businesses. In the first nine months of fiscal year 2026, that excluded stock-based compensation made up roughly 20 percent of reported Adjusted EBITDA ($3.96 million of $20.0 million). At a company that routinely pays in its own stock — for acquisitions and for executive pay alike — that accounting choice flatters the valuation picture: the effective EV/EBITDA would run somewhat higher than the reported 11.4 if stock compensation were treated for what it economically is — a real cost, even without a cash outflow.
Opportunities And Risks At A Glance
What speaks for EVI Industries:
- Ten straight years of profitability with zero loss years, alongside a gross margin that climbed from 24.7 percent (fiscal year 2021) to 30.4 percent (fiscal year 2025) — real evidence of scale economies in purchasing.
- A proven, repeatable acquisition playbook: 32 acquisitions through February 2026, financed with a mix of cash (roughly $117 million) and company stock (roughly $76.4 million) — backed by three consecutive special dividends (2023 through 2025) as proof of genuine cash-return capacity.
- A modest price-to-sales ratio of roughly 0.44 (as of August 27, 2026) and a stock trading 57 percent below its 52-week high — a potentially cheaper entry point than a year ago for investors who believe the acquisition model still has runway.
- The new consumer push through Sudsies (announced July 2026) could open a second, potentially higher-margin business line alongside the thinner-margin B2B distribution core, if integration succeeds.
What speaks against EVI Industries:
- Organic growth of only about 7 percent per year, by the company's own unaudited account — without a GAAP breakdown, it remains unclear how strongly the core business would actually grow without new acquisitions.
- Dilution of 83 percent since 2016, and a net income CAGR (15 percent) running well below the revenue CAGR (29 percent) — a portion of every acquired revenue dollar mathematically belongs to new shareholders, not existing ones.
- Net debt of $55.7 million (as of March 31, 2026) after the Girbau acquisition, only $36.3 million of covenant headroom remaining, and interest expense up about 72 percent — with the Sudsies payment and the new buyback program adding further pressure.
- Voting control of 56.2 to 57.4 percent held by management and the board, partly through stockholders agreements with sellers, plus CEO compensation that exceeded the entire company's net income in fiscal year 2024 (105 percent) and still claimed 71 percent of it in fiscal year 2025.
- A trailing P/E of roughly 33 against a net margin of just 1.6 to 1.9 percent, and a net income decline of 8 percent in the first nine months of fiscal year 2026.
A Human Conclusion
Back to the pull we opened with. A chart that multiplies elevenfold feels like skill — that's no accident, but a fairly reliable psychological response. Rising lines trigger a sense of competence and safety in almost all of us, regardless of how that line was actually produced. At EVI Industries, a substantial share of it came from acquisitions and price increases, paid for with debt and with 83 percent more shares since 2016. That doesn't automatically make this a bad investment — buy-and-build models can work, and EVI turned a profit in every single one of the past ten fiscal years, something far from every growing company can claim. But it does mean the decisive question isn't "how fast did revenue grow?" It's: how much of that growth stands on its own once the next acquisition doesn't happen — and how much of your share in it have you already handed back over the years, through new shares and a CEO pay package that regularly outsizes the profit it's drawn from? Neither we nor EVI itself can answer that with full certainty — the audited breakdown simply doesn't exist. What you make of that gap, whether you treat it as a warning sign or a footnote, is your decision to make, not ours.
Sources
All original documents used in this analysis — for you to verify yourself:
- EVI Industries, Inc. — SEC annual report 10-K for fiscal year 2025 (filed September 11, 2025)
- EVI Industries, Inc. — SEC quarterly report 10-Q as of March 31, 2026 (filed May 11, 2026)
- EVI Industries, Inc. — current report 8-K dated May 11, 2026, third-quarter fiscal year 2026 press release (Exhibit 99.1)
- EVI Industries, Inc. — current report 8-K dated July 23, 2026 on the Sudsies acquisition, including the EBITDA growth-rate correction (Items 1.01 and 8.01)
- EVI Industries, Inc. — press release on fiscal year 2025 results, dated September 11, 2025 (Exhibit 99.1 to the 8-K)
- EVI Industries, Inc. — proxy statement (DEF 14A) dated November 20, 2025
- Business Wire — press release on the share buyback program, dated July 28, 2026
- EVI Industries, Inc. — investor relations page (ir.evi-ind.com)
- Full SEC filing history for EVI Industries, Inc.: EDGAR filing index (sec.gov)
- Fundamental data (metrics, valuation, price history; data as of August 27, 2026), reconciled against SEC filings and SEC XBRL company facts.
Transparency & disclaimer: This analysis is a journalistic contextualization of publicly available information and is not investment advice, not a regulated financial analysis, and not a solicitation to buy or sell any security. Stock investments carry substantial risk, including the risk of total loss. All figures are provided without guarantee; data cut-off dates are noted throughout the text. The author holds no position in EVI Industries stock as of publication.
Key figures at a glance
All monetary figures in millions of $; earnings per share as reported.
| Metric | 2022 | 2023 | 2024 | 2025 | 2026 |
|---|---|---|---|---|---|
| Revenue | 267.3 | 354.2 | 353.6 | 389.8 | 446.6 |
| Operating Income (EBIT) | 6.4 | 16.5 | 11.6 | 13.8 | 15.7 |
| Net Income | 4.1 | 9.7 | 5.6 | 7.5 | 7.7 |
| Net Margin | 1.5% | 2.7% | 1.6% | 1.9% | 1.7% |
| Earnings Per Share | 0.32 $ | 0.76 $ | 0.43 $ | 0.57 $ | 0.57 $ |
Source: fundamental data & SEC filings (annual and quarterly reports, 10-K/10-Q)
Our Bottom Line at a Glance
- Operating substance & track record positive
- Ten consecutive profitable fiscal years (fiscal year 2016 through 2025), gross margin up from 24.7% (fiscal year 2021) to 30.4% (fiscal year 2025), three consecutive special dividends (October 2023 through October 2025) — a working business model with documented scale economies.
- Organic growth negative
- Only about 7 percent organic revenue growth per year per the September 11, 2025 press release, against a ten-year total revenue CAGR of roughly 29 percent (May 11, 2026 release) — an audited GAAP breakdown of organic versus acquired growth is entirely absent from both the annual and quarterly reports.
- Dilution negative
- Shares outstanding up 83 percent since September 2016 (7.03 million to 12,869,113 shares as of May 6, 2026), roughly $76.4 million paid in stock for acquisitions; net income CAGR (15%) remains well below revenue CAGR (29%, May 11, 2026 release).
- Balance sheet & leverage negative
- Net debt jumped to $55.7 million (March 31, 2026) after the Girbau acquisition; only $36.3 million of covenant headroom remains on the $150 million credit facility, and interest expense rose 72% in the first nine months of fiscal year 2026.
- Governance & control negative
- Management and the board control 56.2% of the vote (proxy dated November 20, 2025; 57.4% per the annual report as of June 30, 2025), partly through stockholders agreements with sellers; fiscal year 2025 CEO compensation of $5.35 million equaled 71% of net income (fiscal year 2024: 105%).
- Valuation neutral
- A trailing P/E of roughly 33 (August 27, 2026) against a net margin of only 1.6–1.9% sits alongside a modest price-to-sales ratio of roughly 0.44; the company's Adjusted EBITDA excludes stock-based compensation (roughly 20% of Adjusted EBITDA in the first nine months of fiscal year 2026), flattering the reported valuation.
EVI Industries has grown revenue elevenfold since fiscal year 2016 and turned a profit in every single one of those years — a documented, working buy-and-build model with rising gross margin and three consecutive special dividends. But by its own account organic revenue grew only about 7 percent a year, part of the bill was paid with 83 percent more shares since 2016 and, most recently, a sharp debt increase after the Girbau acquisition; control sits firmly with management and the board, whose compensation has exceeded the entire company's profit in weaker years. Not investment advice.
What Our Rating Means
Open questions
The business works in principle, but one material question is open. As long as it stays open, our findings do not carry a quality verdict.
The business model has held up for ten straight years and stayed profitable throughout — that's a genuine strength. Still, several material operating questions remain open: net margin runs structurally at only 1.6 to 1.9 percent, the roughly 7 percent organic growth figure is an unaudited company claim with no GAAP breakdown, debt rose sharply after the Girbau acquisition, and net income already fell 8 percent in the first nine months of fiscal year 2026 while integration and modernization costs continue to weigh on results. That combination rules out both a green and a red light and lands squarely on a yellow one, with the open questions named plainly. The decision is yours.
A journalistic assessment by our editorial team at the time of the deep dive, based on public sources — not investment advice and not a solicitation to buy or sell. Your personal circumstances (investment goals, risk capacity, taxes) cannot be taken into account. What our levels mean, how verdicts are formed, and what conflicts of interest exist →
Worth Noting
- EVI Industries surfaced while screening serial acquirers among U.S. small caps; the stock traded around $14.70 on August 27, 2026, near its 52-week low, 57 percent below its high of $34.48.
- EVI's fiscal year ends June 30, not December 31 — "fiscal year 2025" means the period from July 2024 through June 2025. The annual report for the already-completed fiscal year 2026 had not yet been filed as of this analysis (August 29, 2026).
- Analyses are evergreen: the $14.70 price (August 27, 2026) is a dated valuation anchor, not a buy signal. Don't confuse the two ownership figures: SEC-proxy voting control (56.2–57.4%) and the broader fundamental-data insider-ownership metric (roughly 59.6%) use different methodologies.
Stock Watch
This analysis is as of August 29, 2026. Stock Watch will tell you what's changed at EVI since then.
Later $1 a month per stock — signing up is free, and you'll be the first to know when it launches.
The full analysis as a PDF for later
We will send you this analysis as a PDF — to print, file away, and read at your own pace. And we will add you to the free Stock Watch list for EVI Industries Inc (EVI), so you hear about it when something material in this analysis changes.
Frequently Asked Questions
EVI Industries, Inc. (NYSE American: EVI) of Miami, Florida sells, leases and services commercial laundry equipment — washing, drying and finishing systems for hospitals, hotels, cruise lines, correctional facilities and laundries. Through a "buy-and-build" model, it has continuously acquired small regional distributors since 2016; as of May 2026 it counted 32 business units with roughly 900 employees.
Revenue rose from $36.0 million in fiscal year 2016 to $389.8 million in fiscal year 2025 — driven mainly by 32 acquisitions and price increases. The fiscal year 2025 annual report attributes the revenue increase "primarily" to acquired businesses and price increases; it does not cite organic new business as a driver.
Per a September 11, 2025 press release, organic revenue growth ran at roughly 7 percent per year — the rest of the roughly 29 percent ten-year revenue CAGR came from acquisitions and price increases. EVI does not provide an audited, annual GAAP breakdown between organic and acquired growth.
On August 27, 2026, EVI shares traded around $14.70 — 57 percent below the 52-week high of $34.48. The filings themselves give no explicit reason for the decline; over the same period, the company disclosed a sharp debt increase after the Girbau acquisition and an 8 percent drop in net income for the first nine months of fiscal year 2026.
As of March 31, 2026, EVI had drawn $60.0 million under its credit facility at an average rate of 5.04 percent; net debt stood at $55.7 million. Of the $150 million credit facility, only $36.3 million remained available to borrow because of loan covenants.
Management and the board of directors controlled roughly 56.2 percent of voting power per the November 20, 2025 proxy statement (57.4 percent per the annual report as of June 30, 2025) — partly through stockholders agreements with sellers of prior acquisitions. Chairman and CEO Henry Nahmad has led the company since March 2015.
On July 17, 2026, EVI signed purchase agreements worth roughly $34.6 million to acquire Sudsies, Inc., a garment-care company — EVI's first move from B2B distribution into consumer-facing service. Closing was expected 30 to 45 days after signing; the first segment and revenue disclosures will come with the fiscal year 2026 annual report.
Found an error?
Did you spot a factual error, an outdated number, or a typo in this deep dive? Let us know briefly — your report goes straight to the editorial team.