Dycom: 56% Revenue Growth — One-Fifth of It Came From a Checkbook, Not a Cable Trench
Dycom Industries sits at rank 3 on our in-house "revenue inflection" scanner — and the headline number is impressive: 56.1 percent revenue growth in the first quarter of fiscal 2027. The original filings with the U.S. securities regulator, the SEC, show where that growth actually comes from: roughly one-fifth of it — $395.4 million — comes from Power Solutions, LLC, an acquisition Dycom closed for about $2 billion in December 2025 that added a brand-new business line overnight. The rest is genuine, organic growth in the legacy fiber business, driven by the fiber build-out and the data-center boom. We read through what part of the growth picture is truly new and what part is just repackaged. Not a recommendation — just a look at the seam between two growth stories the scanner shows as one.
 Thomas Mücke
Founder & Publisher
Thomas Mücke
Founder & Publisher
As of Today
As of: October 7, 2026
- Closing price
- 282.50 $ -2.70%
- Market Capitalisation
- 8.6 $B
- P/E
- 27.0
- Growth Score
- 4/10
- AAQS
- 7/10
Price change since August 21, 2026: -28.1%
This analysis has a cut-off date. The Stock Guard tells you when something material changes in the numbers. Reserve your free spot
Chart
Interactive price chart (TradingView).
52-week range: 266.80 $ to 535.20 $ · Last price: 282.50 $ (As of: October 7, 2026)
Note: pure fact-based analysis, not investment advice and not a solicitation to buy or sell. All figures without guarantee.
There's a trick photographers use to fuse two entirely different shots into one image — call it the photomontage trap. From a distance, the result looks like a single, continuous landscape. Only up close do you spot the seam: different light on the left, a different shadow on the right, two exposures that happen to line up. That same picture comes to mind when you look at the revenue curve of Dycom Industries, Inc. (NYSE: DY). From a distance, it's one continuous jump — 56.1 percent growth in the most recent quarter. Get closer, into the segment numbers in the original filings with the U.S. securities regulator, the SEC, and you find the seam: one part of the picture is decades-old fiber-construction business; the other part is eight months old and bought with borrowed money.
So let's make a deal. Before you mistake an acquisition for an acceleration, let's read together what Dycom actually reported to the SEC: the annual report (10-K) for fiscal 2026 and the quarterly report (10-Q) for the first quarter of fiscal 2027 — the most recent filing available as of this research. By the end, you'll know which part of the curve is genuinely new and which part is just repackaged.
What Dycom actually does
Dycom is a large-scale skilled trade business. The company digs trenches, splices fiber, copper and coaxial cable, builds cell towers and maintains the connections that get American households and businesses online. Its customers are the biggest names in U.S. telecom: AT&T, Verizon, Lumen Technologies and Comcast engage Dycom through multi-year "master service agreements" — standing work orders under which the customer doesn't commit to a fixed volume but calls off individual tasks as needed. One central growth driver is fiber-to-the-home: instead of stopping at the curbside cabinet, the last stretch of cable is run all the way into your living room — a build-out that has been running for years across the U.S. and is further boosted by federal rural broadband funding programs.
On December 23, 2025, a second leg was added: for total consideration of $2,008.7 million, Dycom acquired Power Solutions, LLC, a provider of electrical, energy-management, security and fire-safety systems for data centers in the greater Washington D.C./Maryland/Virginia area. Overnight, that created a brand-new segment called Building Systems — Dycom's bet on the construction boom around AI data centers, the same story currently driving half of Wall Street. The 10-Q frames the logic like this:
"Additionally, with the acquisition of Power Solutions, LLC ('Power Solutions') in the fourth quarter of fiscal 2026, we provide comprehensive building infrastructure solutions, including electrical, energy management, security, and fire safety systems for data centers and other critical facilities."
— Dycom Industries, Inc., SEC quarterly report 10-Q for the first quarter of fiscal 2027, Note 1
Two businesses under one roof, serving overlapping customer books (telecom and data-center developers) — but of very different ages: one has grown over decades, the other is eight months old.
Company history for investors
-
2024
Fiscal 2024 closes at $4.18 billion in revenue
The starting point before the acceleration: solid, single- to low-double-digit growth, AT&T's share still just 16.9 percent.
-
2025
Power Solutions purchase agreement signed (11/18/2025)
The move into data-center construction becomes binding — for shareholders, the first sign of the debt and dilution to come.
-
2025
Power Solutions acquisition closes (12/23/2025)
For $2.0 billion, the new Building Systems segment is born — paid for with $1.6 billion cash, new shares and assumed debt.
-
2026
Fiscal 2026 ends with record revenue (1/31/2026)
$5.55 billion in revenue, up 17.9 percent — but per the annual report, only $389.2 million of that grew organically.
-
2026
AT&T acquires Lumen's mass-markets fiber business (2/2/2026)
Dycom's largest customer gets structurally bigger — an early sign of rising customer concentration for shareholders to watch.
-
2026
Q1 results send the stock up 26 percent (5/27/2026)
The stock reached its previous 52-week high of $566.47 that day.
-
2026
Two new independent directors appointed (8/4/2026)
The board is expanded — a routine governance step with no immediate price relevance for shareholders.
Where the stock showed up in our scanner
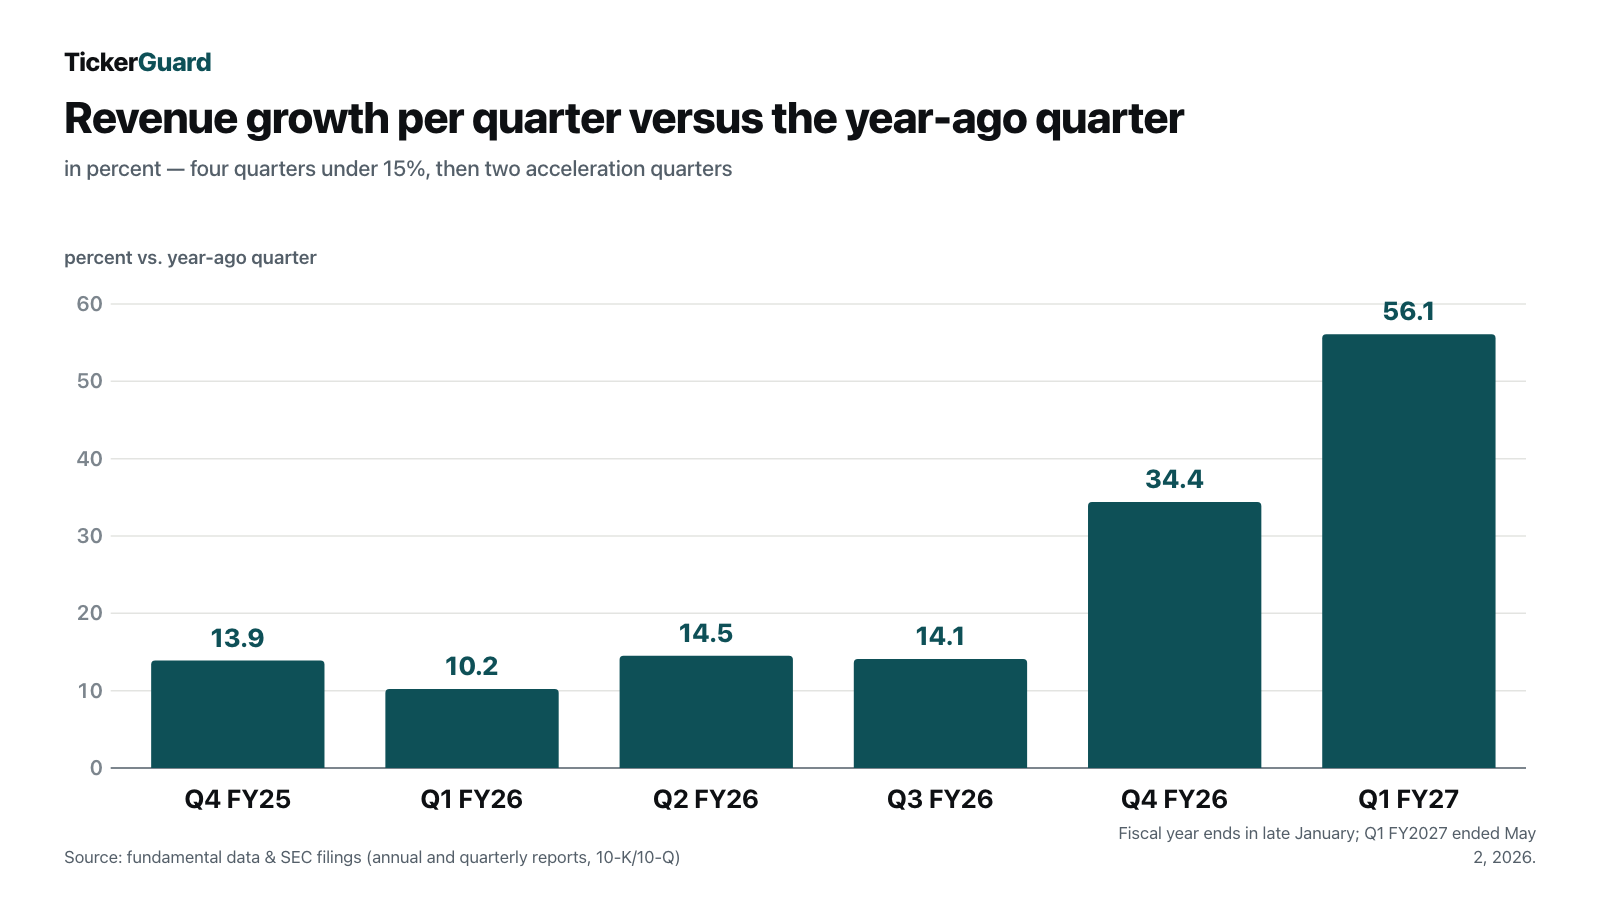
Dycom landed on our desk through our in-house stock scanner "revenue inflection" — rank 3 of 28 hits in the August 24, 2026 run. The logic, briefly: the scanner looks for companies whose revenue grew 30 to 70 percent year over year in at least the two most recent quarters, after four straight quarters of sub-15-percent growth — the idea being that a company just now accelerating has more room to run than one that has been sprinting for years. To keep the find from being a fluke, the scanner also requires a revenue base of at least $100 million over the trailing four quarters, no more than two such acceleration quarters (an early rather than a long-running phase), and no heavy dilution. The companion study crunched the question across more than 13 years and roughly 20,000 signals: companies at the start of a growth story beat established steady growers on average — 16.6 percent versus 9.9 percent per year (more in the revenue inflection backtest study).
Which two quarters does the scanner mean for Dycom specifically? Our own recalculation from the original SEC-reported figures gives a clear picture: across the four quarters from late January 2025 through late October 2025, revenue grew between 10.2 and 14.5 percent year over year each time — solid, but well under the acceleration threshold. Then the picture flipped: in the fourth quarter of fiscal 2026 (ended January 31, 2026), growth jumped to 34.4 percent; in the first quarter of fiscal 2027 (ended May 2, 2026), to 56.1 percent — exactly the two acceleration quarters the scanner is picking up.
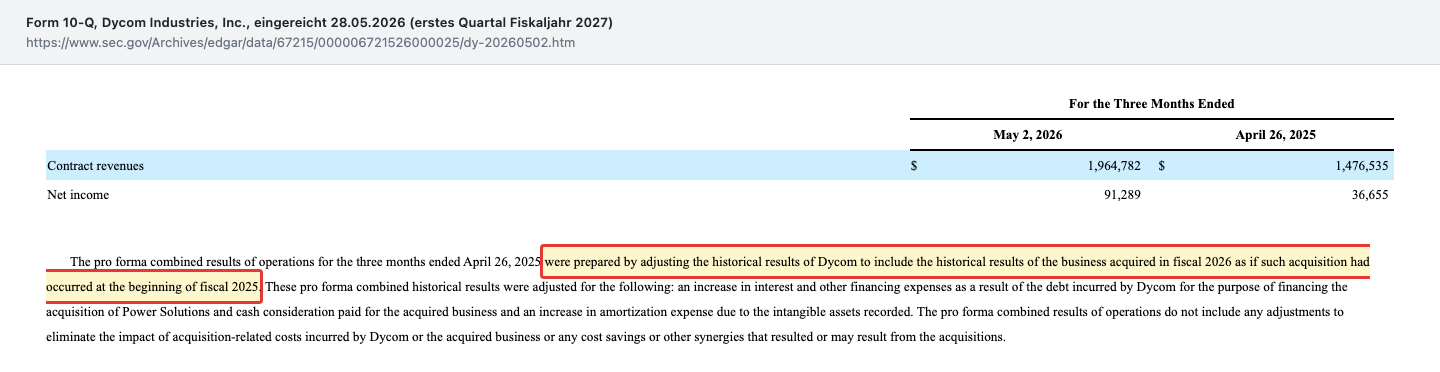
But where does the jump come from? This is where the photomontage starts to show its seam. The 10-Q breaks first-quarter fiscal 2027 revenue down by segment: the legacy Communications segment generated $1,569.4 million — up 24.7 percent from $1,258.6 million a year earlier, and that is organic growth, not a purchase. The new Building Systems segment (Power Solutions) brought in $395.4 million — a year earlier, that segment simply didn't exist, because the acquisition didn't close until December 23, 2025. Roughly one-fifth of the reported $1,964.8 million in total revenue therefore comes from a business that has been part of Dycom for only eight months. The 10-Q also runs a control calculation: had Dycom owned Power Solutions in the year-ago quarter too, the comparison base wouldn't have been $1,258.6 million but $1,476.5 million — and even against that acquisition-adjusted base, the company still grew a solid 33.1 percent.
One more question remains: does every number in the scanner row itself hold up? Two figures stand out on close inspection: a Piotroski score of 1 of 9 points (a nine-point test of balance-sheet health) and a debt-to-equity ratio of 6.84. Both look unusually poor for a company with positive earnings and a growing operating business — and recalculating from the SEC balance-sheet data confirms part of that suspicion. From the fiscal 2025 and fiscal 2026 annual reports, at least four of the nine Piotroski sub-criteria can clearly be verified as passing: positive net income ($281.2 million), positive operating cash flow ($642.5 million), operating cash flow exceeding net income (a quality-of-earnings signal), and an improved gross margin (cost of earned revenues fell from 80.2 to 79.4 percent of revenue). A score of 1 of 9 looks too low. At the same time, it's true that several other sub-criteria — leverage, liquidity ratio, share count, asset turnover — genuinely turned negative because of the debt-funded Power Solutions deal: a one-off effect of a single large acquisition, not a sign of deteriorating operating quality. The 6.84 debt-to-equity figure, however, simply doesn't reconcile with the SEC balance-sheet data: as of May 2, 2026, total debt of $2,998.9 million (including $183.2 million in lease liabilities) stood against equity of $1,895.7 million — a ratio of roughly 1.6, not 6.84. We assume this is a calculation error in the scanner for this particular stock.
One more discrepancy turned up during the research: the scanner row lists "report 8/19" as the most recent reporting date. The SEC's own filing list (submissions JSON, as of August 24, 2026) shows no filing on that date — the most recent document available remains the quarterly report from May 28, 2026. This analysis is therefore built on the actual most recent available filing, not on a supposedly newer report the scanner claims but that cannot be found.
The numbers over the years — honestly appraised
Let's start with what genuinely impresses: Dycom is a company that has grown noticeably over four years without losing profitability along the way. Revenue climbed from $4,175.6 million in fiscal 2024 to $4,702.0 million in fiscal 2025 (up 12.6 percent) to a record $5,545.9 million in fiscal 2026 (up 17.9 percent) — though fiscal 2026 counted 53 weeks instead of the usual 52 because of the calendar cutoff, which slightly skews the year-over-year comparison. Net income rose over the same span from $218.9 million to $233.4 million to $281.2 million, with net margin holding steady around 5 percent. Backlog — the sum of all already-signed but not-yet-completed work — also reached a record $11,906 million as of May 2, 2026 per the earnings press release, up roughly a quarter (+24.8 percent) from $9,542 million just three months earlier at the end of January 2026. For every dollar Dycom billed in the first quarter, well over a dollar of new work came in the door — a signal that the order book supports not just this one quarter but several ahead.
Still, the decisive question remains: how much of this growth is genuinely built, and how much is bought? The fiscal 2026 annual report answers that explicitly for the full year — and this figure carries the growth story of this analysis:
"Contract revenues from acquired businesses were $563.8 million during fiscal 2026 and $109.1 million during fiscal 2025. […] Excluding amounts generated by the acquired businesses, contract revenues increased by $389.2 million during fiscal 2026 compared to fiscal 2025, primarily due to net increases in fiber-to-the-home deployments, including rural fiber deployment programs."
— Dycom Industries, Inc., SEC annual report 10-K for fiscal 2026, "Results of Operations"
Run the math and the picture is clear: of the $843.9 million revenue increase in fiscal 2026, $389.2 million — a bit over 46 percent — came from the existing business, and the rest from the net effect of acquisitions ($563.8 million minus $109.1 million). The chart below shows that bridge from fiscal 2025 revenue to the fiscal 2026 record:
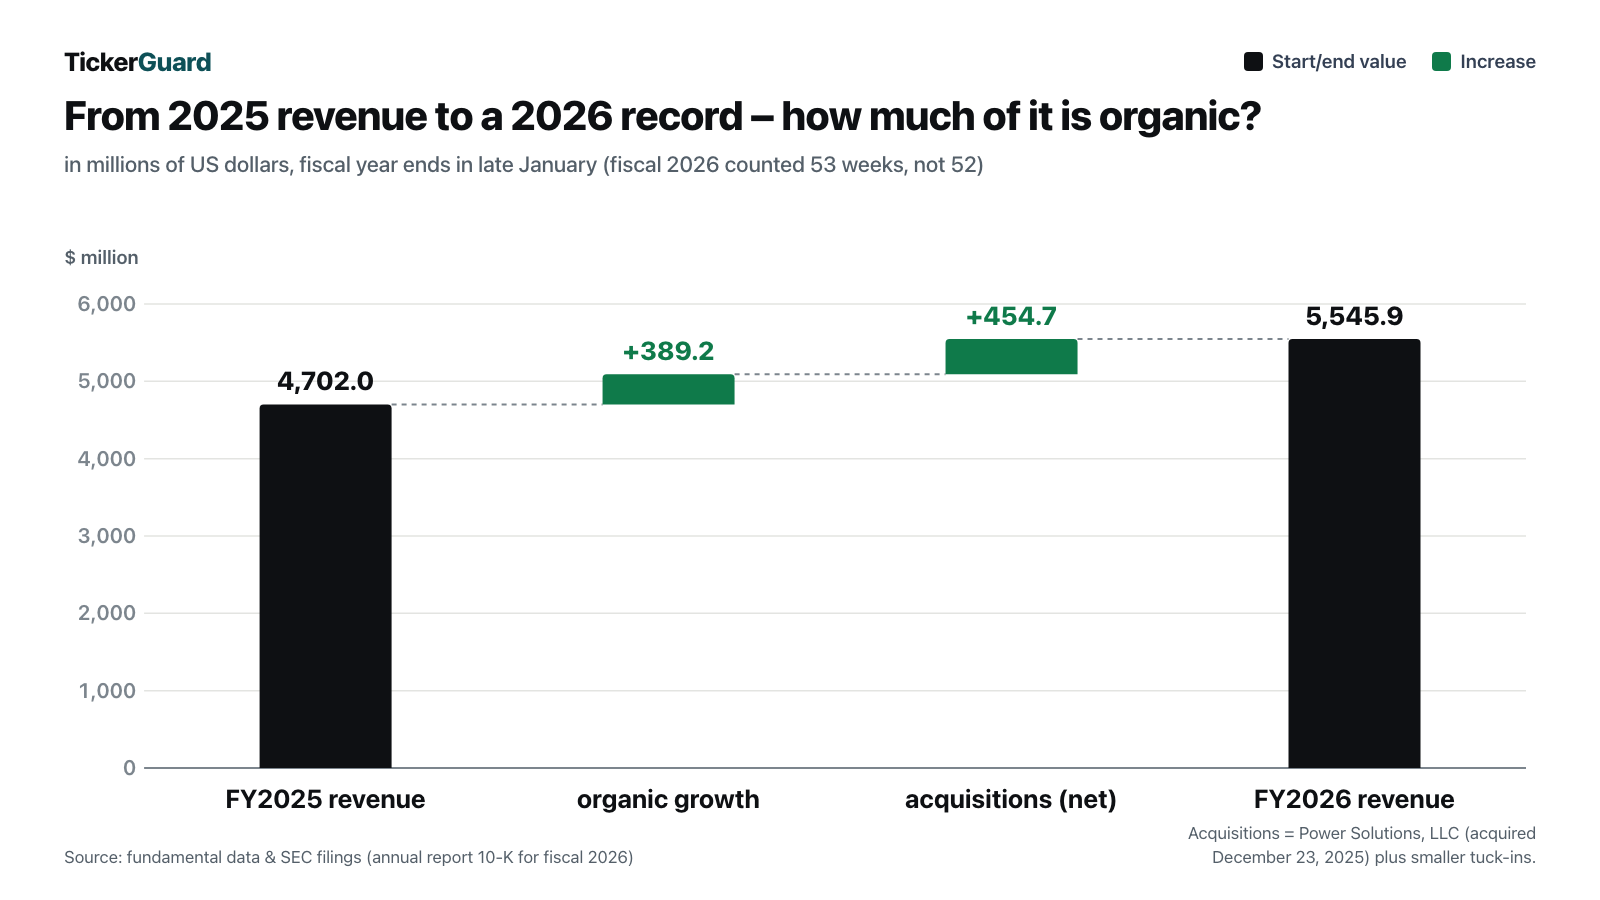
Almost half organic, a bit more than half bought — that's not a bait-and-switch, but it's not a pure success story of the core business either. Read "17.9 percent revenue growth" and picture an organically accelerating construction company, and you're only seeing half the picture.
What the filings say — the uncomfortable truths
Uncomfortable truth No. 1: one-fifth of the latest growth spike is bought, not built. As shown above, roughly 20 percent of consolidated revenue in the first quarter of fiscal 2027 came from the eight-month-old Building Systems segment. That's not a manipulation — Dycom discloses it cleanly, segment by segment, in the 10-Q — but it means whoever reads only the headline "up 56.1 percent" substantially overstates the pace of the core business. The Communications segment's organic growth of 24.7 percent is impressive on its own; it doesn't need the acquisition to stand out.
Uncomfortable truth No. 2: the customer base is highly concentrated, and getting more so. The annual report lists three customers each above 10 percent of revenue in fiscal 2026:
"During fiscal 2026, we derived approximately 25.4% of our total contract revenues from AT&T Inc., 14.0% from Verizon Communications, Inc. and 10.8% from Lumen Technologies Inc."
— Dycom Industries, Inc., SEC annual report 10-K for fiscal 2026, Item 1 "Business"
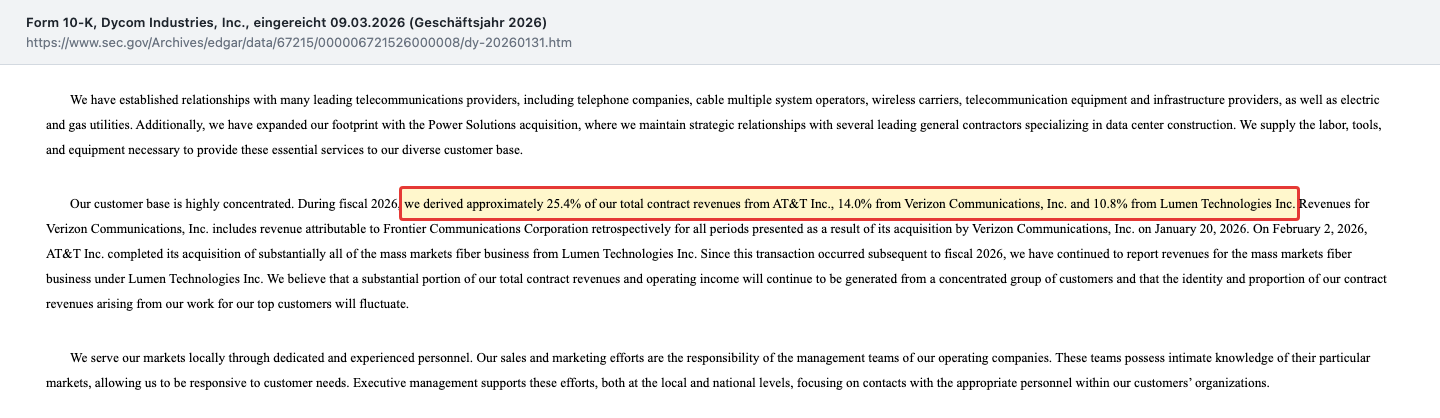
Picture a neighbor telling you proudly that his contracting business is booming — then you learn a quarter of his revenue comes from one single client who could switch suppliers at any time. Would you wince a little? That's Dycom's position with AT&T: its share rose from 16.9 percent in fiscal 2024 to 20.1 percent in fiscal 2025 to 25.4 percent in fiscal 2026 — a meaningful rise in a short time. On February 2, 2026, shortly after fiscal 2026 closed, AT&T also acquired Lumen's mass-markets fiber business, which tends to push Dycom's dependence on a single customer even higher going forward.
Uncomfortable truth No. 3: the acquisition was funded mostly with fresh debt and new shares. The 10-Q breaks down the financing of the Power Solutions deal:
"At the closing date, the funding of the acquisition included a cash payment of $1,644.9 million ($1,628.6 million net of cash acquired of $16.3 million), the issuance of 1,011,069 shares of Dycom common stock to the sellers valued at $351.0 million, and the assumption of seller indebtedness of $64.8 million."
— Dycom Industries, Inc., SEC quarterly report 10-Q for the first quarter of fiscal 2027, Note 5 "Acquisitions"
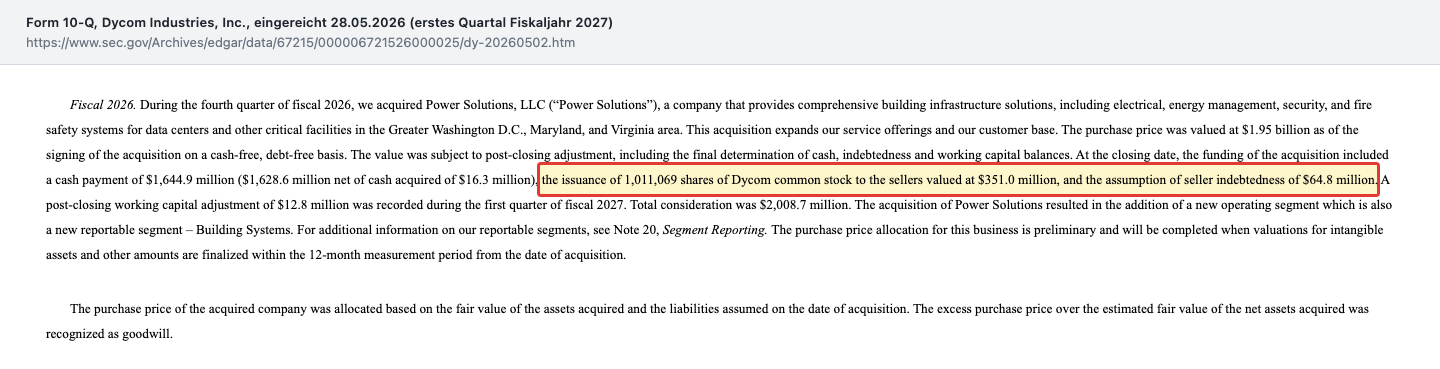
Dilution means your slice of the pie shrinks every time fresh slices get cut — and that's exactly what happened here, on a small scale. The bigger effect is leverage: total debt (including lease liabilities) rose from about $1,056.0 million as of January 25, 2025, to about $2,998.9 million as of May 2, 2026 — of the latter figure, $2,815.7 million was financial debt ($6.0 million current, $2,809.7 million long-term) and $183.2 million was long-term lease liabilities ($44.8 million current, $138.4 million long-term) — nearly a tripling in 15 months, financed in part through a $600 million, 364-day bridge loan established on December 23, 2025 (refinanced on January 27, 2026 by a new $800 million Term Loan B) and an increase of the existing Term Loan A facility from $440.0 million to $1,540.0 million. By comparison, equity of $1,895.7 million stayed noticeably smaller than debt — remember the mechanism: financing a $2 billion acquisition mostly with borrowed money doesn't make the risk disappear, it shifts it into the future, in the form of interest and principal payments. The credit agreement caps net leverage at 4.5 times EBITDA through the end of the first fiscal quarter after the deal's second anniversary (roughly early 2028), then drops the cap to 4.0 times; as of May 2, 2026, that ratio worked out — on our own approximation from net debt and trailing-twelve-month EBITDA — to roughly 3 — within the limit, but with noticeably less cushion than before the acquisition. Still, despite the higher debt load, the operating business stayed solid, and full-year fiscal 2026 operating cash flow ($642.5 million) came in well above the prior year ($349.1 million) — the first quarter itself, seasonally usually the weakest of the year, again posted negative operating cash flow of $24.6 million, though that was an improvement on the $54.0 million outflow in the year-ago quarter.
Valuation: what the market pays for Dycom today
The market has already heard the growth story — and partly walked it back. On May 27, 2026, the day of the first-quarter fiscal 2027 results, the stock jumped from $420.47 (prior-day close) to $529.13, a roughly 26 percent one-day gain; intraday, it touched a new 52-week high of $566.47. By August 21, 2026, the last trading day before this analysis closed, the stock had come back down to $392.95 — about 31 percent below that high and slightly below where it stood before the earnings-day spike. A trailing twelve-month price-to-earnings ratio of about 37.6 (or about 31.2 on forward estimates) is anything but cheap for a construction contractor with net margins around 5 percent — for comparison, a price-to-sales ratio of about 1.9 and a price-to-book ratio of about 6.2 already price in a meaningful share of future growth.
The professionals' view is upbeat: nine analysts rate the stock at an average of 4.9 out of 5 (eight "strong buy", one "buy", no sell ratings) with a mean price target of $637.27 — about 62 percent above the August 21, 2026 close. But the same analysts had already assigned the stock a target well above its then-current level before the quarterly results, and the price has swung more sharply in both directions since than the business alone would explain. A PEG ratio (price-to-earnings divided by expected earnings growth) of about 3.5 signals that even measured against strong earnings growth, this stock is no bargain. This is already a well-followed stock, not an overlooked one — leaving correspondingly little margin for error should the Power Solutions integration stumble or customer concentration become a real problem.
Opportunities and risks at a glance
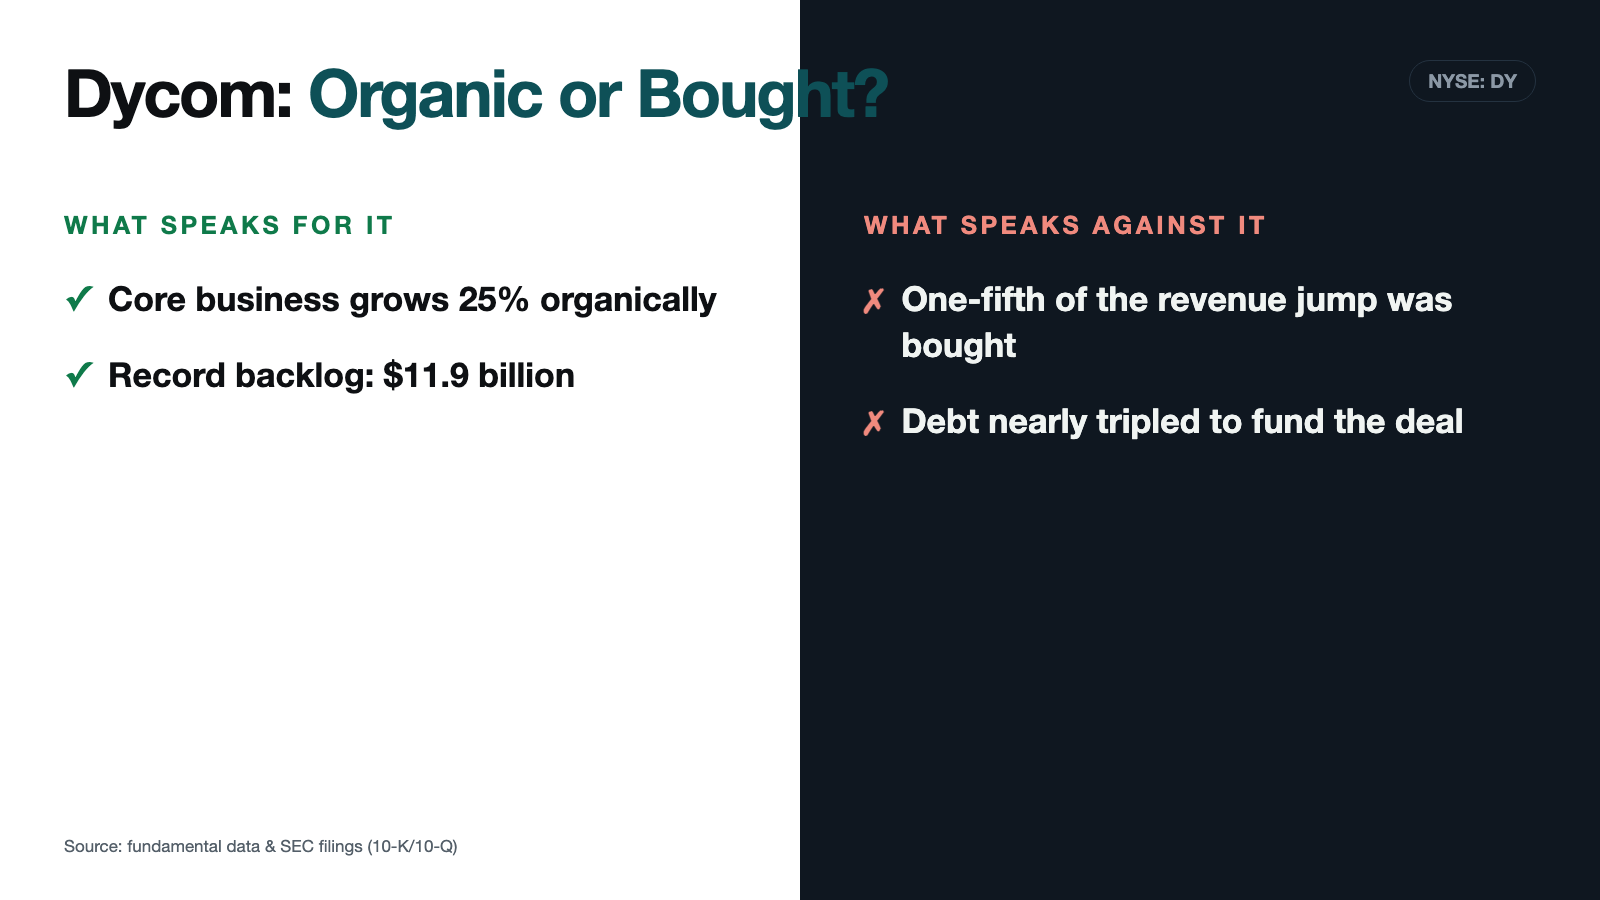
What speaks for Dycom:
- Organic growth of 24.7 percent in the core Communications business (first quarter fiscal 2027) — carried by the structural fiber-to-the-home build-out, independent of the acquisition.
- Record backlog of $11.9 billion as of May 2, 2026, up roughly a quarter (+24.8 percent) from just three months earlier — a strong signal for the coming quarters.
- A second leg (Building Systems) with a 17.7 percent non-GAAP Adjusted EBITDA margin in the first quarter — higher than the core Communications business's 12.3 percent — and direct exposure to the data-center boom, without starting from zero.
- Despite higher debt, interest expense ($35.5 million in the latest quarter, up from $14.0 million a year earlier) stayed well below pre-tax income ($106.7 million), plus a markedly higher full-year operating cash flow.
What speaks against it:
- Roughly one-fifth of the latest revenue jump comes from an eight-month-old acquisition — not proof of sustainable organic acceleration at the same pace.
- Rising customer concentration: AT&T alone accounted for more than a quarter of revenue in fiscal 2026, and the trend is still climbing.
- Total debt has nearly tripled in 15 months; the cushion against the credit-agreement covenant has shrunk.
- An ambitious valuation (P/E around 37.6) that already prices in much of the good news — leaving little room for disappointment.
A human conclusion
Back to the photomontage from the opening. Seen from a distance, Dycom's growth curve looks flawless: four calm quarters, then two with sharp acceleration — exactly the pattern the scanner is built to find. Only up close do you see the seam — and here, the seam isn't a fake, it's an honest fact documented in the fine print: part of the picture is decades-old fiber-construction business, and another part is eight months old and paid for with borrowed money. Both can be true at once without either canceling the other out — an organically growing core business plus an ambitious, debt-funded bet on the data-center boom. Whether that combination is attractive to you depends on how much trust you place in the integration of a $2 billion acquisition, and how much customer concentration you're willing to carry alongside it. What you make of it is your decision. And that is exactly as it should be.
Sources
SEC annual report 10-K for fiscal 2026, filed 2026-03-09: sec.gov. SEC quarterly report 10-Q for the first quarter of fiscal 2027, filed 2026-05-28: sec.gov. SEC Form 8-K dated 2026-05-27 (first-quarter fiscal 2027 earnings release, with press release): sec.gov. SEC Form 8-K dated 2026-08-04 (new director appointments): sec.gov. Study "Revenue Inflection Backtest": revenue inflection backtest study.
This analysis is a journalistic contextualization of publicly available information and is not investment advice or a solicitation to buy or sell securities. Buying stocks carries the risk of a total loss. Positions held by the operator are disclosed daily; where one exists, it appears as a notice at the top of this deep dive.
Key figures at a glance
All monetary figures in millions of $; earnings per share as reported.
| Metric | 2022 | 2023 | 2024 | 2025 | 2026 |
|---|---|---|---|---|---|
| Revenue | 3,130.5 | 3,808.5 | 4,175.6 | 4,702.0 | 5,545.9 |
| Operating Income (EBIT) | 81.6 | 210.5 | 323.0 | 340.5 | 694.6 |
| Net Income | 48.6 | 142.2 | 218.9 | 233.4 | 281.2 |
| Net Margin | 1.6% | 3.7% | 5.2% | 5.0% | 5.1% |
| Earnings Per Share | 1.57 $ | 4.74 $ | 7.37 $ | 7.92 $ | 9.56 $ |
Source: fundamental data & SEC filings (annual and quarterly reports, 10-K/10-Q)
Our Bottom Line at a Glance
- Organic core business positive
- The legacy Communications segment grew 24.7 percent on its own in the first quarter of fiscal 2027 (May 2, 2026), driven by the fiber-to-the-home build-out. That is not an acquisition effect — it is genuine new business.
- Growth quality negative
- Roughly one-fifth of the latest revenue jump ($395.4 of $1,964.8 million in Q1 fiscal 2027) came from the December 2025 Power Solutions acquisition, not the existing business. The scanner does not distinguish between built and bought growth.
- Customer concentration negative
- AT&T Inc. alone accounted for 25.4 percent of revenue in fiscal 2026, up from 16.9 percent two years earlier. Combined with Verizon (14.0%) and Lumen (10.8%), more than half of revenue came from three telecom carriers.
- Balance sheet & leverage neutral
- To pay for Power Solutions, total debt (including lease liabilities) rose from about $1.06 billion to about $3.0 billion (late January 2025 through May 2, 2026); debt-to-equity sits around 1.6 — far more solid than the scanner's implausible 6.84, but a real jump with less covenant cushion than before.
- Order book positive
- Total backlog climbed to a record $11.9 billion as of May 2, 2026 per the earnings press release — up roughly a quarter (+24.8 percent) from the end of January 2026.
- Valuation neutral
- At a price-to-earnings ratio of about 37.6 (as of August 21, 2026), the stock is anything but cheap — even after giving back about 31 percent from its 52-week high ($566.47, May 27, 2026).
Dycom delivers a genuine organic acceleration signal in its core business — up 24.7 percent in the most recent quarter, carried by fiber and data-center build-out — but dilutes that picture itself: one-fifth of reported growth came via checkbook, not from the trench, funded with nearly tripled debt and fresh shares. A record backlog and strong margins sit alongside rising customer concentration and an ambitious valuation. Not investment advice.
What Our Rating Means
Open questions
The business works in principle, but one material question is open. As long as it stays open, our findings do not carry a quality verdict.
The core business is healthy and growing organically at a strong clip — that speaks to substance. What remains open is whether the roughly $2 billion, debt-funded Power Solutions acquisition delivers the promised synergies, whether the tripled debt load gets paid down on schedule, and how much the growing dependence on AT&T, Verizon and Lumen weighs in the next downturn. None of these is a substance risk in the sense of insolvency — interest expense ($35.5 million in the latest quarter) stayed well below pre-tax income ($106.7 million), and cash of $538.8 million is solid — but each of them decides whether this scanner find becomes more than a one-time snapshot. The decision is yours.
A journalistic assessment by our editorial team at the time of the deep dive, based on public sources — not investment advice and not a solicitation to buy or sell. Your personal circumstances (investment goals, risk capacity, taxes) cannot be taken into account. What our levels mean, how verdicts are formed, and what conflicts of interest exist →
Worth Noting
- Dycom landed on our research list through our in-house "revenue inflection" scanner (rank 3 of 28 hits, as of August 24, 2026).
- The scanner's Piotroski score of 1 of 9 looks too low against the SEC figures — at least four of the nine sub-criteria (positive net income, positive operating cash flow, operating cash flow exceeding net income, improved gross margin) should count as passing on our own recalculation. The balance sheet's acquisition-driven jump in size does genuinely push several balance-sheet-based sub-criteria negative — a one-off effect of the deal, not a sign of deteriorating operating quality.
- The scanner's debt-to-equity figure of 6.84 also doesn't reconcile with our own calculation from the SEC balance-sheet data: total debt (including lease liabilities) to equity stood at roughly 1.6 as of May 2, 2026.
- The "report 8/19" date the scanner cites could not be confirmed in the SEC filing list (as of August 24, 2026); the actual most recent available filing is the quarterly report dated May 28, 2026, which this analysis is built on.
- All valuation and price figures are evergreen and carry a data cutoff; a daily price is not a buy argument.
Stock Watch
This analysis is as of August 26, 2026. Stock Watch will tell you what's changed at DY since then.
Later $1 a month per stock — signing up is free, and you'll be the first to know when it launches.
The full analysis as a PDF for later
We will send you this analysis as a PDF — to print, file away, and read at your own pace. And we will add you to the free Stock Watch list for Dycom Industries Inc (DY), so you hear about it when something material in this analysis changes.
Frequently Asked Questions
Dycom (NYSE: DY) is a specialty contractor that plans, builds and maintains fiber and cable infrastructure for major U.S. telecom carriers such as AT&T, Verizon, Lumen and Comcast — mostly under the fiber-to-the-home build-out. Since acquiring Power Solutions, LLC on December 23, 2025, Dycom also operates the Building Systems segment: electrical, energy and security systems for data centers.
Because revenue accelerated sharply in the two most recent quarters (34.4 percent in the fourth quarter of fiscal 2026, 56.1 percent in the first quarter of fiscal 2027) after four straight quarters of 10-to-15-percent growth — exactly the pattern the scanner looks for. As of August 24, 2026, Dycom ranked 3 of 28 hits.
For fiscal 2026, the annual report explicitly attributes $389.2 million of the $843.9 million total revenue increase to the existing business — just under 46 percent. In the first quarter of fiscal 2027, $395.4 million of $1,964.8 million in revenue (roughly a fifth) came from the newly acquired Building Systems segment; the core Communications business grew organically by 24.7 percent on its own.
On December 23, 2025, Dycom closed its acquisition of Power Solutions, LLC, a data-center building-systems provider, for total consideration of $2,008.7 million. Per the 10-Q, funding included a $1,644.9 million cash payment ($1,628.6 million net of $16.3 million cash acquired), 1,011,069 new Dycom shares valued at $351.0 million, and $64.8 million in assumed seller debt; a post-closing working-capital adjustment of $12.8 million brought total consideration to the final $2,008.7 million.
Heavily, and increasingly so: in fiscal 2026, the annual report shows 25.4 percent of revenue came from AT&T, 14.0 percent from Verizon and 10.8 percent from Lumen Technologies — more than half combined. AT&T's share alone climbed from 16.9 percent in fiscal 2024 to 25.4 percent two fiscal years later.
No. The 10-Q states that Dycom intends to retain earnings for use in the business and other capital-allocation strategies, including further acquisitions, and does not anticipate paying cash dividends in the foreseeable future. The dividend yield stood at 0.0 percent as of August 21, 2026.
No — our own recalculation from the SEC balance-sheet data shows that figure is too high. As of May 2, 2026, total debt of $2,998.9 million (including $183.2 million in lease liabilities) stood against equity of $1,895.7 million, a ratio of roughly 1.6, not 6.84. Debt did rise materially because of the Power Solutions deal — just not to the degree the scanner shows.
Dycom's fiscal year ends on the last Saturday of January. Fiscal 2026 ran from January 26, 2025, through January 31, 2026, and — because of that calendar cutoff — counted 53 weeks instead of the usual 52, an effect the annual report explicitly flags when discussing year-over-year comparisons.
Found an error?
Did you spot a factual error, an outdated number, or a typo in this deep dive? Let us know briefly — your report goes straight to the editorial team.