Syntec: When Every Quarter Beats the Last One
Revenue up 107 percent, net income up 217 percent year over year — at Syntec Technology, one record quarter is chasing the next, and it is tempting to simply draw that line straight into the future. We read the investor conference, the capital moves and the quarterly figures of the Taiwanese CNC-controller maker: part of the boom is real and documented — but the valuation now rests on just one or two analyst estimates, and several numbers raise more questions than the available sources answer. Not investment advice.
 Thomas Mücke
Founder & Publisher
Thomas Mücke
Founder & Publisher
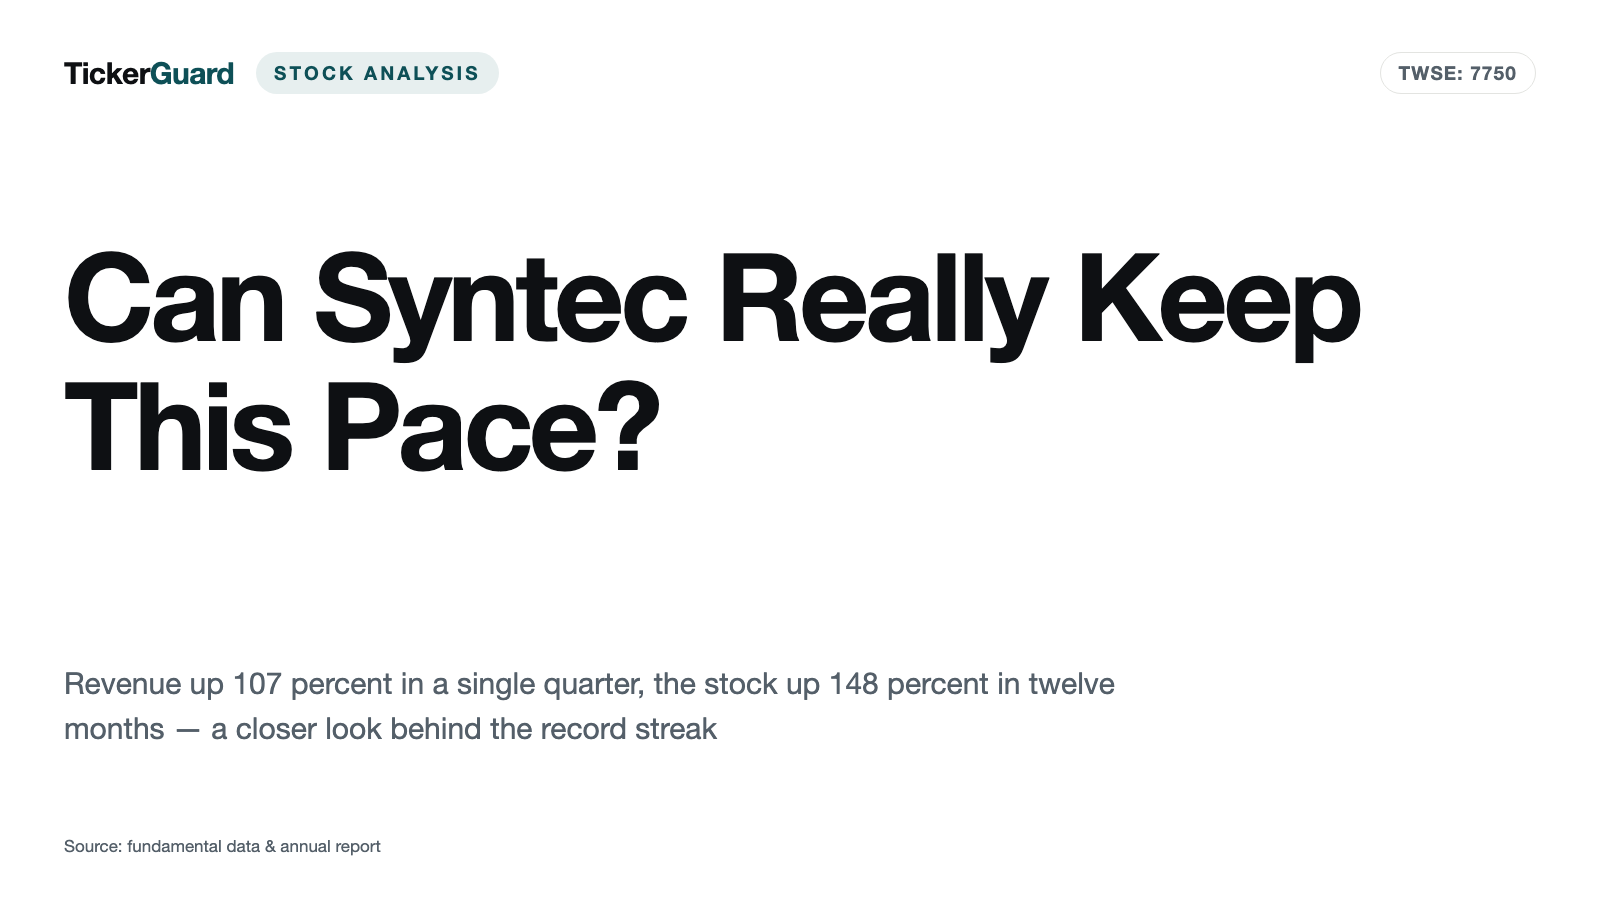
Extrapolation bias — the tendency to mentally draw the most recent trend in a straight line into the future — is one of the most reliable traps in investing. It bites hardest when the numbers themselves are spectacular: Syntec Technology, a Taiwanese maker of CNC controllers for machine tools, reported on Aug. 5, 2026 second-quarter revenue of TWD 8.26 billion — up 107 percent year over year — and net income of TWD 1.90 billion, up 217 percent. A quarter that more than doubles revenue and more than triples profit practically invites you to keep drawing that line. Before doing so, it is worth reading the investor conference, the capital moves, and the quarterly series itself — because not every number in this story explains itself. All figures in this analysis are evergreen and carry their own reference date; the price of TWD 2,300 serves only as a valuation anchor as of Aug. 28, 2026.
What Syntec Actually Does
Every machine tool — a lathe, a mill, a laser system — needs a "brain" that computes motion in real time and drives the motors. Syntec Technology, founded in Hsinchu in 1995, makes exactly that brain: CNC controllers and servo drives (together roughly 95 percent of revenue per a company-profile database, split roughly 48 percent controllers and 47 percent servo products, the rest smart-manufacturing solutions, as of 2025), plus, through subsidiary Jumbo, laser cutting and welding systems, and, through Leantec (founded 2018), robotics and automation solutions for factory floors. The official Taiwan Stock Exchange company profile describes the core strategy as "AI Empowerment + Intelligent Robots" — combining artificial intelligence with manufacturing technology to drive smart controllers, robots and cloud platforms.

Chairman and general manager Tsai You-keng spent eight years at the state-run Industrial Technology Research Institute (ITRI) before building Syntec — in a company profile piece he describes that period himself: "工研院對我來說很像少林寺" ("ITRI was like the Shaolin Temple to me"), a nod to a tough, formative training ground. Per the company's own history, Tsai recognized early that Taiwan's home market was too small to sustain export-scale business and pushed into China starting in 2003 — still, per management's own statement at the May 22, 2026 investor conference, by far the company's most important market today.
Competitively, Syntec faces off against much larger, established players: Fanuc and Mitsubishi Electric from Japan, Siemens and Heidenhain from Germany. Press reports put Syntec's share of China's high-end CNC controller market above 15 percent (Vocus finance blog, March 13, 2025) or, more broadly, at 20 to 25 percent (tw.stock.yahoo.com, Nov. 21, 2025) — ranking third behind Fanuc and Siemens. Broken down by end market, the May 22, 2026 investor conference put roughly 30 percent of applications in automotive manufacturing and parts, roughly 25 percent in general machinery and mold-cutting applications, and roughly 15 percent in 3C electronics (consumer, computer, communication), with the rest spread across hardware, wind energy and other sectors. Asked the same question, management also said software is 100 percent developed in-house and that core hardware components (mainboards, axis-control boards, communication boards) are proprietary designs too — only chips and passive components are bought externally. If you know a similar Taiwanese industrial-automation supplier already: we previously covered Jentech Precision, a cooling-hardware supplier riding the same AI-hardware wave — another business with a fast-growing new segment sitting next to an older core business, just a different product.
Company history for investors
-
1995
Founded in Hsinchu
Tsai You-keng founds Syntec after eight years at state research institute ITRI — the starting point of a company now listed on the TWSE.
-
2003
Entry into the Chinese market
With Taiwan's home market too small for export-scale business, Syntec makes China its most important market — a position that holds today.
-
2018
Robotics subsidiary Leantec founded
Syntec expands beyond pure controllers into robotics and automation solutions for factory floors.
-
2024
Debut on the Emerging Stock Market
The stock trades publicly for the first time on June 18, 2024, opening at TWD 153.
-
2025
Capital increase ahead of the full listing
In September 2025, Syntec raises roughly TWD 4.79 billion through 6.32 million new shares priced at a provisional TWD 630.
-
2025
Full listing on the TWSE
On Sept. 17, 2025, Syntec moves from the Emerging Market to the main Taiwan Stock Exchange, opening at TWD 919.
-
2026
Fifth five-year plan launched
Management unveils a new 2026–2030 strategic plan and guides toward doubling revenue from 2024 to 2026.
Where This Stock Landed On Our Desk
The trigger for this analysis is the sheer force of the latest numbers: a quarter with more than double revenue and more than triple profit year over year, following an already outstanding first quarter of 2026 (revenue up 49.5 percent, profit up 123.0 percent). Jumps like that create exactly the bias this analysis is named after: the quiet assumption that a trend this steep simply continues. We wanted to know what stands behind the record quarters — and what in the numbers themselves remains unexplained.
The Numbers Over the Years
Syntec's revenue did not move in a straight line between 2021 and 2025: from TWD 8.95 billion (2021) through a decline to TWD 7.27 billion (2022, down 18.8 percent) and a recovery to TWD 7.87 billion (2023), growth then accelerated sharply — to TWD 10.81 billion (2024, up 37.3 percent) and TWD 13.96 billion (2025, up 29.2 percent). Net income followed the same pattern with an even sharper dip: from TWD 941 million (2021) to TWD 537 million (2022, down 43.0 percent), then a recovery to TWD 651 million (2023), TWD 1.37 billion (2024, more than doubled) and TWD 2.28 billion (2025). Anyone who only looks at the last two years sees an unbroken success story; anyone who looks further back sees a cyclical machine-tool business that only entered a structurally different growth phase starting in 2024.
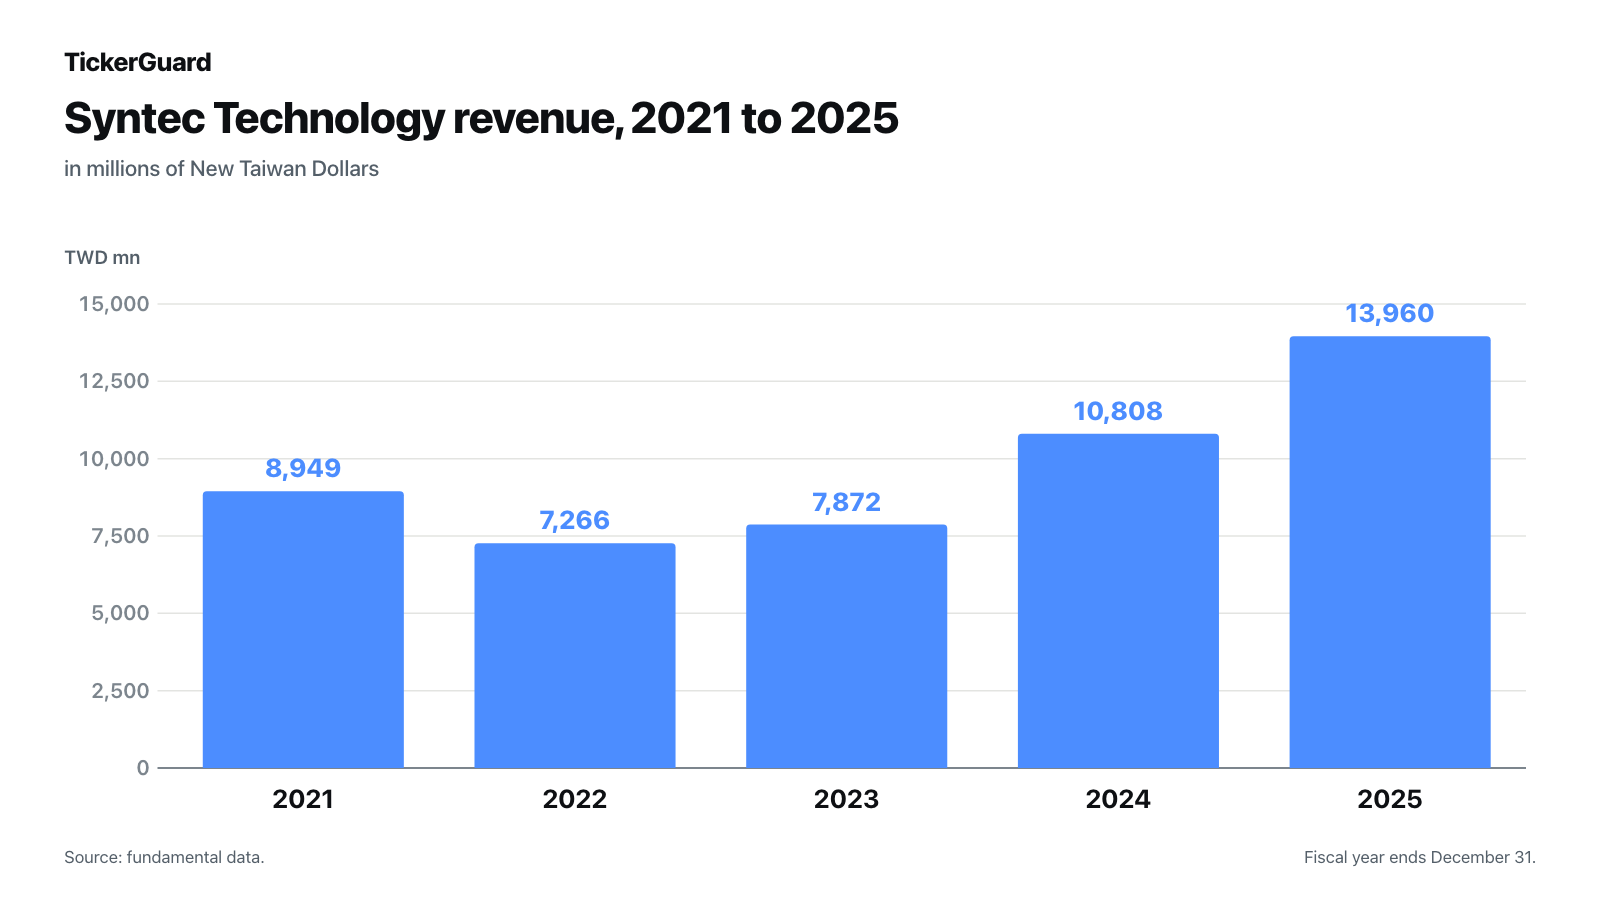
The pace accelerated further in the first half of 2026: TWD 4.86 billion revenue in Q1 (up 49.5 percent year over year, EPS TWD 15.38, up 123.0 percent), TWD 8.26 billion in Q2 (up 107.4 percent, EPS TWD 26.41, net income up 216.6 percent). Combined, Syntec generated roughly TWD 13.12 billion in revenue in the first half of 2026 alone — only about 6 percent short of the entire 2025 fiscal year. The balance sheet as of June 30, 2026 shows a company that kept pace: total assets TWD 24.57 billion, equity TWD 13.45 billion (own calculation: roughly a 54.7 percent equity ratio), cash of TWD 7.22 billion against essentially no long-term and only TWD 465 million of short-term bank debt — a net cash position of roughly TWD 6.48 billion. Free cash flow in 2025 was TWD 2.02 billion (operating cash flow of TWD 2.77 billion minus capital expenditure of TWD 750 million, which rose roughly fourfold versus 2024 — a sign of capacity expansion).
What the Investor Conference Shows
An honest note upfront: for Syntec, there are no publicly available, official verbatim transcripts of analyst calls — an automated check of our transcript database (command transcripts:sync --tickers=7750.TW --backfill=12, as of Aug. 31, 2026) found zero entries. Instead, we reviewed an AI-assisted summary of the public investor conference held May 22, 2026 covering first-quarter results, published by a financial writer specializing in Taiwanese earnings calls (vocus.cc) — with the source itself explicitly noting that the official filing in Taiwan's mandatory disclosure system, MOPS, is authoritative for binding figures (the original presentation exists there as a PDF, but a file-compression error prevented us from extracting it programmatically in this research). That is a weaker evidence chain than an official transcript — we flag that deliberately rather than gloss over it. The summary does, however, include a question-and-answer section that reveals more about the business than the prepared metrics alone.
Asked what is driving the strong growth, management said, per the summary, that it is not one-off stockpiling but structurally strong demand for high-end controllers across five core areas — chiefly AI-server liquid cooling and robotics — combined with high customer stickiness: once a customer switches to Syntec controllers, they rarely switch back. Asked about the drivers of market-share gains, management explicitly named competitor Fanuc, whose lead times now exceed 90 days — customers who could not be served, management said, switched to Syntec instead.
「轉單主要來自替換高端產品的需求。競爭對手 FANUC 目前交期超過 90 天,客戶因缺貨而轉向新代。」
— Management answer, investor conference of May 22, 2026, as quoted by the summary published at vocus.cc, June 4, 2026 ("Order shifts mainly stem from demand replacing high-end products. Competitor Fanuc's lead times currently exceed 90 days — customers are switching to Syntec because of the shortage.")
Asked the obvious follow-up — how dependent the business is on China — management did not give a figure but pointed to geographic diversification: Leantec's robotic-arm and cloud revenue grew 40 to 50 percent in the first five months of 2026, Turkey and Malaysia are developing steadily, while India is progressing more slowly than planned because of the US-Iran conflict; a new plant in Malaysia is expected to better support India and Turkey logistically starting in 2027.

On its own AI positioning, the company also said at the conference that it is developing AI-embedded CNC controllers together with universities, applying AI to parameter optimization, tool-wear prediction, breakage monitoring and thermal-drift compensation — more on that in the next section, since the same statement is also the core of this analysis's company-specific AI classification.

What the Numbers Reveal — the Uncomfortable Truths
Uncomfortable truth No. 1: The forward valuation hangs on a single analyst, whose estimate jumped 20 percent in a week
The 2026 EPS consensus estimate (TWD 91.79) comes from just one analyst according to fundamental data; seven days earlier, the same estimate stood at TWD 76.60 — an upward revision of roughly 20 percent within a week. The somewhat more robust 2027 estimate (TWD 112.66) rests on two analysts. The "forward P/E" field supplied in the dataset is unpopulated (value 0) and is therefore not cited; our own calculation against the Aug. 28, 2026 price (TWD 2,300) yields roughly 25 against the 2026 estimate and roughly 20 against the 2027 estimate — both well below the trailing P/E of roughly 39. That gap is the real core of the extrapolation bias here: it assumes the earnings growth of the past two quarters continues, an assumption resting on an unusually narrow set of opinions.
Uncomfortable truth No. 2: Gross margin fell 5.2 points in one quarter — while operating margin hit a new high at the same time
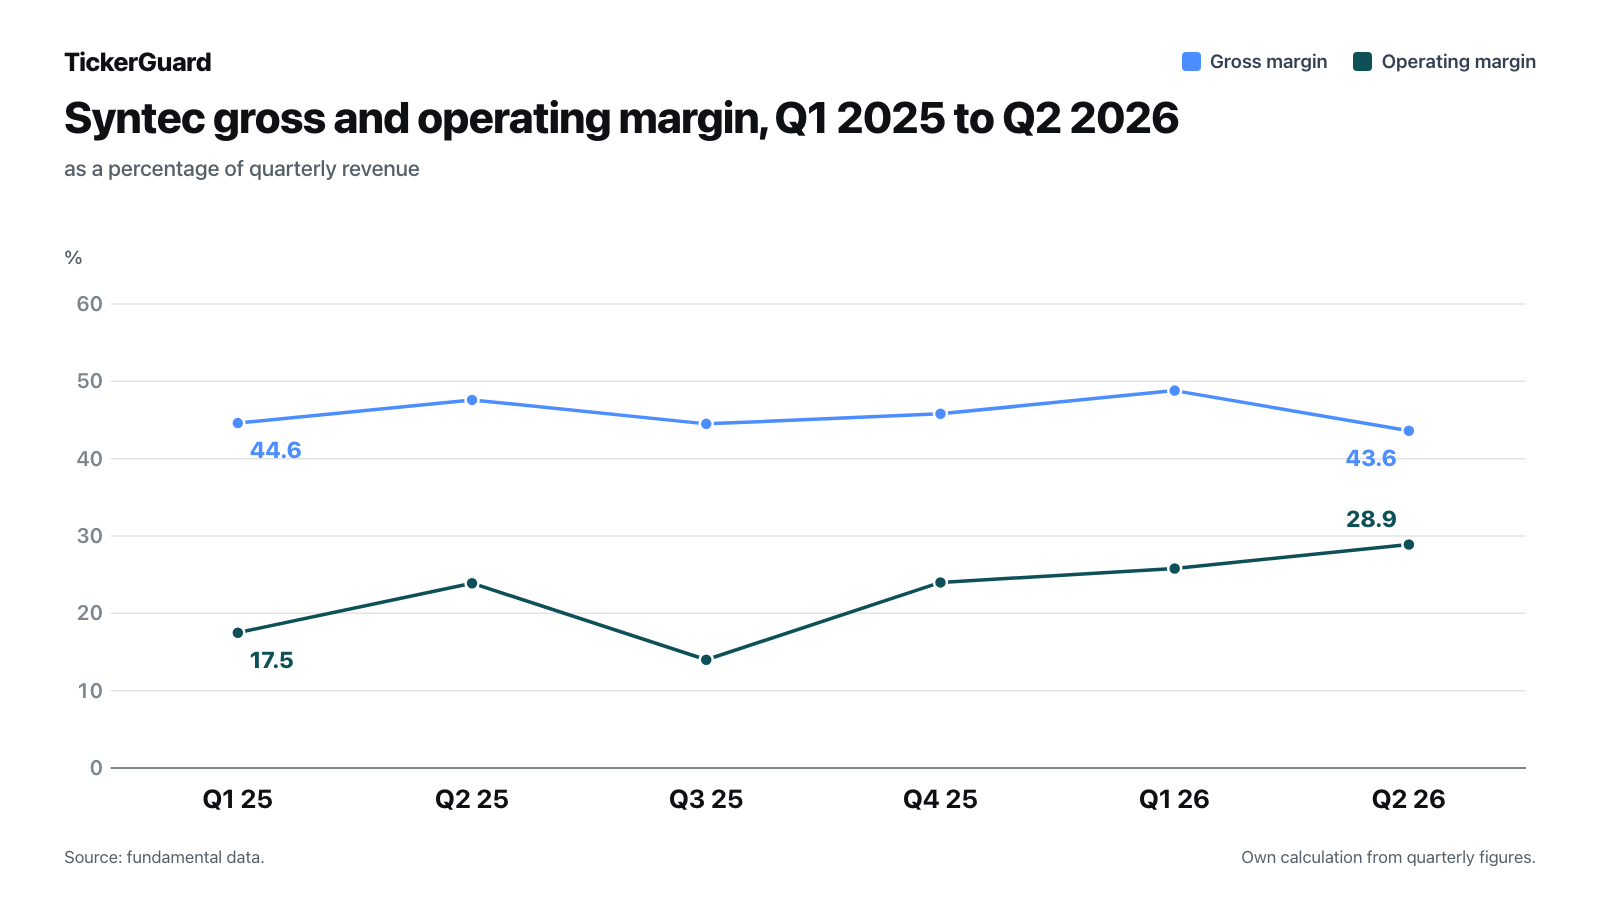
The quarterly series shows a margin that is anything but linear: 44.6 percent gross margin in Q1 2025, a high of 47.6 percent in Q2, a dip to 44.5 percent in Q3, 45.8 percent in Q4, a new high of 48.8 percent in Q1 2026 — and a decline to 43.6 percent in Q2 2026, even as revenue jumped from TWD 4.86 billion to TWD 8.26 billion in that same quarter. Notably, operating margin moved in exactly the opposite direction over the same period, hitting a fresh high of 28.9 percent in Q2 2026. That combination — falling gross margin, rising operating margin — points to a fixed-cost scale effect: sales, admin and R&D spending apparently grew more slowly than revenue. What none of the sources reviewed explains in detail is the gross-margin decline itself — whether product mix, input costs, or pricing concessions to large new customers are behind it remains an open question.
Uncomfortable truth No. 3: Almost 8 percent more shares in six months — without the available sources quantifying the move
Syntec's share count rose from 66,495,811 (Dec. 31, 2025) to 69,836,000 (March 31, 2026) and further to 71,760,000 (June 30, 2026) — up roughly 7.9 percent in six months. For comparison, the well-documented capital increase ahead of the September 2025 IPO (6,320,000 new shares at a provisional subscription price of TWD 630, proceeds of roughly TWD 4.79 billion) is individually documented, with subscription price, share count and timing, across several Taiwanese business outlets. For the further increase in the first half of 2026, by contrast, this research found only a passing half-sentence in the May 22, 2026 investor conference ("進行現金增資後" — "after a cash capital increase"), with no subscription price, share count or stated purpose. Anyone who automatically assumes EPS dilution from share-count growth this fast would be wrong here — per-share profit growth has clearly outrun the dilution so far — but the missing detail on the capital move itself remains an evidence gap that only the official MOPS filing could close.
Valuation
At 71,760,000 shares outstanding (balance sheet as of June 30, 2026) and a price of TWD 2,300 (Aug. 28, 2026, a day the stock lost 6.1 percent), the implied market capitalization is roughly TWD 165.05 billion — essentially matching the TWD 164.94 billion shown in fundamental data (a gap of under 0.1 percent, explainable by the balance-sheet date versus the calculation date). Converted, that is roughly USD 5.21 billion or EUR 4.49 billion (exchange rates as of Aug. 31, 2026: USD 1 = TWD 31.65, EUR 1 = TWD 36.76).
Based on trailing-twelve-month earnings per share (TWD 58.80), the trailing price-to-earnings ratio is roughly 39 — high, but not implausible on its face for a company that has roughly tripled profit year over year. Using the (single-analyst) 2026 consensus estimate (TWD 91.79), the calculated P/E is roughly 25; for the two-analyst 2027 estimate (TWD 112.66), roughly 20. The "forward P/E" field supplied in the dataset is unpopulated and is therefore not cited. Against book value per share (TWD 187.49 per fundamental data), the price-to-book ratio is roughly 12 to 13 — depending on whether one uses the data provider's reported share count or the count calculated from the most recent balance sheet (own calculation using the June 30, 2026 balance sheet: roughly 12.3).
Dividend yield is roughly 0.7 percent (a TWD 16 cash dividend for fiscal year 2025, paid in 2026, against the current price). Multiplying dividend per share by the share count outstanding at year-end 2025 yields total distributions of roughly TWD 1.06 billion against 2025 net income of TWD 2.28 billion — a calculated payout ratio of roughly 46.6 percent (this differs from the 29.8 percent figure supplied in the dataset, which could not be reconciled with this calculation and is therefore not cited). The stock has risen roughly 148 percent over the trailing twelve months (own metric from fundamental data, 252-trading-day comparison) and trades within a 52-week range of TWD 703 (Nov. 24, 2025) to TWD 3,070 (May 12, 2026) — against the TWD 153 opening price at its debut on Taiwan's Emerging Stock Market in June 2024, the price has risen to roughly 15 times that level.
Opportunities and Risks at a Glance
Opportunities: structurally growing demand for high-end controllers used in AI-server liquid cooling, robotics and electric vehicles; market-share gains management attributes to lead-time bottlenecks at competitor Fanuc (not independently confirmed); a practically debt-free balance sheet with roughly TWD 6.5 billion in net cash; rising operating margin despite volatile gross margin; and a documented, proprietary AI product line (AI-assisted tool-wear prediction and breakage monitoring built directly into the controller). Risks: a forward valuation that hangs on just one or two analyst estimates and has already moved 20 percent within a week; a gross margin that swings by up to 5 percentage points quarter to quarter without the available sources explaining why; a share count that rose almost 8 percent in six months without a publicly detailed capital-raise disclosure; heavy, conference-acknowledged dependence on the Chinese market without an exact revenue share; and a valuation that has risen 148 percent in twelve months, leaving little room for disappointment.
A Human Verdict
Extrapolation bias works so well on Syntec precisely because part of the story checks out: demand for high-end controllers in AI servers, robotics and electric vehicles is real, documented in multiple places, and more than just a chart story. The market-share gains against Fanuc are named by the company itself and plausible — though the cited 90-plus-day lead times come from Syntec itself and are not independently confirmed —, the balance sheet is healthy, and operating margin keeps climbing despite a choppy gross margin. What a glance at two record quarters alone does not show: the valuation of that future rests on an unusually narrow set of analyst opinions that already moved by a fifth within a single week. Shares outstanding grew in six months almost as fast as some smaller companies' annual revenue, without any public source explaining the move in detail. And a gross margin that swings by more than five percentage points from one quarter to the next is not a foundation on which to blindly extend a forward P/E of 20. Anyone who looks only at Syntec's two most recent record quarters underestimates how thin the data base is for the next two. Anyone who looks only at the thin analyst coverage, in turn, misses that a real, growing business with a healthy balance sheet sits behind the price move. The honest answer sits in between: a documented growth business whose latest acceleration has not yet been validated long enough to simply extend the line. Not investment advice.
Sources
This analysis draws on: the official Taiwan Stock Exchange company profile (TWSE Market Insights, Sept. 17, 2025); an AI-assisted summary of the public investor conference held May 22, 2026 covering first-quarter 2026 results (vocus.cc, June 4, 2026, with the source itself pointing to the official MOPS filing as the authoritative version); an interview with Chairman Tsai You-keng ahead of the IPO (TechOrange, Aug. 19, 2025); a company press article on corporate history (syntecclub.com, News 746); press coverage of the pre-IPO capital increase (wantrich.chinatimes.com and moneydj.com, Aug. 28/Sept. 15, 2025); a company profile with segment breakdown (moneydj.com, as of 2025); and fundamental data (price, valuation and balance-sheet metrics, quarterly and annual statements, analyst estimates, as of Aug. 28–31, 2026). No publicly available official verbatim transcripts of analyst calls exist for 7750.TW; our transcript search found no entry for this ticker (checked Aug. 31, 2026). Note: this analysis is journalistic coverage of publicly available information, not investment advice and not a recommendation to buy or sell.
Our Bottom Line at a Glance
- Growth positive
- Revenue rose 107 percent year over year in Q2 2026 to TWD 8.26 billion, driven by structural demand for AI-server liquid cooling and robotics controllers, plus management-reported market-share gains against competitor Fanuc.
- Margin in detail neutral
- Gross margin swings between 43.6 and 48.8 percent quarter to quarter with no explained trend, while operating margin rose from 17.5 to 28.9 percent over six quarters — a scale effect, but also unexplained gross-margin volatility.
- Balance sheet and liquidity positive
- Essentially debt-free: roughly TWD 6.48 billion net cash as of June 30, 2026, roughly a 54.7 percent equity ratio (own calculation), 2025 free cash flow of roughly TWD 2.02 billion despite capital spending nearly quadrupling.
- Capital structure and transparency negative
- Shares outstanding rose roughly 7.9 percent in six months via a capital increase whose terms are not detailed in the sources reviewed — unlike the well-documented pre-IPO capital increase in 2025.
- Geographic concentration neutral
- China is, by management's own conference acknowledgment, by far the most important market, without an exact revenue share disclosed; diversification via Turkey, Malaysia and India is underway but still small.
- Valuation negative
- Trailing P/E of roughly 39, calculated roughly 25 and 20 against consensus estimates resting on just one and two analysts respectively. The stock has risen 148 percent over twelve months.
Syntec shows a business that is genuinely and strongly growing: structural demand for AI-hardware controllers, company-reported market-share gains against a much larger competitor, and a practically debt-free balance sheet. At the same time, the forward valuation rests on an unusually thin analyst base, gross margin swings unexplained, and a first-half-2026 capital increase is not publicly traceable in detail. Not investment advice.
What Our Rating Means
Open questions
The business works in principle, but one material question is open. As long as it stays open, our findings do not carry a quality verdict.
The business model works and demonstrably grows, the balance sheet is very healthy with a net cash position, and there is no documented solvency-risk finding. Still, several material operational questions remain open: a capital increase of nearly 8 percent of share count with no publicly traceable terms, a gross margin that swings by up to 5 percentage points quarter to quarter without any source explaining why, and a forward valuation that effectively depends on a single analyst's opinion. These are unresolved operational and transparency questions, not existential risks — the rating sits at yellow, not red. That the stock is expensively valued and has run up sharply is a price argument, not a quality one, and does not factor into this rating. The decision is yours.
A journalistic assessment by our editorial team at the time of the deep dive, based on public sources — not investment advice and not a solicitation to buy or sell. Your personal circumstances (investment goals, risk capacity, taxes) cannot be taken into account. What our levels mean, how verdicts are formed, and what conflicts of interest exist →
Worth Noting
- Hook for this analysis: extrapolation bias — two consecutive record quarters (revenue +107 percent, profit +217 percent in Q2 2026 year over year) tempt investors to extend the trend unchecked.
- As of: TWSE company profile from Sept. 17, 2025, investor conference summary from May 22, 2026 (covers only Q1 2026), fundamental data with figures through June 30, 2026 (data as of Aug. 28–31, 2026).
- No official analyst-call transcripts available (as of Aug. 31, 2026) — this analysis relies on a third-party summary of the investor conference, not the official MOPS filing itself.
The full analysis as a PDF for later
We will send you this analysis as a PDF — to print, file away, and read at your own pace.
Frequently Asked Questions
Syntec Technology (TWSE: 7750), based in Hsinchu, Taiwan, has designed and made CNC controllers and servo drives for machine tools since 1995 (roughly 95 percent of revenue), plus laser technology and robotics solutions for industrial automation through subsidiaries Jumbo and Leantec.
Yes, in the sense of embedded product features: the official TWSE company profile describes the core strategy as "AI Empowerment + Intelligent Robots," and per the May 22, 2026 investor conference, Syntec is developing AI-embedded CNC controllers with universities, featuring tool-wear prediction, breakage monitoring and thermal-drift compensation. The company is therefore classified "Sells AI" (details in the AI dossier on this page).
Syntec is listed on the Taiwan Stock Exchange (TWSE) and is not SEC-registered — there is no 10-K, no 10-Q. Instead, quarterly and annual reports are required through Taiwan's mandatory disclosure system, MOPS, along with investor conferences. This analysis draws on the official TWSE company profile, a summary of the May 22, 2026 investor conference, and fundamental data.
Revenue rose 107 percent year over year to TWD 8.26 billion. Per the May 22, 2026 investor conference, structurally strong demand for high-end controllers used in AI-server liquid cooling and robotics drove the growth, reinforced by customers switching to Syntec because competitor Fanuc's lead times now exceed 90 days.
Gross margin moved between 43.6 and 48.8 percent from early 2025 to mid-2026 with no clear trend — most recently falling 5.2 percentage points in Q2 2026 even as operating margin hit a new high in the same quarter. None of the sources reviewed explains the gross-margin decline in detail; that is an open question in this analysis.
Heavily, but without a publicly stated exact share: even the analyst question at the May 22, 2026 investor conference takes for granted that China is the main revenue market. Management pointed to geographic diversification via Leantec (robotics) and sites in Turkey, Malaysia and India, but did not give a percentage for China's share.
At a price of TWD 2,300 (Aug. 28, 2026), the trailing price-to-earnings ratio is roughly 39. Against the (single-analyst) 2026 consensus estimate (TWD 91.79 EPS), the calculated ratio is roughly 25; against the two-analyst 2027 estimate (TWD 112.66), roughly 20 — a very thin evidence base for that forward valuation.
No official ones. An automated search (as of Aug. 31, 2026) found no publicly available verbatim transcripts for ticker 7750.TW. This analysis instead relies on a summary of the May 22, 2026 investor conference published by a specialized financial writer, noting that the official MOPS filing remains authoritative.
Found an error?
Did you spot a factual error, an outdated number, or a typo in this deep dive? Let us know briefly — your report goes straight to the editorial team.