Mueller Industries Stock: $1.4 Billion in Cash — and Profit Hangs on a Spread
Mueller Industries carries almost no debt, holds $1.42 billion in cash, and earned $850.5 million over the trailing twelve months. Revenue jumped 25.5 percent in the second quarter of 2026. We read the annual report and the quarterly report — and they say exactly where that jump comes from: higher selling prices, because copper got more expensive. Core product unit volume fell $212.0 million in 2025, and the gross margin slipped from 31.0 to 27.7 percent last quarter.
 Thomas Mücke
Founder & Publisher
Thomas Mücke
Founder & Publisher
As of Today
As of: September 17, 2026
- Closing price
- 60.30 $ -0.30%
- Market Capitalisation
- 13.3 $B
- P/E
- 15.1
- Growth Score
- 4/10
- AAQS
- 10/10
Price change since September 3, 2026: -4.3%
This analysis has a cut-off date. The Stock Guard tells you when something material changes in the numbers. Reserve your free spot

Chart
Interactive price chart (TradingView).
52-week range: 55.70 $ to 140.80 $ · Last price: 60.30 $ (As of: September 17, 2026)
Note: pure fact-based analysis, not investment advice and not a solicitation to buy or sell. All figures without guarantee.
Picture a currency exchange booth at a train station. It buys euros and sells dollars. What does it earn? Not from how much money crosses the counter — only from the spread between its buy and sell rate. If the dollar doubles, the amount crossing the counter doubles too. The booth's earnings don't change by a single cent. They change only when the spread widens or narrows.
Keep that image in mind while working through Mueller Industries (NYSE: MLI). The numbers are impressive: almost no debt, $1.42 billion in cash, a 25.5 percent revenue jump in the second quarter of 2026, a 23 percent operating margin. So here's the deal: before you let that data sheet convince you, let's read together where the growth actually comes from. The answer sits in the company's filings with the U.S. Securities and Exchange Commission, and it's uncomfortable. In the end, the decision is yours.
So you know where this is going, here's the tension at the center of this analysis up front: Mueller Industries' balance sheet is real, exceptionally strong, and staying that way. The revenue growth is something else than it looks like — it comes mostly from the fact that copper got more expensive and the price increases got passed through. Keep this sentence in mind: in 2026, Mueller is selling significantly more copper tube in dollars, and less of it in feet.
What Mueller Industries actually does
Mueller is a metal processor, not a mining company. It buys copper cathode and brass scrap on the world market, then presses, draws and shapes it into tube, fittings, rod, wire and valves — and sells those to wholesalers, HVAC manufacturers and home-improvement retailers. A company that pulls copper out of the ground itself is a completely different business with a completely different risk profile; we looked at one example in our Freeport-McMoRan analysis. For Mueller, the copper price isn't revenue — it's a cost line that has to be passed through.
The company was incorporated in Delaware on October 3, 1990, is headquartered in Collierville, Tennessee, and trades on the New York Stock Exchange. It reports as an ordinary U.S. issuer via annual report (10-K), quarterly report (10-Q) and current report (8-K). Its fiscal year doesn't end December 31 but on the last Saturday before it — fiscal 2025 ran through December 27, 2025. Plants and distribution span the U.S., Canada, Mexico, the U.K., South Korea, the Middle East and China.
Three segments split the business. These are fiscal 2025 figures:
- Piping Systems — copper tube, fittings, refrigerant lines, steel nipples. Revenue $2,708.7 million, operating income $772.3 million. By far the core: nearly two-thirds of revenue and roughly three-quarters of segment operating income.
- Industrial Metals — brass rod, aluminum and brass forgings, extrusions, high-performance wire and cable. Revenue $1,023.6 million, operating income $105.0 million. Noticeably thinner margins: gross margin was 16.0 percent in 2025.
- Climate — refrigeration valves, pressure vessels, pressurized-gas valves, insulated flexible air ducts. Revenue $497.9 million, operating income $145.1 million. The smallest segment, and the highest-margin one.
At its core, the end market is construction. The company says so itself in its annual report: new single- and multi-family construction, commercial building projects, plus repair and remodeling. That's exactly why the second figure from the same report matters so much: according to the U.S. Census Bureau, 1.36 million housing units were started in the U.S. in 2025 — down from 1.37 million in 2024. The 30-year mortgage rate averaged roughly 6.60 percent versus 6.72 percent. In short, the end market is flat.
Company history for investors
-
2021
Margin level jumps and stays up
The operating margin climbs from roughly 8 to over 17 percent – the start of the spread widening that still drives most of today's profit.
-
2024
Nehring and Elkhart acquisitions
A combined $602.7 million from cash on hand – for the first time, Mueller grows meaningfully through acquisitions rather than price alone.
-
2026
2-for-1 stock split
Effective 06/29/2026 – changes nothing about enterprise value, just makes the stock nominally cheaper and the share count larger.
-
2026
Dividend jumps 40 percent
The quarterly dividend rises to 17.5 cents per share in the first quarter of 2026, management's sixth straight double-digit annual increase.
-
2026
Board member announces retirement
Gary S. Gladstein announces on 08/06/2026 that he will retire effective 12/31/2026; the same filing confirms the unchanged 17.5-cent dividend.
Where this stock showed up in our scanner
Mueller Industries reached our research list through a single filter: "QARP — Quality at a Reasonable Price", where it ranked 7th among U.S. names as of the original screening date (July 27, 2026). This scanner is strict because it requires five conditions simultaneously — quality alone is usually expensive, cheapness alone is usually junk. You can reach the same screen yourself: on tickerguard.com, open the "Scanner" menu, select the "QARP — Quality at a Reasonable Price" filter, set the country to USA, and look for the MLI row. For this update, dated September 4, 2026, we re-checked all five hurdles against the current data — they still all clear simultaneously:
- Piotroski F-Score of at least 7 — MLI: 7 of 9. This score tallies nine yes/no questions on profitability, balance-sheet strength and efficiency.
- Return on equity of at least 15 percent — MLI: 28.3 percent. Cross-check: $850.5 million in trailing-twelve-month earnings on $3,547.8 million in equity as of June 27, 2026 works out to 24.0 percent; against average equity over the last four quarters, roughly 26 percent. The hurdle clears comfortably either way.
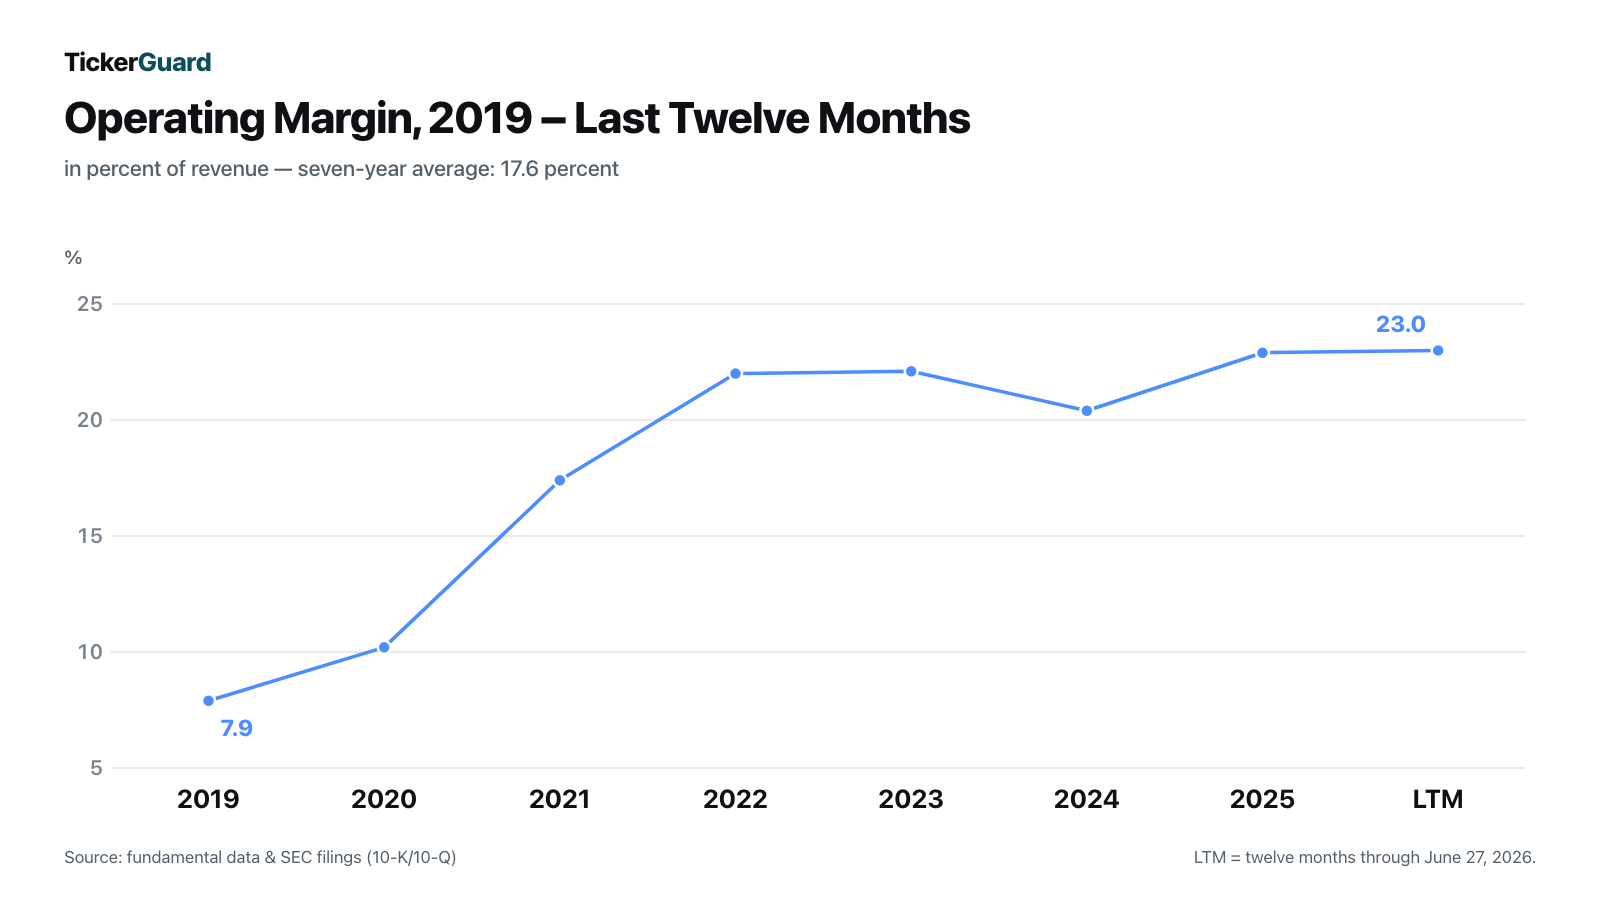
- Operating margin of at least 10 percent — MLI clears this with room to spare. In 2025, $958.5 million of operating income remained from $4,178.5 million in revenue, or 22.9 percent; on a trailing-twelve-month basis, 23.0 percent.
- Debt-to-equity ratio of at most 1 — MLI: essentially zero. As of June 27, 2026, $5.2 million in debt stood against $3,547.8 million in equity. At year-end 2025, there was no debt at all.
- Positive price-to-earnings ratio, capped at 20 — MLI: 16.8 back then, only 15.7 as of September 4, 2026. This is the hurdle worth examining closely, and that's what the rest of this piece is about.
The data provider additionally lists a fundamental rating of 69 (grade B) and a three-year return of 79.3 percent per year — both as of September 4, 2026, barely changed from the original screening. Market capitalization now sits at roughly $13.9 billion, lower than in July because the share price has eased slightly since then, not because the business has deteriorated. A scanner always describes what was, though. That all five hurdles keep clearing simultaneously is a genuine quality signal — it just doesn't say how long the margin behind four of those five metrics will hold. So let's look at the numbers.
The numbers over the years — a company that became a different one in 2021
To understand how much this business depends on the spread, you only need to compare two years. In 2019, Mueller Industries generated $2,430.6 million in revenue and $191.4 million in operating income from it — a 7.9 percent margin. In 2025 it was $4,178.5 million in revenue and $958.5 million in operating income, or 22.9 percent. Revenue hasn't quite doubled; operating income has grown fivefold.
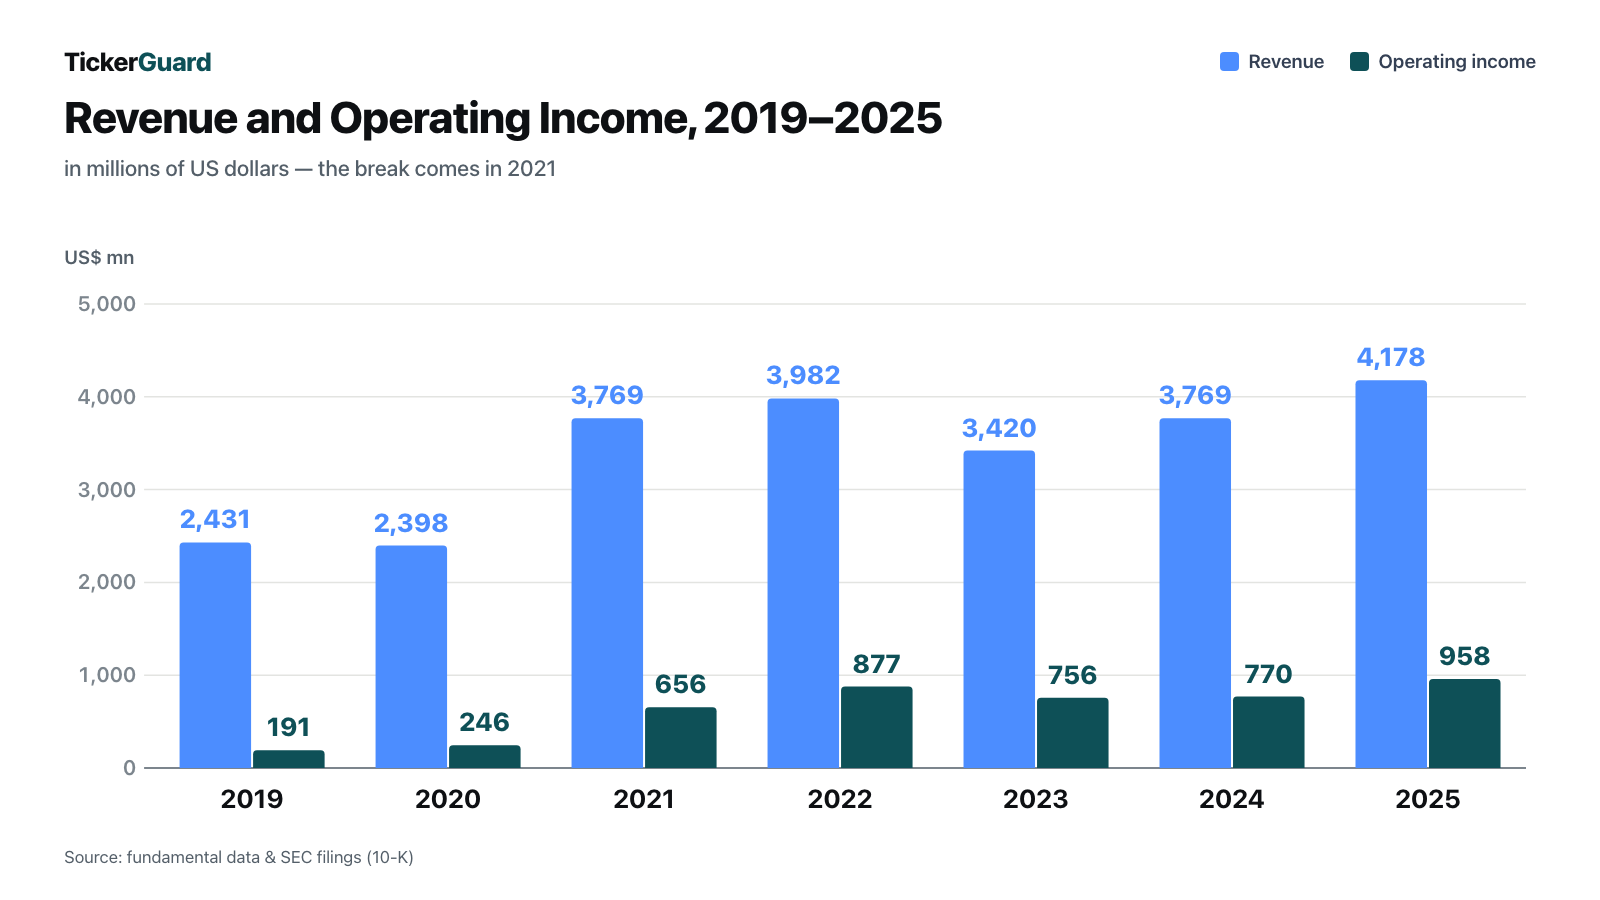
The break is in 2021. Before it, the operating margin ran 7.9 percent (2019) and 10.2 percent (2020). After it: 17.4 (2021), 22.0 (2022), 22.1 (2023), 20.4 (2024) and 22.9 percent (2025). That's not a gentle trend — it's a level shift. It was triggered by the pandemic's aftershocks: broken supply chains, scarce inventory, a construction boom fueled by low rates — and, with all that, selling prices rising faster than raw-material costs. That's exactly a wider spread.
The most recent quarterly figures initially extend the trend. In the second quarter of 2026 (the fiscal quarter ended June 27, 2026), revenue rose 25.5 percent to $1,427.9 million, operating income rose 1.9 percent to $310.0 million, and net income rose 1.5 percent to $249.7 million. For the first half of 2026, that was $2,620.9 million in revenue (up 22.6 percent) and $622.2 million in operating income (up 21.9 percent). Look closely and you'll already spot the gap: in the second quarter, revenue grew roughly thirteen times as fast as operating income.
The balance sheet — nothing here for a pessimist to work with
Let's start with what doesn't depend on the spread. As of June 27, 2026, Mueller Industries carried exactly $5.2 million in financial debt — by its own account, 0.1 percent of total capitalization, and even that residual balance stems from an acquisition. At year-end 2025, the line was simply empty. Against that stand $1,388.7 million in cash and $27.2 million in short-term investments, together $1.42 billion. Of $4,257.3 million in total assets, only $683.3 million are liabilities at all; the rest is equity ($3,547.8 million plus $26.3 million in noncontrolling interests).
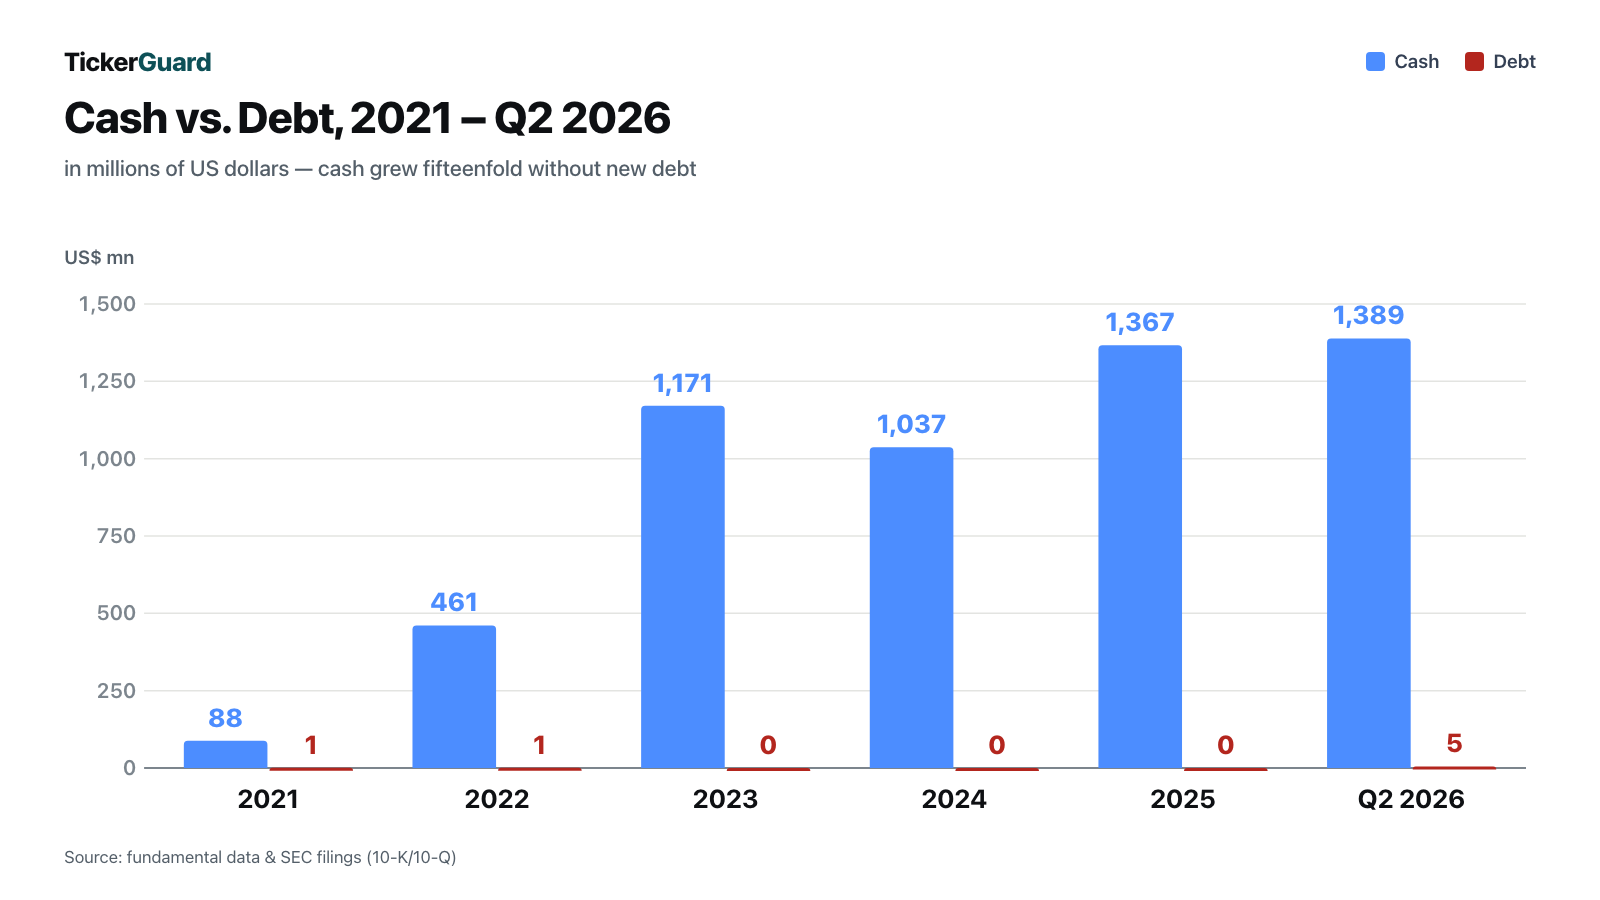
How unusual this is shows up in the interest line: in the second quarter of 2026, Mueller Industries paid $134,000 in interest and collected $11.0 million. The company earns roughly eighty times what it owes its banks. And the credit facility says a lot about how management sees itself: in March 2026, the old agreement was replaced with a new one — $100 million, unsecured, maturing March 27, 2031. The old facility was $400 million. A company with roughly $14 billion in market cap shrank its credit line to a quarter of its former size because it doesn't need it.
For anyone who wants the Altman Z″-score, the bankruptcy early-warning number built from four balance-sheet ratios (below 1.1 is the danger zone, 2.6 and above is the safe zone): the balance sheet carries the formula easily here because it's cleanly split into current and long-term items. Our own recalculation as of December 27, 2025 comes out to roughly 15.4 — well beyond the safe zone. But it's worth knowing what drives that number: 6.8 of the 15.4 points come purely from the ratio of equity to liabilities (6.5-to-1), another 3.3 from retained earnings of $3,761.6 million. What the score tells you: by this measure, this balance sheet is a long way from bankruptcy risk. It tells you nothing about whether the margin holds. And that's exactly the open question at Mueller Industries.
The uncomfortable truths
At a debt-free, highly profitable company, uncomfortable truths aren't existential questions. But you need to know them to understand the price. There are four worth reading.
Uncomfortable truth #1: profit is a spread, and the company says so itself
Here the money-changer's booth returns as hard evidence. In the MD&A section of the 2025 annual report sits a paragraph worth reading twice:
"Profitability of certain of our product lines depends upon the 'spreads' between the cost of raw material and the selling prices of our products. The open market prices for copper cathode and copper and brass scrap, for example, influence the selling price of copper tube and brass rod, two principal products manufactured by the Company. … Our earnings and cash flow are dependent upon these spreads that fluctuate based upon market conditions."
— Mueller Industries, Inc., SEC Form 10-K, fiscal year 2025, MD&A

Why it matters: the COMEX copper price averaged $3.86 per pound in 2023, $4.22 in 2024, $4.81 in 2025 — and $6.16 in the second quarter of 2026, up 30.6 percent from the year-ago quarter. Every one of those dollars first flows into cost accounting, then into the selling price. Revenue grows automatically along with it. That says nothing about earnings — exactly like the money-changer.
Uncomfortable truth #2: the revenue gain comes from price, and volume is shrinking
Now for the cross-check. The 2025 annual report itself breaks down the 10.9 percent revenue increase, and the breakdown is sobering: plus $336.9 million from higher selling prices, plus $208.1 million from wire and cable maker Nehring, acquired in June 2024, plus $41.5 million from non-core products, plus $35.1 million from fittings maker Elkhart, acquired in August 2024 — and minus $212.0 million from lower unit volume in core products.
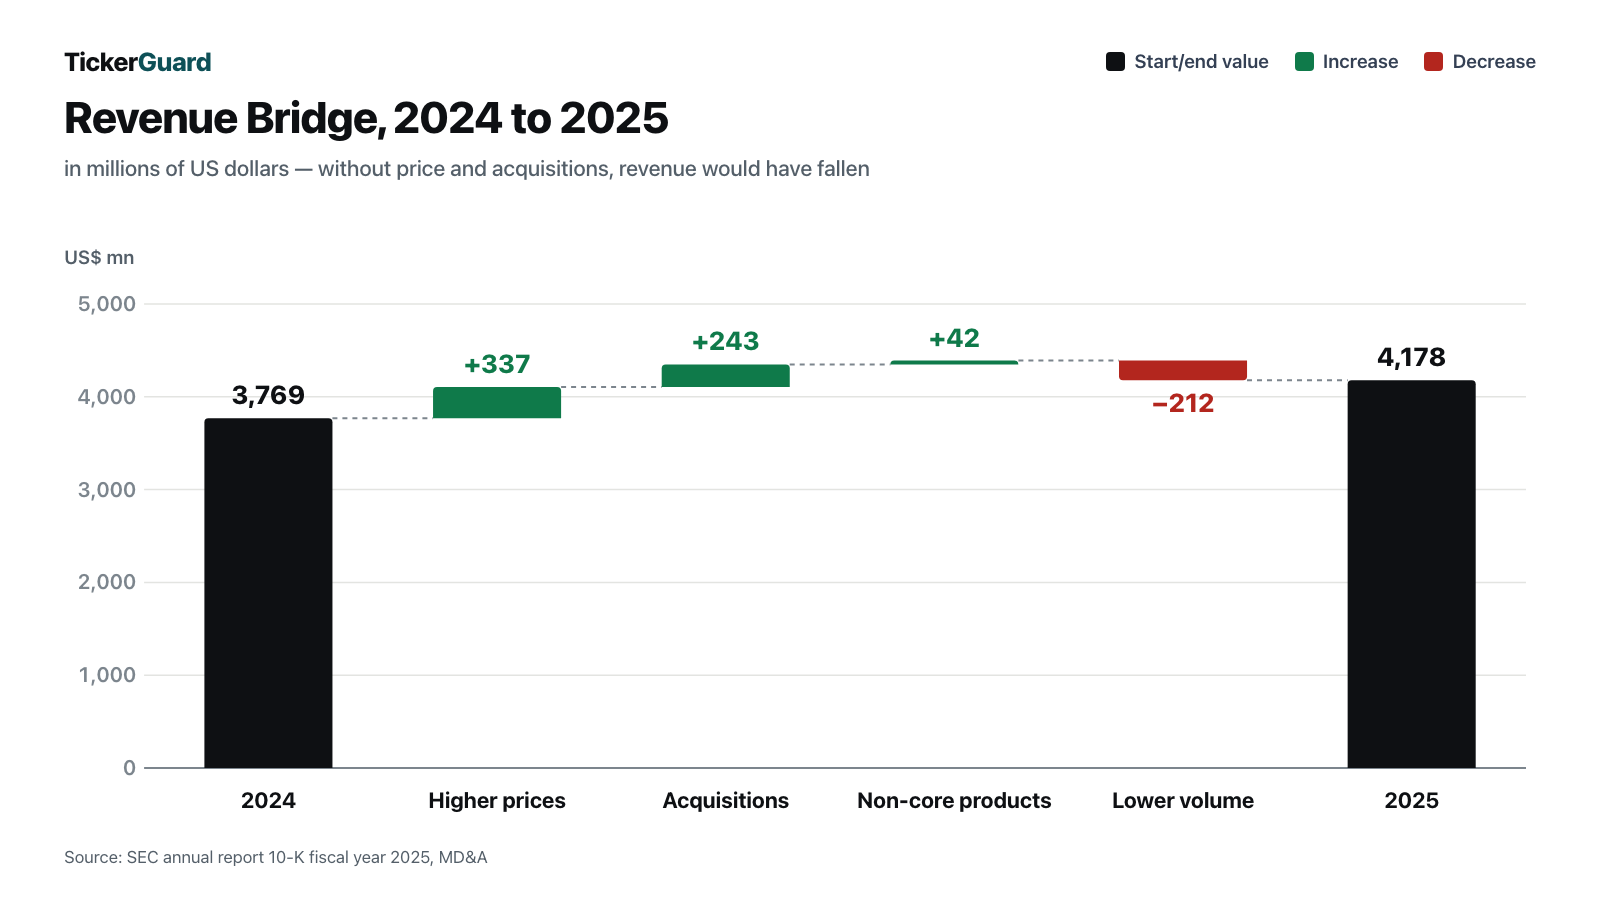
Read that soberly: without the price effect and the two acquisitions, revenue would have declined in 2025. The same pattern repeats in the first half of 2026 — plus $400.7 million from higher selling prices, minus $13.0 million from lower volume. Only in the second quarter did volume turn slightly positive for the first time ($17.4 million), carried by brass rod and cable, while copper tube volume kept falling, down $15.9 million. We saw the same pattern — more revenue, barely more product — at flooring maker Mohawk Industries, which sits on the same U.S. construction and renovation market.
Uncomfortable truth #3: the spread is already narrowing
And now the number that carries this whole analysis. If profit depends on the spread, you have to measure the spread — and there's a clean metric for that: gross margin. It stood at 27.7 percent, down from 31.0 percent a year earlier, in the second quarter of 2026. In the Piping Systems segment, the core of the business, it fell from 34.1 to 30.4 percent.
"Gross margin as a percentage of sales was 27.7 percent compared with 31.0 percent in the prior year quarter."
— Mueller Industries, Inc., SEC Form 10-Q, quarter ended 06/27/2026, MD&A

What that means shows up in a single segment line: at Piping Systems, revenue rose 27.3 percent in the second quarter of 2026 — and operating income fell 0.8 percent. More dollars across the counter, no additional earnings. In fairness: the year-ago quarter's line included a $36.3 million insurance gain tied to 2023 tornado damage. Strip that out, and consolidated operating income rose 15.7 percent instead of 1.9 percent — still well short of the 25.5 percent revenue growth.
There's a structural point on top of this, one Mueller names in every report itself: plastic is replacing copper. That's not speculation — it's the company's own disclosure:
"For plumbing systems, plastics are the primary substitute product; these products represent an increasing share of consumption. For certain air-conditioning and refrigeration applications, aluminum-based systems are the primary substitution threat."
— Mueller Industries, Inc., SEC Form 10-Q, quarter ended 06/27/2026, MD&A overview
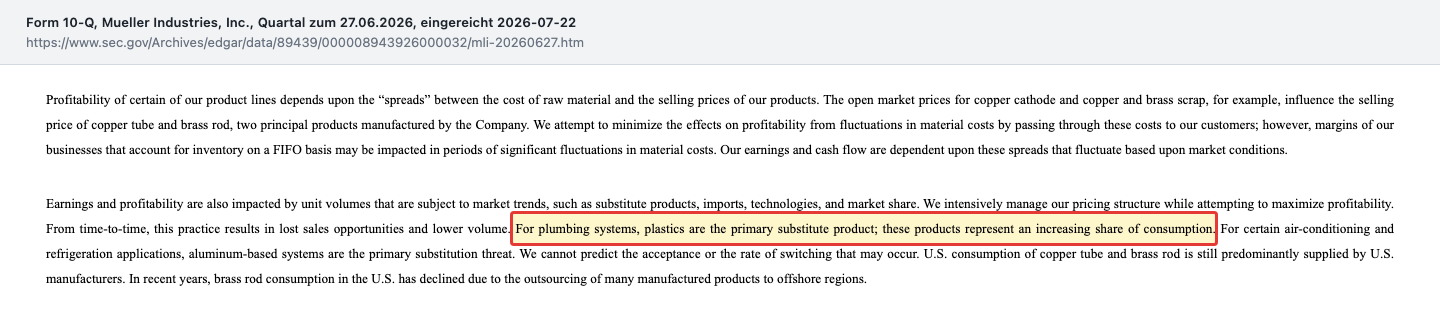
That explains the volume decline better than any economic-cycle story: some of the lost footage never comes back, because plastic goes into new construction where copper used to.
Uncomfortable truth #4: right now, nobody knows what tariff rules apply
The fourth point isn't a balance-sheet question — it's a legal one, and an unusually fresh one. On February 20, 2026, the U.S. Supreme Court struck down part of the existing tariff regime, ruling it rested on an emergency authority that couldn't support it. The administration then announced it would rely on other legal authorities and imposed new tariffs on imports from all countries. Mueller addresses this in its risk factors:
"Further, on February 20, 2026, the United States Supreme Court issued a ruling striking down certain tariffs previously imposed under the International Emergency Economic Powers Act (IEEPA). … There remains substantial uncertainty regarding the duration of existing and newly announced tariffs, potential changes or pauses to such tariffs, tariff levels, and whether further additional tariffs or other retaliatory actions may be imposed, modified, or suspended."
— Mueller Industries, Inc., SEC Form 10-K, fiscal year 2025, Item 1A (Risk Factors)
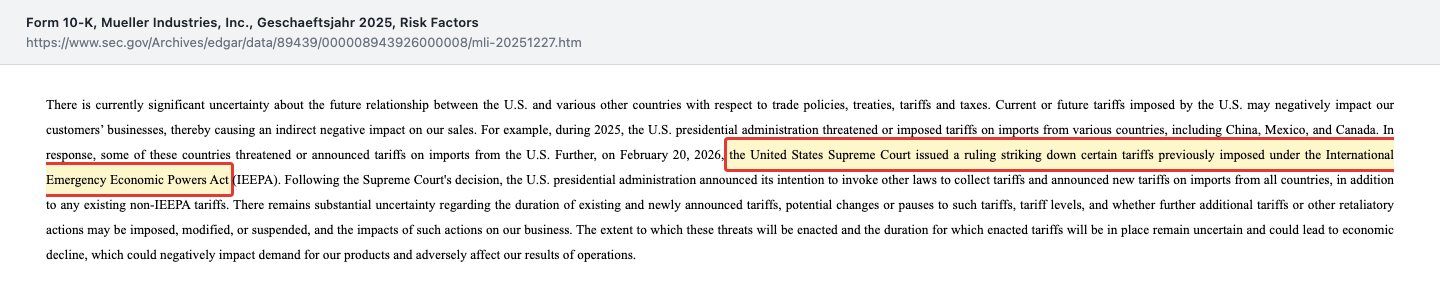
For Mueller, this cuts both ways. As a manufacturer producing mostly in the U.S., the company benefits when imported copper tube becomes more expensive — a pattern also visible in U.S. metals producers whose gross margins jumped once tariffs went into effect. At the same time, tariffs raise the cost of purchased raw materials and inputs and can squeeze customers. The report says so bluntly: tariffs "could impact the gross margin realized by the Company on its products." And one specific legacy matter remains open: on April 8, 2026, U.S. customs authorities sought roughly $5.1 million in antidumping duties and interest from subsidiary Southland on 2007/2008 imports — small in dollar terms, but evidence of how long these proceedings can run.
What the company does with the money
Mueller hasn't squandered the earnings boom — it has directed it into three channels. First, acquisitions: in 2024, $602.7 million went to wire and cable maker Nehring and fittings maker Elkhart. On March 30, 2026, copper tube maker Bison Metals Technologies of Shawnee, Oklahoma was added for $138.3 million, and on June 12, 2026, extrusion assets of Chicago Extruded Metals for $3.9 million. All funded from existing cash, without a dollar of borrowed capital. CEO Greg Christopher said in the Q2 2026 earnings release that Bison had "already delivered a record second quarter."
Second, divestitures: in the first quarter of 2026, Mueller sold its Sherwood business — $57.0 million in proceeds, a $41.4 million gain. That gain sits inside the reported first-half result and isn't recurring earning power; anyone measuring operating trends needs to strip it out. The same applies to 2025: the $958.5 million in operating income includes a $41.1 million insurance gain from the tornado damage and $25.9 million in gains on asset sales — together roughly 7 percent of operating income.
Third, returns to shareholders. The quarterly dividend — in today's split-adjusted terms — rose from 7.5 cents (2023) through 10 cents (2024) and 12.5 cents (2025) to 17.5 cents per share starting in the first quarter of 2026, up 40 percent within a year. On August 6, 2026, the board reaffirmed that same rate unchanged: 17.5 cents, payable September 18, 2026 to shareholders of record on September 4, 2026 — no further increase since the first-quarter jump. Annualized that's 70 cents; at the roughly $63 share price (September 3, 2026), that's a yield of roughly 1.1 percent. On top of that, share buybacks: $243.6 million in 2025, another $76.4 million in the first half of 2026. The board's authorization covers up to 80 million shares (split-adjusted); 39.2 million have been repurchased since the first authorization in 1999.
On June 29, 2026, the stock also underwent a 2-for-1 split; it has traded split-adjusted since July 1, 2026, and authorized shares rose from 250 to 500 million. A split changes nothing about enterprise value — it's only the reason older price and earnings figures for MLI aren't comparable to today's without adjustment. In that same August 6, 2026 filing, director Gary S. Gladstein announced he would retire from the board effective December 31, 2026 — he had served, with a break, since 1990, and chaired the board for a period. A routine succession, with no apparent connection to business performance.
What management said across six earnings releases — and what actually happened
An honest caveat up front: no verified word-for-word transcript of Mueller Industries' analyst calls is available — not through our internal pipeline, and not through public research either. That means we can't evaluate what analysts pushed back on in the Q&A, and that portion of a call usually matters more than the prepared statement. What we do have are the six SEC earnings releases (each an 8-K, Exhibit 99.1) from the first quarter of 2025 through the second quarter of 2026 — the same filings cited elsewhere in this analysis. They contain CEO Greg Christopher's prepared remarks, not analyst questions. Two patterns run through all six releases.
Pattern one: the hoped-for recovery in U.S. residential construction hasn't shown up in five straight quarters. In April 2025, the tone was still measured:
"While markets and demand are in line with our year end comments and outlook, the tariff and trade policies have presented new challenges. … As we have consistently demonstrated resilience during past periods of disruption, we are confident in our ability to effectively navigate the current environment."
— Mueller Industries, Inc., SEC Form 8-K, filed 04/22/2025, Exhibit 99.1 (Q1 2025 earnings release)
From there, some version of "once housing markets recover" appears in essentially every subsequent release — in July 2025 ("residential construction in the U.S. remains subdued"), in October 2025 ("softness in residential construction … exerted downward pressure on unit volumes"), in February 2026 ("we do not expect market conditions to abruptly rebound in 2026"), in April 2026 ("once those markets recover, we are exceedingly well positioned to benefit"), and most recently in July 2026, where the hope got even vaguer: Christopher pointed to a "resolution of the conflict in Iran" as a path to lower energy costs. Five quarters running with the same expectation — and the 2025 annual report itself quantifies why it hasn't materialized: 1.36 million U.S. housing starts in 2025, down from 1.37 million in 2024, still moving sideways.
Pattern two: tariffs got reframed from a risk into an opportunity — and the record profits actually arrived, but not because of the market. That's clearest looking back at full-year 2025:
"Our fourth quarter capped a year in which every quarter marked an improvement over the prior year period. Those results culminated in the highest annual operating and net income in our Company's history, a particularly noteworthy achievement given that market conditions worsened compared to 2024, not to mention the disruption and costs that tariffs imposed on several of our businesses."
— Mueller Industries, Inc., SEC Form 8-K, filed 02/03/2026, Exhibit 99.1 (Q4 and full-year 2025 earnings release)
In its own words, the company is saying exactly what the numbers in this analysis show: a record result despite weaker market conditions, not because of better ones. On tariffs specifically, the tone shifts within a year from defensive ("we are not immune to the effects of tariffs," April 2025) to offensive ("we believe that the imposition of trade protections will ultimately benefit most of our portfolio companies," July 2025) to settled ("we have absorbed the impact of changes in tariff and trade policies," February 2026) — a progression that lines up with the tariff situation described elsewhere in this analysis and largely confirms management's own read of it.
What follows from all this is modest but verifiable: the earnings releases confirm this analysis's central thesis from a second, independent source — management's own words across six quarters. They don't contradict it. What they can't provide is a view of analysts' pointed follow-up questions, because that portion simply isn't available here.
Valuation — why a P/E of 16.4 isn't a bargain price here
Now to the core question. As of September 4, 2026, the data provider shows Mueller Industries at a price-to-earnings ratio of 15.7 and a market capitalization of roughly $13.93 billion, based on the $63.00 close on September 3, 2026. Let's start with the cross-check, because market caps often go stale after capital actions. Per the quarterly report's cover page, 221,181,388 shares were outstanding as of July 17, 2026 — no more recent count is available. 221,181,388 shares times $63.00 works out to roughly $13.93 billion, essentially matching the data provider exactly. Trailing-twelve-month earnings per share from the filings remain unchanged at $3.84 ($3.43 for split-adjusted 2025, minus $1.80 for first-half 2025, plus $2.21 for first-half 2026) — which, at today's price, yields our own P/E of roughly 16.4, slightly above the data provider's 15.7. The small gap likely comes down to a different earnings basis on the provider's side; what matters is that both calculations land in the same range, and both have the June 29, 2026 stock split baked in.
And now for the trap. A price-to-earnings ratio of 15 to 16 sounds moderate for a balance sheet this strong. But it's really a statement about how durable the denominator is. Trailing-twelve-month earnings rest on a 23.0 percent operating margin — the highest level in this multi-year series since 2019, 5.4 percentage points above its own average over those years. That twelve-month window (July 2025 through June 2026) remains the most recent one available, because the Q3 2026 report isn't expected until October 20, 2026 per the data provider. Let's run through what happens if that margin reverts:
- Today (twelve months through 06/27/2026): revenue $4,661.1 million, operating income $1,070.3 million, margin 23.0 percent, earnings per share $3.84 — at the $63.00 close (September 3, 2026), a P/E of roughly 16.4.
- Reversion to the seven-year average (17.6 percent, 2019 through 2025): operating income $819.0 million, at a 24.4 percent tax rate roughly $2.99 earnings per share — same company, same price, P/E roughly 21.
- Reversion to pre-boom levels (2019/2020 average: 9.1 percent): roughly $1.63 earnings per share, P/E roughly 39.
Three numbers, one company, a valuation spread of roughly two to two-and-a-half times — depending on which margin you consider "normal." The honest way to put it, then, isn't "Mueller Industries is cheap," but: Mueller Industries is cheap if the spread stays as wide as it is right now. And the most recent known quarter's gross margin says it currently isn't. How fast that can turn is visible at U.S. steelmaker Nucor, whose profit has fallen by roughly three-quarters since 2022 — at a company whose balance sheet was never in question either.
Against pure cycle skepticism stand three verifiable arguments. First, Mueller Industries has been profitable every single year since at least 2009 — including 2009 itself, the trough of the financial crisis, with $4.7 million in net income, and 2019 with $101.0 million. Second, the $1.42 billion cash pile covers more than a year and a half of earnings even at the weak 2019/2020 level. Third, the company is currently expanding its base into segments with a different pricing logic — cable, extrusions, refrigeration valves. Anyone buying here is risking their entry price, not the business.
Opportunities and risks at a glance
What speaks for Mueller Industries:
- A balance sheet with no soft spot: $5.2 million in debt against $1.42 billion in cash and short-term investments (06/27/2026); $3,547.8 million in equity against $683.3 million in liabilities. The company collected $11.0 million in interest income in the second quarter and paid $134,000.
- High earning power across the cycle: 23.0 percent operating margin on a trailing-twelve-month basis, 24 to 28 percent return on equity, $850.5 million in net income — and a positive result every year since at least 2009.
- Growing shareholder returns with no borrowed capital: quarterly dividend, split-adjusted, from 7.5 cents (2023) to 17.5 cents (2026), plus $243.6 million in buybacks in 2025 and $76.4 million in the first half of 2026.
- Acquisitions funded from cash: $602.7 million for Nehring and Elkhart (2024), $138.3 million for Bison (03/30/2026), $3.9 million for Chicago Extruded assets (06/12/2026) — without a dollar of borrowing, and with an unused credit facility of only $100 million.
What speaks against it:
- Profit is a spread: the company itself says earnings and cash flow depend on the "spreads" between raw-material costs and selling prices. The copper price rose from $3.86 per pound (2023) to $6.16 in the second quarter of 2026 — and it can fall just as easily.
- The spread is already narrowing: gross margin in the second quarter of 2026 was 27.7 percent, down from 31.0 percent; at Piping Systems, 30.4 down from 34.1 percent. Segment revenue there rose 27.3 percent while segment operating income fell 0.8 percent.
- Price, not volume: in 2025, revenue grew $336.9 million from higher prices and $243.2 million from acquisitions while core product unit volume fell $212.0 million. The company itself says plastic is durably gaining share in plumbing systems.
- A valuation trap at peak margin: the roughly 16 price-to-earnings ratio (data provider: 15.7) rises to roughly 21 if the operating margin reverts to its seven-year average of 17.6 percent, and to roughly 39 at 2019/2020 levels.
- One-time items in reported results: $41.1 million in insurance gains and $25.9 million in asset-sale gains in 2025, plus a $41.4 million gain on the Sherwood sale in the first quarter of 2026.
- An unresolved tariff picture since the Supreme Court's February 20, 2026 ruling — with effects that cut both ways — plus a $5.1 million tariff claim against subsidiary Southland from April 8, 2026.
A human conclusion
Remember the currency exchange booth from the start — the one whose volume doubles when the exchange rate doubles, without the money-changer earning a cent more? Having looked through the filings, you now know why that image fits here: Mueller Industries reported a 25.5 percent revenue increase and a 1.9 percent operating-income increase for the second quarter of 2026. Both numbers are accurate. They just don't describe the same thing.
And yet it would be unfair to leave the story there. This company has turned its boom into something rare in this industry: it hasn't taken on debt, it has grown cash from $88 million (2021) to $1.39 billion, it buys companies with cash, it raises its dividend every year, and it shrank its credit line from $400 million to $100 million because it doesn't need it. If the spread keeps narrowing — and it currently is — that hits earnings and the share price, but not the company's existence. That's precisely the difference between a price risk and a solvency risk.
What you make of that is your decision. Weighing the findings honestly, what remains is a very good company at a price that assumes a peak margin holds. So this is explicitly not a warning — the company is strong — but a situation worth watching. And it's unusually easy to track: every quarterly report contains a single sentence with the gross margin. Stay at 30 percent or above, and the valuation holds up. Slide toward 25 percent, and today's roughly 16 price-to-earnings ratio quietly becomes one above 20, without the share price having to move at all. The money-changer doesn't count the bills. It measures the spread. You can read it for yourself, every quarter.
Sources
- Mueller Industries, Inc. — SEC Form 10-K, fiscal year 2025 (period ended 12/27/2025, filed 02/25/2026)
- Mueller Industries, Inc. — SEC Form 10-Q, quarter ended 06/27/2026 (filed 07/22/2026)
- Mueller Industries, Inc. — SEC Form 8-K, filed 07/21/2026, Exhibit 99.1 (Q2 2026 earnings release)
- Mueller Industries, Inc. — SEC Form 8-K, filed 03/30/2026 (new $100 million credit facility through 2031)
- Mueller Industries, Inc. — SEC Form 8-K, filed 07/01/2026 (2-for-1 stock split, effective 06/29/2026)
- Mueller Industries, Inc. — SEC Form 8-K, filed 08/10/2026 (director Gary S. Gladstein's retirement, confirmed $0.175 quarterly dividend)
- Earnings releases (SEC Form 8-K, Exhibit 99.1) for Q1 2025 (04/22/2025), Q2 2025 (07/22/2025), Q3 2025 (10/21/2025), Q4/full-year 2025 (02/03/2026) and Q1 2026 (04/21/2026) — for the management-commentary chapter
- Fundamental data (metrics, valuation, multi-year revenue and earnings series); in-house stock scanner, data as of September 4, 2026 (price September 3, 2026); original German-language publication July 27, 2026.
Disclaimer: This article is a journalistic analysis, not investment advice. It is not a recommendation to buy or sell and cannot account for your personal circumstances. Stocks are subject to price fluctuations; a total loss is possible. Make your own investment decisions and consult independent advice if in doubt.
Key figures at a glance
All monetary figures in millions of $; earnings per share as reported.
| Metric | 2021 | 2022 | 2023 | 2024 | 2025 |
|---|---|---|---|---|---|
| Revenue | 3,769.3 | 3,982.5 | 3,420.3 | 3,768.8 | 4,178.5 |
| Operating Income (EBIT) | 655.8 | 877.1 | 756.1 | 770.4 | 895.3 |
| Net Income | 468.5 | 658.3 | 602.9 | 604.9 | 765.2 |
| Net Margin | 12.4% | 16.5% | 17.6% | 16.0% | 18.3% |
| Earnings Per Share | 2.06 $ | 2.91 $ | 2.65 $ | 2.66 $ | 3.45 $ |
Source: fundamental data & SEC filings (annual and quarterly reports, 10-K/10-Q)
Our Bottom Line at a Glance
- Balance sheet & liquidity positive
- As of June 27, 2026, $5.2 million in financial debt — by the company's own account, 0.1 percent of total capitalization — stands against $1,388.7 million in cash and $27.2 million in short-term investments. Of $4,257.3 million in total assets, only $683.3 million are liabilities, and equity is $3,547.8 million. In the second quarter of 2026, interest income of $11.0 million stood against interest expense of $134,000. The credit facility, refreshed in March 2026, covers only $100 million versus $400 million previously, and was unused (10-K 2025, 10-Q for the quarter ended 06/27/2026, 8-K filed 03/30/2026).
- Earnings quality & spread neutral
- The central theme: the company itself states that earnings and cash flow depend on the spreads between raw-material costs and selling prices. The operating margin rose from 7.9 percent (2019) to 22.9 percent (2025) and 23.0 percent on a trailing-twelve-month basis — the seven-year average sits at 17.6 percent. At the same time, gross margin fell to 27.7 percent from 31.0 percent in the second quarter of 2026, and at Piping Systems from 34.1 to 30.4 percent. Segment revenue there rose 27.3 percent while segment operating income fell 0.8 percent. The six earnings releases from Q1 2025 through Q2 2026 confirm this picture in management's own words: the company itself calls 2025 a record year despite "market conditions worsened compared to 2024" — the profit came from price, not from the hoped-for demand recovery.
- Growth & volume negative
- Revenue is growing on price, not volume. Of the $409.8 million revenue increase in 2025, $336.9 million came from higher selling prices and $243.2 million from the Nehring and Elkhart acquisitions, while core product unit volume fell $212.0 million. In the first half of 2026, $400.7 million in price effect stood against minus $13.0 million in volume. The end market is stagnant (1.36 million U.S. housing starts in 2025, down from 1.37 million), and the company itself names plastic as a substitute product with "an increasing share of consumption."
- Valuation neutral
- Price-to-earnings ratio of 15.7 per the data provider (our own calculation from the filings: roughly 16.4 at the $63.00 close on September 3, 2026) on trailing-twelve-month earnings of $3.84 per share; return on equity 28.3 percent per the data provider (our own cross-check: 24.0 percent against equity as of 06/27/2026); operating margin 23.0 percent. Against the seven-year average margin of 17.6 percent, earnings per share come to roughly $2.99 and the P/E to roughly 21; at 2019/2020 levels, roughly 39. This metric measures the durability of the margin here, not the price of the underlying business.
- Capital return positive
- The quarterly dividend rose, split-adjusted, from 7.5 cents (2023) through 10 cents (2024) and 12.5 cents (2025) to 17.5 cents per share in the first two quarters of 2026, up 40 percent within a year. On top of that, $243.6 million in buybacks in 2025 and $76.4 million in the first half of 2026; 39.2 of the authorized 80 million shares have been repurchased since 1999. Caveat: per the quarterly report filed 07/22/2026, the board's authorization ran through July 2026; whether it was extended again will only show up in the next quarterly report.
- Capital allocation & acquisitions positive
- All funded from cash, with no borrowed capital: $602.7 million for wire/cable maker Nehring and fittings maker Elkhart (2024), $138.3 million for copper tube maker Bison Metals Technologies (03/30/2026), and $3.9 million for Chicago Extruded Metals assets (06/12/2026). The Sherwood business was sold in the first quarter of 2026 for $57.0 million with a $41.4 million gain. Capital expenditure was $68.8 million (2025), guided to $80–90 million for 2026.
Mueller Industries manufactures copper tube, fittings, brass rod and cable, and has used the earnings boom since 2021 to build an exceptional balance sheet: as of June 27, 2026, $5.2 million in debt stands against $1.42 billion in cash and short-term investments, and $3,547.8 million in equity carries a balance sheet with only $683.3 million in liabilities. The stock's price, though, doesn't hang on the balance sheet — it hangs on the spread between buying copper and selling tube: in 2025, $336.9 million of the revenue gain came from higher prices and $243.2 million from acquisitions, while unit volume sold fell $212.0 million — and gross margin fell from 31.0 to 27.7 percent in the second quarter of 2026. At the September 3, 2026 close ($63.00), the stock trades at roughly 16 times current earnings (data provider: 15.7); at the seven-year average margin, roughly 21 times. Not investment advice.
What Our Rating Means
Quality confirmed
Business model, numbers and balance sheet hold up to our review. Whether the current price supports an entry is a separate question — it hangs on the price, not on the company.
Green, because company quality is documented on every single point and no finding cuts against it. Balance sheet: $5.2 million in debt — 0.1 percent of total capitalization — against $1.42 billion in cash and short-term investments, $3,547.8 million in equity against only $683.3 million in liabilities, a current ratio of 4.8 to 1, an Altman Z″-score of roughly 15.4 by our own recalculation against a safe-zone threshold of 2.6. Earnings: a 23.0 percent operating margin on a trailing-twelve-month basis, $850.5 million in net income, a 24 to 28 percent return on equity — and a positive annual result every year since at least 2009, including the financial crisis ($4.7 million in 2009) and the weak year of 2019 ($101.0 million). Capital allocation: four acquisitions since 2024, all funded from cash; the credit facility shrunk from $400 million to $100 million because it isn't needed; the dividend, split-adjusted, raised from 7.5 to 17.5 cents per quarter across three years. Governance: a single share class, no controlling shareholder, no dual-role conflicts, an annual meeting on 05/07/2026 with pure routine business, no going-concern doubt, no material litigation beyond the $5.1 million matter. The open questions in this analysis — spread dependency, a narrowing gross margin, a stagnant end market, substitution by plastic — are questions about how durable today's earnings level is, and therefore about price, not about the company's underlying substance. They show up in the verdict on the stock, not in the badge on the company.
A journalistic assessment by our editorial team at the time of the deep dive, based on public sources — not investment advice and not a solicitation to buy or sell. Your personal circumstances (investment goals, risk capacity, taxes) cannot be taken into account. What our levels mean, how verdicts are formed, and what conflicts of interest exist →
Worth Noting
- Mueller Industries reached our research list through the "QARP — Quality at a Reasonable Price" scanner (7th among U.S. names as of the original screening date, July 27, 2026). The filter requires five conditions simultaneously; as of the September 4, 2026 update, all still hold: Piotroski F-Score at least 7 (MLI: 7 of 9), return on equity at least 15 percent (28.3), operating margin at least 10 percent (22.9 in 2025, 23.0 trailing twelve months), debt-to-equity at most 1 (0.0015, from $5.2 million in debt against $3,547.8 million in equity), and a positive P/E capped at 20 (15.7). Additionally: fundamental rating 69 (grade B), three-year return of 79.3 percent per year.
- No verified word-for-word transcript of analyst conference calls is available for Mueller Industries — checked on 09/04/2026 through our internal transcript-source review and public research (no match found for MLI). The new management-commentary chapter therefore relies explicitly only on the prepared statements in the six earnings releases (8-K, Exhibit 99.1) and cannot evaluate the Q&A portion of the analyst calls.
- How we classified these findings: dependence of results on the spread between copper purchases and product sales, named "spreads" by the company itself = a price/cyclicality finding (weighs on the stock verdict, not an existential question). The gross-margin decline from 31.0 to 27.7 percent in the second quarter of 2026 alongside 25.5 percent revenue growth = a price/cyclicality finding with a clearly measurable turning point. The 2025 revenue gain from price ($336.9 mn) and acquisitions ($243.2 mn) against falling volume (minus $212.0 mn) = an earnings-quality finding, backed out in the text. One-time gains in reported results ($41.1 mn insurance and $25.9 mn asset sales in 2025, $41.4 mn from the Sherwood sale in Q1 2026) = an earnings-quality finding with no impact on substance. Plastic substitution in plumbing systems = a structural demand finding without a quantified size. No existential finding, no governance red flag — hence a green badge for the company and a watch stance for the stock.
- Altman Z″-score (thresholds: below 1.1 danger zone, 2.6 and above safe zone): the balance sheet supports the formula because it's cleanly split into current and long-term items. Our own recalculation as of 12/27/2025 from the annual report: net working capital $2,032.6 mn and retained earnings $3,761.6 mn on $3,733.0 mn in total assets, operating income $958.5 mn, equity $3,210.0 mn against $497.1 mn in liabilities — result roughly 15.4, well beyond the safe zone. Context: 6.8 of the 15.4 points come from the equity-to-liabilities ratio (6.5-to-1), 3.3 from retained earnings. The score documents how far the balance sheet sits from insolvency, not whether the margin holds.
- Market-cap cross-check (updated 09/04/2026): the data provider shows roughly $13.93 billion. Per the quarterly report's cover page, exactly 221,181,388 shares were outstanding as of 07/17/2026 — no more recent figure is available. 221,181,388 shares times the 09/03/2026 close ($63.00) yields roughly $13.93 billion — essentially matching the data provider, with no meaningful gap left as there was in July. Trailing-twelve-month earnings per share from the filings remain unchanged at $3.84 ($3.43 for split-adjusted 2025, minus $1.80 for first-half 2025, plus $2.21 for first-half 2026), yielding our own P/E of roughly 16.4 against 15.7 from the data provider — the small gap is most likely a different earnings basis on the provider's side. The June 29, 2026 2-for-1 split is reflected in both calculations. The only metric prone to distortion from the two splits (2023 and June 2026) remains the three-year return; the balance-sheet and earnings figures from the filings are reliable.
- Identity/legal form: Mueller Industries, Inc. (CIK 89439, Commission File 1-6770), incorporated in Delaware on 10/03/1990, headquartered in Collierville, Tennessee, listed on the NYSE. Reports as a U.S. issuer via 10-K, 10-Q and 8-K. Its fiscal year ends on the last Saturday of December (2025: 12/27/2025, 2026: 12/26/2026), with 13-week quarters. Not to be confused with the German Müller Group or with Mueller Water Products, Inc. (NYSE: MWA) — a separate, unrelated water-infrastructure company.
- Special-situation screen (EDGAR filing index, CIK 89439, updated 09/04/2026): no pending takeover, no strategic review, no rights plan, no active activist campaign. The most recent SC 13D/A remains the one filed 10/31/2024 by the GAMCO/Gabelli group; the individual stakes disclosed there are in the low single digits (Gabelli Funds LLC, 1.52 percent). The annual meeting on 05/07/2026 had exclusively routine business on the agenda. The only new filing of substance since the last quarterly report (07/22/2026) is the 8-K filed 08/10/2026 (event 08/06/2026, Item 5.02/8.01) with director Gary S. Gladstein's retirement announcement effective 12/31/2026 and the confirmed, unchanged 17.5-cent quarterly dividend — both routine, no bearing on this analysis. The Q3 2026 earnings report had not yet appeared as of this data date and is expected 10/20/2026 per the data provider; last year it appeared 10/21.
- Price and valuation figures updated to September 3/4, 2026 (original German-language publication: July 27, 2026); balance-sheet figures remain as of June 27, 2026 — no new quarterly report has appeared since the original article, so every cited financial figure is unchanged from July 2026 and was re-checked against the same filings. Analyses are evergreen; day-of prices are not a reason to buy. All per-share figures are adjusted for the June 29, 2026 2-for-1 split; the company's own quarterly report likewise restates prior-year comparatives on a split-adjusted basis. The 2019-through-2025 series comes from the respective annual reports; the trailing-twelve-month figures are our own calculation: fiscal 2025 annual report plus first-half 2026 minus first-half 2025.
Stock Watch
This analysis is as of September 4, 2026. Stock Watch will tell you what's changed at MLI since then.
Later $1 a month per stock — signing up is free, and you'll be the first to know when it launches.
The full analysis as a PDF for later
We will send you this analysis as a PDF — to print, file away, and read at your own pace. And we will add you to the free Stock Watch list for Mueller Industries Inc (MLI), so you hear about it when something material in this analysis changes.
Frequently Asked Questions
Mueller Industries, Inc. (NYSE: MLI) manufactures copper tube, fittings, refrigerant lines, brass rod, forgings and extrusions, wire and cable solutions, and refrigeration valves. It reports in three segments: Piping Systems, Industrial Metals and Climate. The end market is mostly U.S. residential and commercial construction plus repair and renovation.
Because copper is the largest cost item and selling prices move with it. The 2025 annual report states that earnings and cash flow depend on the spreads between raw-material costs and selling prices. The COMEX copper price averaged $3.86 per pound in 2023, $4.81 in 2025, and $6.16 in the second quarter of 2026.
Practically not. As of June 27, 2026, the balance sheet showed $5.2 million in debt — by its own account, 0.1 percent of total capitalization; at year-end 2025 it was zero. Against that stand $1,388.7 million in cash and $27.2 million in short-term investments. The $100 million credit facility was unused.
Because the earnings in the denominator rest on a record margin. At the September 3, 2026 close ($63.00), our own P/E works out to roughly 16.4 (data provider: 15.7) against a 23.0 percent operating margin, versus a seven-year average of 17.6 percent. If that margin reverts to the average, earnings per share fall from $3.84 to roughly $2.99 and the price-to-earnings ratio rises to roughly 21. At 2019/2020 levels, it would be roughly 39.
In dollars, yes; in volume, barely. In 2025, revenue rose 10.9 percent to $4,178.5 million: plus $336.9 million from higher selling prices and plus $243.2 million from the Nehring and Elkhart acquisitions, but minus $212.0 million from lower unit volume in core products. Without the price effect and the acquisitions, revenue would have fallen.
No verified word-for-word transcript of the analyst calls is available for Mueller Industries. Across the six earnings releases from Q1 2025 through Q2 2026, the CEO repeats an expected U.S. residential-construction recovery for five straight quarters — one that hasn't yet materialized — while the tone on tariffs shifted from defensive to offensive. The company itself called 2025 a record year despite "market conditions worsened compared to 2024" — confirmation that the profit came from price, not from the market.
Yes, quarterly and growing. Split-adjusted, it was 7.5 cents per share in 2023, 10 cents in 2024, 12.5 cents in 2025, and 17.5 cents in the first two quarters of 2026. Annualized, that's 70 cents. The company also repurchased $243.6 million of its own stock in 2025 and another $76.4 million in the first half of 2026.
On March 30, 2026, copper tube maker Bison Metals Technologies of Shawnee, Oklahoma for roughly $138.3 million, and on June 12, 2026, extrusion assets of Chicago Extruded Metals for roughly $3.9 million. In 2024, wire and cable maker Nehring and fittings maker Elkhart were added for a combined $602.7 million. All of it was paid from cash.
Found an error?
Did you spot a factual error, an outdated number, or a typo in this deep dive? Let us know briefly — your report goes straight to the editorial team.