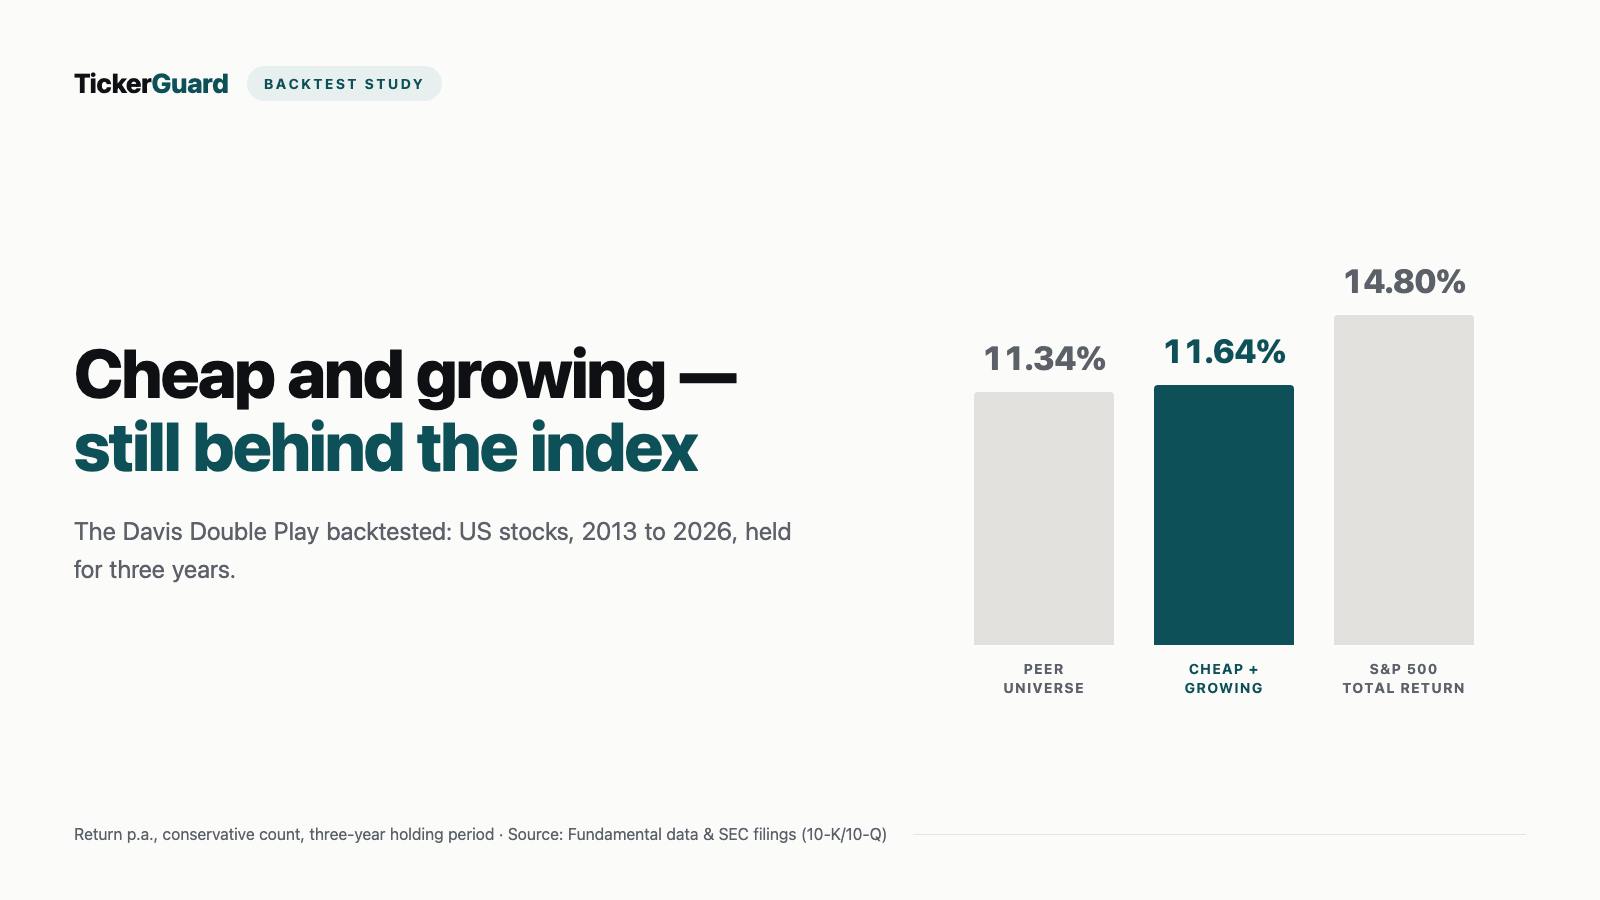
Davis Double Play Backtest: Cheap and Growing Returns 11.64% a Year — the S&P 500 Returns 14.80%
Between 1947 and 1994 Shelby Cullom Davis turned $50,000 into nearly $900 million — roughly 23 percent a year over 47 years. His recipe carries his name: buy a stock at a low earnings multiple whose earnings are growing, and count on both engines firing at once. We backtested that mechanism across 161 months and several thousand US stocks, with a three-year holding period, a strict point-in-time rule, and a return decomposition that splits every closed trade into its two engines. The result is clear and uncomfortable: no arm beats the S&P 500 Total Return, the main cell sits just 0.31 percentage points ahead of its own peer universe — and the decomposition shows not Davis’ double boost but valuation reverting to the mean.
 Thomas Mücke
Founder & Publisher
Thomas Mücke
Founder & Publisher
The question: does the double boost that carried Shelby Davis for 47 years hold up?
Shelby Cullom Davis was 38 when, in 1947, he left his post as First Deputy Superintendent of Insurance for New York State and went into the market with $50,000 of his wife's money. When he died in 1994 he left behind nearly $900 million, mostly in trusts — roughly 23 percent a year over 47 years. His recipe carries his name and fits in one sentence: buy a stock at a low earnings multiple whose earnings are growing.
The question here is not whether Davis was successful — that is documented. The question is whether the MECHANISM holds up when applied as a rule to a broad US equity universe: does "cheap AND growing" beat its own universe, the index and the two counter-cells — and does it do so in the financial sector, Davis' own territory?
The result in four numbers
Does the mechanism Shelby Davis used to turn $50,000 into nearly $900 million hold up as a rule on US stocks from 2013 to 2026? We recalculated it — and then split the return into its two engines.
- 11.64% a year is what the main cell "cheap AND growing" returned at a three-year holding period on the conservative count — 3.15 points behind the S&P 500 Total Return of the same window (14.80%).
- 0.31 points is the lead over its own peer universe (11.34%) — the only benchmark that contains exactly the companies the rule selects from. That is too little for a strategy.
- 0.2986 against -0.0633: that is how the valuation engine and the earnings engine stand to each other in the main cell (medians of the log contributions). The multiple carries while earnings fall — the signature of mean reversion, not of a double boost.
- 15.3% of the closed trades are a true double play with two positive engines — no more than in the other arms. The rule does not produce the double boost any more often than the universe.
No arm in this backtest beats the index, and the decomposition reveals a different mechanic from the one it was looking for. Shelby Davis' historical success rested on things this recipe does not capture.
What the "Davis Double Play" is
The term was Davis' own; it is handed down in John Rothchild's family biography The Davis Dynasty. It describes a twofold boost in which two engines fire in sequence:
"Davis called this sort of lucrative transformation ‘Davis Double Play.’ As a company’s earnings advanced, giving the stock an initial boost, investors put a higher price tag on the earnings, giving the stock a second boost."
— John Rothchild, The Davis Dynasty, Wiley 2001.
How strongly that can multiply is shown by Davis' own numerical example from his home sector:
"In 1950, insurance companies sold for four times earnings. Ten years later, they sold for 15 to 20 times earnings, and their earnings had quadrupled."
— John Rothchild, The Davis Dynasty, Wiley 2001.
Earnings times four and the multiple times four or five gives a share price times 16 to 20 in a decade. That interplay is the thesis — and it is exactly what a return decomposition can measure.
Three things belong alongside it from the start, otherwise the test turns into a legend. First, it was really a triple play: Davis permanently held roughly half his positions on margin, so about two-times leverage, and deducted the margin interest against his dividend income. An unleveraged backtest therefore deliberately captures only two of three return sources. Second, that leverage had a downside: in the 1973/74 bear market Davis' fortune fell from around $50 million to around $20 million, a drop of roughly 60 percent. Third, he held for decades, not years — the line handed down is that his best decisions were never to sell. The main mode here holds for three years; that is the longest holding period a thirteen-and-a-half-year window sensibly supports, and it is still a shortening.
On the starting capital there are two figures, and we name both: the family biography speaks of $50,000 of his wife's money, the New York Times obituary of $100,000 in firm capital. The two need not contradict each other — a private portfolio and a firm's capital are different things — but without the full text of the book the question cannot be settled.
How we measured
Everything that follows was fixed before the first return was calculated: universe, metrics, arms, exit, decomposition, sweeps and benchmarks were written down and committed in advance. That is the difference between a measurement and a search for the number that looks best.
- Universe. All companies filing mandatory quarterly reports with the US securities regulator and carrying their own price series. Entries monthly from January 2013 to June 2026; the cohort month is the fourth month after quarter-end (the filing-deadline convention).
- Point in time, strict. A row may feed a cohort month only if ALL its source rows — earnings, share count, equity — were filed before the start of that month. What counts is the latest of those filing dates, and strictly before, never "on the same day".
- Valuation multiple. Raw month-end price times the diluted share count of the most recent available quarter, divided by net income over the last four gapless quarters. Those four quarters must together span 250 to 400 days, otherwise the metric is undefined. Non-positive earnings exclude the row — a company at a loss has no price-to-earnings ratio.
- Growth. Earnings per share over the last four quarters against the four quarters before that. Growth above zero counts as "growing"; a swing from loss to profit counts too.
- The six arms.
univis the reference set of all companies with a defined multiple.d0is the bottom tercile (cheap),d1everything growing,d2the main thesis combining both. Plus two counter-cells:teuer_wachsend(top tercile and growing) andbillig_schrumpfend(bottom tercile, not growing). Tercile boundaries are formed per cohort by rank, not by fixed values. - Exit and costs. Main mode three years; twelve and 24 months plus stops at minus 20 and minus 30 percent run as sensitivities. Equal weighted, 0.1% cost per side, minimum raw price 1 dollar. One position per company; re-entry only after the exit.
- Two prices, two purposes. Portfolio returns run on adjusted prices (splits and dividends included), valuation metrics exclusively on raw prices. Mixing the two produces ratios that never existed.
- Conservative headline figure. The price history carries reverse splits that were never backfilled. The conservative twin series therefore caps MONTHLY returns above 200%, never the total return — a position that honestly earns 400 percent over three years keeps its 400 percent. This study quotes the conservative figure throughout.
- Every subset, its own benchmark. Arms and sectors have different final exit months. A shared benchmark over the longest span would be a window-selection error, so every row carries the benchmark of EXACTLY its own window. Annual returns are chained, never averaged.
What never even gets to play
566,521 rows across 162 cohort months were eligible at all, 263,069 of which had a defined valuation multiple. The filter effect is not a footnote, it is half the measurement:
| Exclusion reason | Rows |
|---|---|
| no price in the cohort month | 15,675 |
| placeholder instead of a real price | 6,270 |
| no share count | 65,476 |
| four-quarter earnings incomplete or span violated | 61,540 |
| four-quarter earnings not positive | 154,491 |
| remaining: with a defined valuation multiple | 263,069 |
The largest single item is the concept working as designed, not a data fault: Davis requires positive earnings. Counted separately — as properties, not exclusion reasons, and multiple counting is possible — there are 59,424 rows with a raw price below one dollar, 110,291 without a growth base, 59,437 flagged for a suspected split and 58,133 without a sector classification. The price filter deliberately sits outside the exclusion chain: the multiple of a fifty-cent stock is defined, it is simply not bought by this backtest.
The result: no arm clears the index
The main cell d2 — cheap AND growing, held for three years — returns 11.64% a year on the conservative count over 161 months. The S&P 500 Total Return over exactly the same window returns 14.80%. That is 3.15 percentage points behind per year, and that gap is the benchmark an investor actually has to clear.
| Arm | Positions | Names per month | p.a. raw | p.a. conservative | p.a. floor | S&P 500 TR | All price series | Max drawdown |
|---|---|---|---|---|---|---|---|---|
billig_schrumpfend (cheap and shrinking) | 2,599 | 518 | 12.45% | 11.92% | 9.23% | 14.80% | 4.57% | -42.30% |
d0 (cheap only) | 5,847 | 1,133 | 11.85% | 11.40% | 8.01% | 14.80% | 4.57% | -37.37% |
d1 (growing only) | 8,393 | 1,635 | 12.15% | 11.76% | 8.55% | 14.80% | 4.57% | -32.44% |
d2 (cheap AND growing — thesis) | 4,790 | 952 | 12.10% | 11.64% | 8.29% | 14.80% | 4.57% | -37.00% |
teuer_wachsend (expensive and growing) | 4,078 | 802 | 12.28% | 11.81% | 8.30% | 14.80% | 4.57% | -30.21% |
univ (peer universe) | 10,360 | 1,974 | 11.75% | 11.34% | 8.03% | 14.80% | 4.57% | -32.59% |
Three things sit side by side in this table, and they say different things. Against its own universe running the same filters (11.34%) the thesis is 0.31 percentage points ahead — that is the honest comparison, because this universe contains exactly the companies the rule selects from. A fraction of a percentage point is too little to build a strategy on, even though the rule filters out roughly four in five stocks of the universe to get there. The large gap to the equal-weighted total price universe (4.57%) is by contrast NOT a merit of the rule: that set contains every micro cap and every sub-dollar stock this backtest excludes from the outset.
What is striking is how close the arms sit together. Less than one percentage point separates the expensive counter-cell (11.81%) from the cheapest arm without growth (11.92%) — and the expensive counter-arm sits slightly AHEAD of the thesis. Anyone trying to build a selection rule out of these numbers would have noise, not signal.
The "floor" column is not an alternative calculation but an artificial bracket: it books EVERY delisting as a total loss. The truth sits between the two tracks, and further below there is one case each showing why it cannot be done otherwise.
The core: where the return actually came from
This is where a return comparison turns into an answer to the real question. For every closed trade the market-capitalisation return decomposes exactly into its two engines — the identity holds algebraically and is split-immune, because the split factor cancels out of both factors:
ln(MC1 / MC0) = ln(E1 / E0) + ln(PE1 / PE0)
On the left the log return of market capitalisation, on the right the earnings enginegand the valuation enginem. Checked across all trades, largest deviation 5.99 · 10−14 against a bound of 1.00 · 10−9 — 0 breaks.
The only mean reported in the tables is the trimmed mean (winsorised at the 2.5th and 97.5th percentile). The unwinsorised means are deliberately left out: individual trades with log returns above three move them by more than the statement they are meant to carry. Medians are unwinsorised — they do not need it.
| Arm | Trades | Decomposed | Median g | Median m | Median sum | Trimmed g | Trimmed m | Trimmed sum |
|---|---|---|---|---|---|---|---|---|
billig_schrumpfend (cheap and shrinking) | 2,005 | 1,425 | 0.0283 | 0.2217 | 0.2110 | -0.0841 | 0.3240 | 0.2344 |
d0 (cheap only) | 4,760 | 3,304 | -0.0427 | 0.3283 | 0.2309 | -0.1799 | 0.6281 | 0.4532 |
d1 (growing only) | 6,780 | 4,933 | 0.2238 | -0.0040 | 0.2052 | 0.2701 | -0.0849 | 0.1993 |
d2 (cheap AND growing — thesis) | 3,891 | 2,745 | -0.0633 | 0.2986 | 0.1879 | -0.2050 | 0.4086 | 0.1976 |
teuer_wachsend (expensive and growing) | 3,263 | 2,298 | 0.5831 | -0.3755 | 0.2172 | 0.7942 | -0.5953 | 0.2156 |
univ (peer universe) | 8,440 | 6,091 | 0.2714 | -0.0178 | 0.2382 | 0.3469 | -0.1084 | 0.2363 |
This is the finding of the study, and it is not the expected one. In the main cell the MULTIPLE carries (median 0.2986) while earnings FALL (median -0.0633). In the expensive counter-arm it is the exact reverse: there earnings carry (0.5831) while the multiple falls (-0.3755). The two patterns are mirror images — and that is what mean reversion looks like, not a double play.
The difference is more than a turn of phrase. In a double play both engines push the same way and multiply each other; under mean reversion one engine offsets what the other loses. In this window, trades bought cheap were handed a median valuation recovery and paid for it with shrinking earnings. Trades bought expensive showed earnings growth in the same window and paid for it with a shrinking valuation. On balance the two come out almost the same — which explains the tightly packed return table above.
That leaves the question of how often the real double boost occurs at all. We count it per trade: a "true double play" means both engines are positive; a "valuation trap" means the multiple falls; "earnings evaporated" means there were no positive earnings left at the exit and the decomposition is undefined. A trade with a rising multiple and fallen earnings is NEITHER, and sits under "other".
| Arm | Double play | Valuation trap | Earnings evaporated | Other | No exit data | Portfolio p.a. cons. | S&P 500 TR | All price series |
|---|---|---|---|---|---|---|---|---|
billig_schrumpfend (cheap and shrinking) | 15.6% | 25.7% | 20.7% | 29.8% | 8.2% | 11.92% | 14.80% | 4.57% |
d0 (cheap only) | 16.6% | 20.5% | 22.1% | 32.3% | 8.4% | 11.40% | 14.80% | 4.57% |
d1 (growing only) | 14.4% | 36.9% | 19.3% | 21.5% | 7.9% | 11.76% | 14.80% | 4.57% |
d2 (cheap AND growing — thesis) | 15.3% | 21.6% | 21.0% | 33.7% | 8.4% | 11.64% | 14.80% | 4.57% |
teuer_wachsend (expensive and growing) | 10.6% | 48.9% | 21.7% | 10.9% | 7.8% | 11.81% | 14.80% | 4.57% |
univ (peer universe) | 14.2% | 37.1% | 19.8% | 20.9% | 8.0% | 11.34% | 14.80% | 4.57% |
In the main cell 15.3% of the closed trades are a true double play. Across all six arms of the broad market the share ranges from 10.6% to 16.6% — the main cell is unremarkable within it. Put differently: the rule "cheap and growing" does not produce the double boost any more often than the universe it selects from. Both the valuation trap (21.6%) and evaporated earnings (21.0%) are more common in the main cell than the double boost itself.
The last columns of the table are there on purpose: the decomposition runs on market capitalisation, and that is NOT the shareholder return. Buybacks reduce the share count, capital raises increase it; both shift company and shareholder return against each other. Only the total-return portfolio series on adjusted prices contains splits AND dividends. And the underlying sets are not identical: the monthly series also contains the later cohorts still open at the end of the grid (899 positions in the main cell alone) — the decomposition only knows the closed ones.
Three cases recalculated by hand
A calculation over hundreds of thousands of positions can be right everywhere and wrong in one place — and an error that improves the return raises no exception anywhere. The only cross-check that catches it is the single case a human can recalculate. Three cases from the main cell, each rebuilt from its own factors:
| Case | Entry / exit | Multiple at entry | Return | Floor | g | m | Category | What the case shows |
|---|---|---|---|---|---|---|---|---|
| Apple (AAPL) | 2013-01 / 2016-01 | 10.32 | 58.93% | 58.93% | 0.2464 | 0.0233 | true double play | Both engines fired, the decomposition reconciles exactly. |
| Stamps.com (STMP) | 2019-02 / 2021-09 | 10.77 | 250.18% | -100.00% | 0.1672 | 1.1190 | true double play | Takeover: almost the entire valuation m is premium, not a re-rating. |
| Casa Systems (CASA) | 2021-11 / 2024-03 | 14.52 | -94.53% | -100.00% | undefined | undefined | earnings evaporated | Real collapse: no positive earnings at the exit, decomposition undefined. |
The first case is the normal one: at Apple both engines fired, earnings contributed 91.4% of the log return and the multiple 8.6% — a true double play, and the identity reconciles down to the fifteenth decimal.
The other two cases show the same data pattern with opposite truths. Stamps.com and Casa Systems both collapse by more than 95 percent in the adjusted price series, each in the month after the exit (from 329.79 to 0.0250 dollars and from 0.2736 to 0.0068 dollars respectively). A factor like that in an ADJUSTED series is not a market event but a break in the adjustment chain — the position therefore ends at the last reliable price. Except: at Stamps.com the shareholders were paid out in cash, at Casa Systems they lost almost everything. The price path cannot tell them apart. That is why the two tracks in this study bracket the case instead of declaring one of the two readings to be the truth.
The takeover case shows one more thing: 87.0% of its log return falls to the multiple — except that multiple sits almost entirely in the takeover premium, because the last reliable price is practically the cash price. The trade formally counts as a "true double play" even though it was no market re-rating at all. The decomposition cannot distinguish a takeover from a re-rating; anyone reading the double-play shares in this study has to keep that share in mind.
Calculation-basis sweep: how much rides on the definition?
The pre-registered definition — bottom tercile, growth hurdle above zero, three years — is and remains the headline row. The sweep says how much rides on it; it does not replace it. Two axes are varied: basket granularity (tercile versus quintile) and the growth hurdle (above zero versus above ten versus above twenty percent).
| Cell | Basket | Growth hurdle | Positions | Names per month | p.a. raw | p.a. conservative | S&P 500 TR |
|---|---|---|---|---|---|---|---|
d0 (cheap only) (pre-registered) | Tercile | none | 5,847 | 1,133 | 11.85% | 11.40% | 14.80% |
d2 (cheap AND growing — thesis) (pre-registered) | Tercile | above 0% | 4,790 | 952 | 12.10% | 11.64% | 14.80% |
sw_t_h10 | Tercile | above 10% | 3,844 | 780 | 12.50% | 12.24% | 14.80% |
sw_t_h20 | Tercile | above 20% | 3,526 | 713 | 12.63% | 12.33% | 14.80% |
sw_q_billig | Quintile | none | 4,271 | 823 | 12.04% | 11.42% | 14.80% |
sw_q_h0 | Quintile | above 0% | 3,343 | 668 | 11.83% | 11.20% | 14.80% |
sw_q_h10 | Quintile | above 10% | 2,587 | 507 | 12.18% | 11.76% | 14.80% |
sw_q_h20 | Quintile | above 20% | 2,402 | 481 | 12.39% | 11.92% | 14.80% |
Two lessons sit in there. Finer baskets add nothing — the best quintile reaches 11.92%, the best tercile 12.33%. The tougher growth hurdle does add something: from 11.64% without a percentage hurdle up to 12.33% with a hurdle of twenty percent. That fits Davis, who explicitly sought neither the lowest multiples nor the fastest growers but the combination of both. It does not change the finding, though: even the best cell in the entire sweep stays 2.46 percentage points behind the S&P 500 Total Return of the same window.
One methodological difference belongs with it: the percentage hurdles compute on the growth RATE and exclude rows with a non-positive prior-year base — "50 percent more than minus two dollars" is meaningless. The headline row computes on the DIFFERENCE and keeps them. This affects 12,961 of 85,923 rows in the bottom tercile; the hurdle arms are therefore not merely stricter, they also stand on a slightly different underlying set.
Cross-check in the financial sector — Davis' own territory
Davis was an insurance specialist, not a generalist. If the mechanism had to work anywhere, it would be here. The chapter is nonetheless explicitly DESCRIPTIVE and not equal in rank: the whole data set holds only 397 financial common stocks with quarterly earnings under US accounting rules, and around a hundred names per cohort clear every filter. Quintiles would produce cells of 18 to 30 names whose returns would be dominated by individual stocks — which is why this chapter works exclusively with terciles.
| Arm | Positions | Names per month | p.a. raw | p.a. conservative | p.a. floor | S&P 500 TR | All price series | Max drawdown |
|---|---|---|---|---|---|---|---|---|
billig_schrumpfend (cheap and shrinking) | 189 | 33 | 6.72% | 6.72% | 4.29% | 14.80% | 4.57% | -47.61% |
d0 (cheap only) | 359 | 65 | 9.67% | 9.67% | 6.77% | 14.80% | 4.57% | -42.48% |
d1 (growing only) | 513 | 90 | 10.44% | 10.44% | 6.95% | 14.80% | 4.57% | -37.71% |
d2 (cheap AND growing — thesis) | 292 | 53 | 8.55% | 8.55% | 5.67% | 14.80% | 4.57% | -43.74% |
davis_proxy (book value instead of earnings) | 258 | 50 | 8.98% | 8.98% | 6.11% | 14.80% | 4.57% | -47.93% |
teuer_wachsend (expensive and growing) | 238 | 38 | 12.22% | 12.22% | 6.91% | 14.80% | 4.57% | -28.62% |
univ (peer universe) | 640 | 111 | 10.55% | 10.55% | 7.17% | 14.80% | 4.57% | -36.19% |
The finding is sharper than in the broad market, only in the other direction: the thesis returns 8.55% a year against 10.55% for the financial universe — it sits 2.00 percentage points BEHIND. The Davis proxy, which anchors on book value rather than earnings (bottom tercile of price-to-book plus growing book value) and comes closer to Davis' actual approach with insurers, only reaches 8.98%. Ahead of the field sits, of all things, the expensive counter-cell at 12.22%.
Two limitations are larger here than elsewhere and bound what this chapter may claim. First: The cells are thin. Across the broad market the 161 months of the main cell carry a median of 952 names and not a single month below ten; in the financial sector the median is only 53 names, and in 3 months the return measured individual stocks rather than the rule. Second, this chapter tests the mechanic, not insurance expertise. The combined ratio, the investable float built from premiums, and the quality of loss reserves are what Davis judged — the data set does not carry those figures. Earnings under accounting rules can mask a bad combined ratio for years.
Sensitivities: holding period, stops and the floor
Does the finding hang on the three-year holding period? On the treatment of delistings? The sensitivities test both for every arm of the broad market.
| Arm | 12 months | 24 months | 36 months (main) | Stop -20% | Stop -30% | Floor (3 yrs) | S&P 500 TR |
|---|---|---|---|---|---|---|---|
billig_schrumpfend (cheap and shrinking) | 10.55% | 11.67% | 11.92% | 10.66% | 11.30% | 9.23% | 14.80% |
d0 (cheap only) | 10.84% | 11.37% | 11.40% | 11.20% | 11.49% | 8.01% | 14.80% |
d1 (growing only) | 11.73% | 12.08% | 11.76% | 11.69% | 11.49% | 8.55% | 14.80% |
d2 (cheap AND growing — thesis) | 10.97% | 11.59% | 11.64% | 11.30% | 11.21% | 8.29% | 14.80% |
teuer_wachsend (expensive and growing) | 11.61% | 11.70% | 11.81% | 12.50% | 11.71% | 8.30% | 14.80% |
univ (peer universe) | 11.42% | 11.58% | 11.34% | 11.35% | 11.36% | 8.03% | 14.80% |
The holding period moves little: across twelve, 24 and 36 months all arms stay in a narrow band, and none reaches the index in any mode. Even with stops no cell beats the index; against the plain holding periods the stops shift the picture only marginally — a few cells sit slightly above, most slightly below. The stop figures must be read explicitly as an APPROXIMATION: they are tested on month-end closes. A daily stop would have sold earlier and at a different price; the stop figures are therefore not tradable results but a direction of travel.
The "floor" track is the harshest assumption that can be formulated: it books EVERY delisting as a total loss and pushes the main cell from 11.64% down to 8.29%. It is an artificial FLOOR and explicitly not an alternative result — the two tracks bracket the uncertainty instead of declaring one of the two readings to be the truth. The three cases above show why: the same data pattern carries two opposite truths.
Cross-check: does the ranking hang on the share count?
The valuation multiple stands or falls with the share count in the numerator. The main calculation takes the diluted share count from the same row as earnings and the filing date — a timing offset between numerator and denominator is therefore structurally impossible. That figure is, however, a period average: for companies that issue or buy back heavily mid-quarter it differs from the point-in-time count. A second, independent source with point-in-time counts therefore runs as a cross-check — not as the main source, because it would have halved the cohorts.
| Sample month | Cohort with a multiple | Intersection | Rank correlation | Same tercile | Same bottom tercile | Share-count ratio (median) |
|---|---|---|---|---|---|---|
| 2015-06 | 1,715 | 953 | 0.9594 | 95.59% | 95.27% | 0.9972 |
| 2018-06 | 1,654 | 974 | 0.9763 | 97.33% | 97.22% | 0.9967 |
| 2022-06 | 1,748 | 1,084 | 0.9757 | 96.59% | 97.51% | 0.9967 |
The ranking is practically identical: rank correlation exceeds 0.95 in all three sample months, and in more than 95 percent of cases a company lands in the same tercile. The error works in the same direction at entry and exit and largely cancels out in the CHANGE of the multiple — precisely the quantity the decomposition computes on.
What the checks say
- Chaining. Chained calendar years must reproduce the total return exactly. Largest deviation across all portfolios: 1.14 · 10−12 percentage points — pure floating-point arithmetic.
- Decomposition identity. Largest deviation 5.99 · 10−14 against a bound of 1.00 · 10−9, 0 breaks across all decomposed trades.
- Benchmark series. Not one benchmark series has a gap in its window. A gap here would mean comparing two series of different length — the error that once manufactured an edge in this series.
- Portfolio ledger. Positions plus discards reconcile exactly to the signal months in every portfolio, 0 breaks. No signal month disappears silently.
- Filter ledger. Exclusion reasons plus rows with a defined multiple reconcile exactly to the row count (566,521 against 566,521).
What this study does not say
- It does not disprove Shelby Davis. What is tested is the mechanism, not the original strategy. Davis ran roughly two-times leverage on margin, held for decades rather than three years, deferred taxes for decades by never selling, judged executives in person, and bought at the entry valuations his home sector offered around 1950: insurers at three to four times their earnings. This backtest measures two of three return sources.
- 2013 to 2026 was a drought for cheaply valued stocks. A weak result for the valuation half of the double play is therefore not readily transferable to other regimes. That belongs in every conclusion — including this study's.
- Combined ratio and investable float from premiums are missing. The data set does not carry those figures. The financial-sector chapter tests the mechanic, not insurance expertise, and it is descriptive rather than equal in rank.
- The sector classification is TODAY's classification. For earlier cohorts that is a look-ahead: a company classed as a financial today may not have been one in 2013. For the financial-sector chapter this is the biggest methodological weakness.
- The decomposition measures market capitalisation, not shareholder return. Buybacks and capital raises shift the two against each other; dividends sit exclusively in the total-return series on adjusted prices. That is why this series stands next to every decomposition row.
- A takeover cannot be separated from a re-rating. The Stamps.com case above shows it: almost the entire valuation
mthere sits in the takeover premium, and the trade formally counts as a "true double play". Anyone reading the double-play shares in this study has to keep that share in mind. - The share count of the main calculation is a period average. For companies that issue or buy back heavily mid-quarter it differs from the point-in-time count. The cross-check above shows the ranking is barely affected — it does not show that every single row is correct.
- The stop figures are tested on month-end closes. A daily stop would have sold earlier and at a different price. They are an approximation and labelled as one.
- The universe is filers with the US securities regulator carrying their own price series. Of 566,521 rows, 263,069 carry a defined valuation multiple; 58,133 rows have no sector classification and are reported rather than silently dropped.
- No scanner, by design. No live tool follows from this backtest, and there is no approval for one.
- A backtest is not a forecast. This study is market research, not investment advice and not a buy recommendation.
What remains
The thesis failed on its own numbers. "Cheap and growing" returns 11.64% a year against 14.80% for the index over the same window and sits a mere 0.31 points ahead of its own peer universe. Neither finer baskets nor a tougher growth hurdle nor a different holding period nor Davis' own territory turns that around.
And the decomposition says why. What carries the return in the main cell is not a double boost from two aligned engines but valuation reverting to the mean — paid for with falling earnings. The true double play does occur, but no more often than in the universe. That is a different finding from "the rule returns too little": it measures something other than what its name promises.
What carried Davis' success is not what this recipe captures. Decades of patience rather than three years, insurance expertise rather than ratios, roughly two-times leverage, tax deferral through never selling — and entry valuations like the three to four times earnings at which insurers could be had around 1950. Tracing "23 percent a year over 47 years" back to a two-ratio rule confuses the outcome with its cause.
No live scanner comes out of this backtest, deliberately. Related valuation approaches on the same universe are the Magic Formula backtest, which combines earnings yield and return on capital, the Neff formula backtest, which sets growth and dividend against the multiple, and the Graham Net-Net backtest as the strictest asset-value variant. More backtest studies in this series live together under Studies.
Figures as of August 10, 2026.
This article is a historical analysis of publicly available price and fundamental data and not investment advice. It contains no buy or sell recommendation and no forecast; individual companies named in it serve solely to illustrate historical price and accounting patterns. Past results — whether simulated or real — are not a reliable indicator of future returns. Anyone making investment decisions should assess their own situation and risks, if in doubt with professional advice.
Frequently Asked Questions
The term comes from John Rothchild's family biography "The Davis Dynasty" and describes a twofold boost: a company's earnings rise and give the stock a first push, after which investors attach a higher price tag to those higher earnings — the second push. A cheap entry is the precondition, because only from a low multiple can the multiple still expand.
Not in this backtest. The pre-registered main cell (bottom P/E tercile plus growing earnings per share, held for three years) returns 11.64% a year on the conservative count, while the S&P 500 Total Return over exactly the same window returns 14.80%. That is 3.15 percentage points behind per year, and none of the other arms clears the index either.
Barely. The universe running the same filters returns 11.34% a year, the main cell 11.64% — a difference of 0.31 percentage points. For a selection rule that imposes two conditions and filters out roughly four in five stocks of the universe in doing so, that is not a workable edge.
It splits every closed trade exactly into its two engines: earnings growth and change in the multiple. In the main cell the multiple carries (median 0.2986) while earnings fall (-0.0633); in the expensive counter-arm earnings carry (0.5831) while the multiple falls (-0.3755). That exact mirror image is the signature of mean reversion, not of the double play, in which both engines fire together.
Both engines are positive at once in 15.3% of the main cell's closed trades. "Earnings evaporated" (21.0%) and the valuation trap (21.6%) are both more common. The share is similar across all arms — the main cell does not produce the double boost any more often than the universe it selects from.
No — there it actually trails: 8.55% a year against 10.55% for the financial universe. The Davis proxy built on book value only reaches 8.98%. The chapter is explicitly descriptive: only about a hundred names per cohort clear every filter, and metrics such as the combined ratio or the investable float from premiums are not carried in the data.
Because this backtest tests the mechanism, not the original strategy. Davis ran roughly two-times leverage on margin, held for decades rather than three years, judged insurers with specialist knowledge no ratio captures, and bought at the entry valuations of the 1940s and 1950s. The backtest measures two of three return sources in a window that was unusually weak for cheaply valued stocks.
No, by design. A recipe that misses the index by more than three points a year over thirteen years and sits a fraction of a point ahead of its own peer universe does not become a tool here. There is no approval for a Davis scanner.


