Neff Formula Backtest: The Windsor Rule Doesn't Beat the S&P 500 — But Its Ratio Beats a Naive P/E
John Neff ran the Vanguard Windsor Fund ahead of the S&P 500 for 31 years — with a low P/E, moderate earnings growth, and dividend yield, bundled into a single metric: the total-return ratio. We backtested his original recipe across 13.5 years and several thousand US stocks, using a cohort entry four months after quarter-end and three different growth bases. The result is not a clean yes or no: the Windsor rule itself does not reliably reach the S&P 500 Total Return (15.02% per year) — but Neff's numerator of growth and dividend demonstrably adds something over a naive cheap P/E alone. The core idea holds up even where the full recipe falls short of the market.
 Thomas Mücke
Founder & Publisher
Thomas Mücke
Founder & Publisher
The Question: Does the Formula That Made Neff Beat the Market for 31 Years Hold Up?
John Neff ran the Vanguard Windsor Fund from June 30, 1964 to October 31, 1995 — 31 years in which the fund returned 13.7% per year against 10.6% for the S&P 500, an edge of 3.1 percentage points a year. $10,000 grew to more than $564,000, against roughly $233,000 in the index. His recipe was famously unglamorous: a low P/E, moderate earnings growth between 7% and 20%, dividend yield as a cushion — bundled into a single metric, the total-return ratio: earnings growth plus dividend yield, divided by the P/E.
Does that recipe hold up outside Neff's own track record — on a broad, survivorship-free US stock universe from 2013 to 2026? And the deeper question behind it: does Neff's numerator (growth plus dividend) really add something over a naive cheap P/E, or does the P/E alone end up doing all the work?
The Result in Four Numbers
Does the formula that kept John Neff's Vanguard Windsor Fund ahead of the market for 31 years hold up on US stocks from 2013 to 2026? We backtested his original recipe.
- 8.06% per year is what the Windsor rule returned on its primary basis (TTM growth, conservative count) — 5.72 points behind the S&P 500 Total Return (15.02%).
- 13.53% is what the same rule returned on a 3-year growth basis — essentially tied with the S&P 500 and 3.77 points above the study's own peer universe.
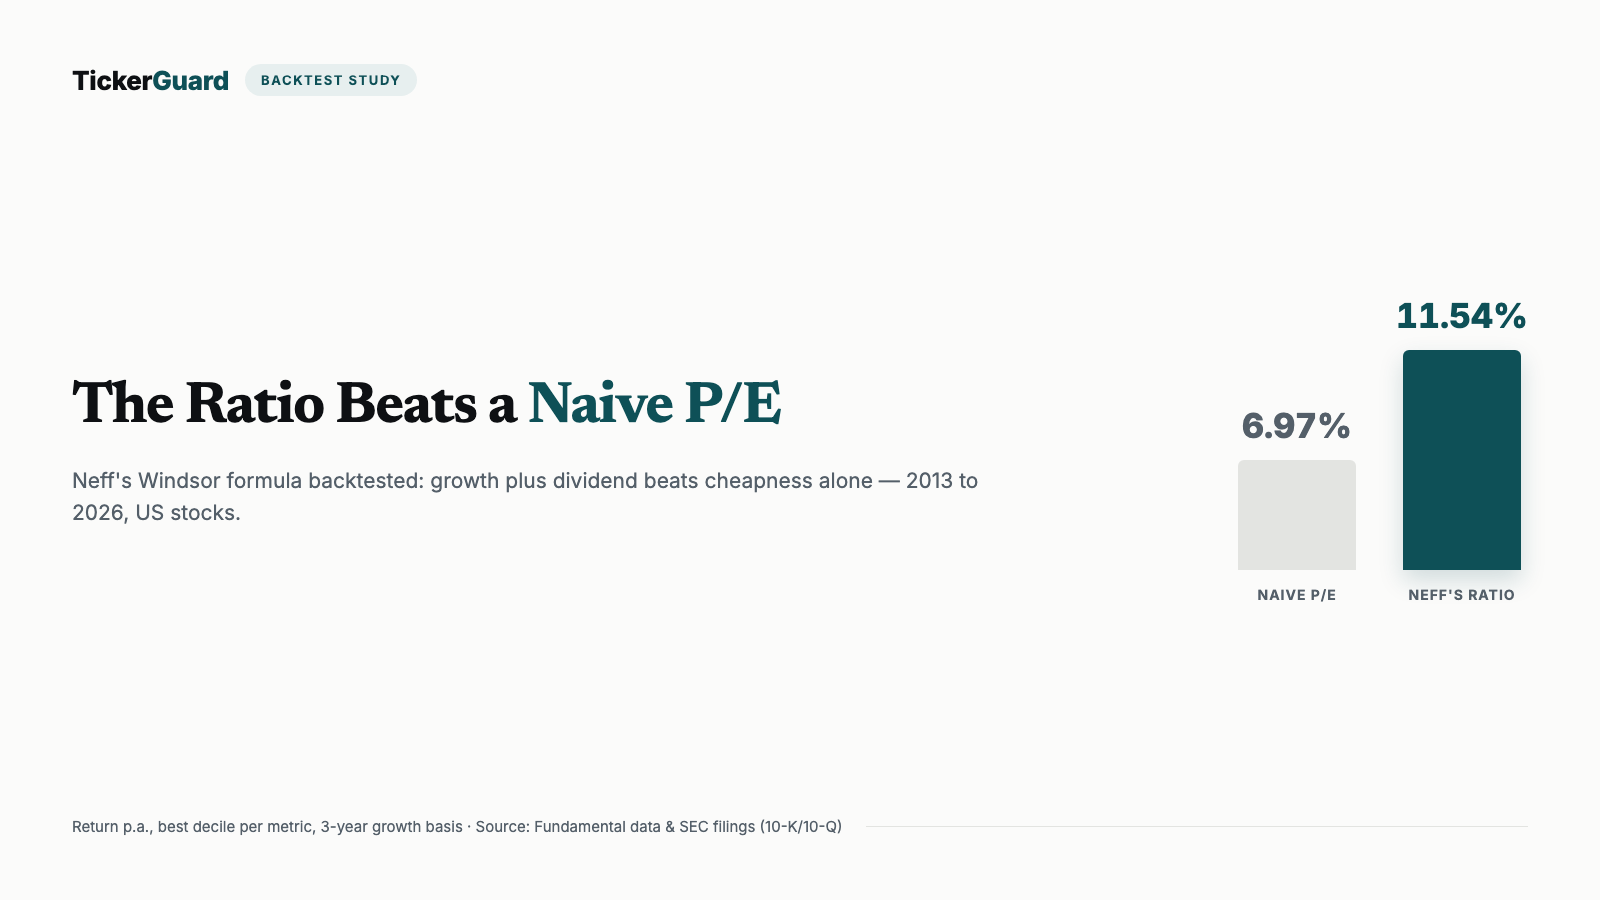
- +2.66 / +4.25 / +3.30 points: that's how much the best ratio decile (growth plus dividend, divided by the P/E) beats the cheapest naive P/E decile over the same span — depending on the growth basis. Neff's numerator demonstrably adds something over the bare P/E.
- −0.28 / −0.74 / +1.23 points: that's how much the dividend alone contributes to the ratio — essentially nothing, with no consistent sign.
No Windsor arm reliably beats the S&P 500 Total Return, but the total-return ratio clearly beats the naive P/E — Neff's core idea holds up, even though the complete recipe falls short of the market in this window.
The Signal: How We Measured the Windsor Formula
- Total-return ratio. (Earnings growth in percent plus dividend yield in percent) divided by the P/E. Growth is capped at 50% for the ratio, and the ratio is winsorized per cohort (1st/99th percentile) so individual outliers don't distort the ranking.
- Windsor rule (original recipe). P/E between 40% and 60% of the universe median, earnings growth of 7% to 20%, sales growth above 7% OR above 70% of earnings growth, ratio at least twice the market median.
- Entry. The entire cohort buys on the same day: at the closing price four months after quarter-end. Letting each company buy in its own reporting month would be a look-ahead for a rank-based metric — and the Windsor rule itself is relative too (P/E and ratio measured against the universe median).
- Original exit. P/E at the universe median OR ratio below the plain market median, checked against each subsequent cohort's then-current metrics — alongside a fixed sensitivity table at 6, 12, 24 months and "held to the end."
- Three growth bases. TTM year-over-year, 3-year and 5-year CAGR (with split protection) — fixed in a pre-registered basis sweep before the final evaluation, so no basis gets chosen after the fact because it looks best.
- Conservative headline number. Positions with a monthly return above 200% are excluded from the headline figure. An un-backfilled reverse split produces exactly that kind of jump — and the same company simultaneously shows an artificially low P/E, landing it in the cheapest decile. Price and signal errors point the same direction, so the conservative figure is the one quoted throughout this study.
The Result: Windsor Does Not Reliably Reach the S&P 500
At twelve months' holding period, buying the full universe that meets the Windsor rule (arm ALL), all three growth bases sit below or at best tied with the S&P 500 Total Return. A reading note for the table: the Windsor runs make their first buy at the end of July 2013 and are therefore invested only from August 2013 onward, and they also hold through to July 2026 less often than the univ run — every Δ column therefore compares against the S&P 500 AND the study's own universe over that run's own, often shorter, invested span, not the full 163 months. A back-of-the-envelope "p.a. minus 15.02%" will therefore not match the Δ column:
| Run | Buys | Positions | p.a. | Δ vs. S&P TR | Δ vs. own universe | Median per position | Hit rate | Max drawdown |
|---|---|---|---|---|---|---|---|---|
| ttm_wsr (Windsor, TTM basis) | 213 | 195 | 8.06% | -5.72 pts | -1.72 pts | 10.89% | 67.2% | -43.43% |
| c3_wsr (Windsor, 3-year basis) | 268 | 248 | 13.53% | 0.02 pts | 3.77 pts | 7.17% | 58.1% | -41.63% |
| c5_wsr (Windsor, 5-year basis) | 260 | 242 | 8.78% | -3.55 pts | -1.73 pts | 5.24% | 56.6% | -41.07% |
| kgv_d1 (cheapest P/E decile) | 2,961 | 2,327 | 6.97% | -6.87 pts | -1.84 pts | 0.87% | 51.1% | -47.22% |
| kgv_d10 (most expensive P/E decile) | 3,883 | 3,204 | 9.00% | -4.74 pts | 0.29 pts | 1.74% | 53.0% | -28.65% |
| ttm_d10 (best ratio decile, TTM) | 2,807 | 2,468 | 9.50% | -4.21 pts | -0.21 pts | 6.04% | 57.8% | -42.02% |
| c3_d10 (best ratio decile, 3-year) | 1,930 | 1,674 | 11.02% | -2.62 pts | 1.13 pts | 6.37% | 58.8% | -37.03% |
| c5_d10 (best ratio decile, 5-year) | 1,361 | 1,163 | 8.58% | -4.35 pts | -2.37 pts | 4.26% | 55.5% | -38.18% |
| ttm_d1 (worst ratio decile, TTM) | 2,741 | 2,404 | 10.50% | -3.16 pts | 0.84 pts | 4.98% | 56.7% | -39.77% |
| c3_d1 (worst ratio decile, 3-year) | 1,972 | 1,711 | 9.71% | -3.99 pts | -0.24 pts | 4.69% | 55.5% | -41.73% |
| c5_d1 (worst ratio decile, 5-year) | 1,455 | 1,255 | 8.06% | -4.77 pts | -2.67 pts | 5.72% | 56.3% | -44.71% |
| ttm_od_d10 (ratio without dividend, TTM) | 2,819 | 2,488 | 9.77% | -3.93 pts | 0.07 pts | 6.25% | 57.7% | -41.54% |
| c3_od_d10 (ratio without dividend, 3-year) | 1,928 | 1,669 | 11.72% | -1.88 pts | 1.87 pts | 6.71% | 59.0% | -36.41% |
| c5_od_d10 (ratio without dividend, 5-year) | 1,349 | 1,154 | 7.49% | -5.58 pts | -3.60 pts | 3.43% | 55.1% | -37.88% |
| ttm_od2x (ratio ≥ 2× median without dividend, TTM) | 8,000 | 6,910 | 10.12% | -3.57 pts | 0.43 pts | 6.63% | 59.9% | -31.00% |
| c3_od2x (ratio ≥ 2× median without dividend, 3-year) | 4,790 | 4,117 | 10.70% | -2.96 pts | 0.79 pts | 6.35% | 59.4% | -31.88% |
| c5_od2x (ratio ≥ 2× median without dividend, 5-year) | 3,111 | 2,695 | 9.76% | -3.03 pts | -1.05 pts | 6.48% | 59.4% | -30.81% |
| univ (study's own peer universe) | 8,905 | 7,594 | 8.72% | -5.03 pts | 0.00 pts | 3.94% | 55.4% | -33.96% |
| ttm_univ (universe, TTM basis only) | 6,580 | 5,643 | 9.70% | -4.00 pts | 0.00 pts | 6.25% | 59.2% | -32.54% |
| c3_univ (universe, 3-year basis only) | 5,349 | 4,799 | 9.94% | -3.75 pts | 0.00 pts | 5.34% | 57.5% | -33.57% |
| c5_univ (universe, 5-year basis only) | 3,844 | 3,436 | 10.70% | -1.98 pts | 0.00 pts | 6.88% | 59.5% | -33.50% |
| S&P 500 Total Return | — | — | 15.02% | — | — | — | — | -23.87% |
Only the 3-year basis (c3_wsr) reaches the S&P 500 Total Return almost exactly (0.02 pts points) and sits 3.77 pts points above the study's own peer universe. The TTM and 5-year bases fall short of both the S&P 500 and — narrowly — the study's own universe. Against the study's own universe is the real answer to the core question, because it contains exactly the companies the Windsor rule selects from, run through the same engine at the same costs; the gap to the S&P mixes the rule with the size and universe difference between a broad, equal-weighted backtest and a cap-weighted large-cap index.
Which Growth Basis Carries — TTM, 3 Years, or 5 Years?
At four out of five holding periods, the 3-year CAGR wins at a comparable position count — only at "held to the end" does it trail the TTM basis narrowly:
| Basis | Holding period | Buys | Positions | Median holding period (months) | p.a. | Δ vs. S&P TR | Δ vs. own universe |
|---|---|---|---|---|---|---|---|
| TTM | 6 months | 213 | 197 | 6 | 11.88% | -1.71 pts | 3.72 pts |
| TTM | 12 months | 213 | 195 | 12 | 8.06% | -5.72 pts | -1.72 pts |
| TTM | 24 months | 213 | 190 | 24 | 9.00% | -4.73 pts | -1.14 pts |
| TTM | held to the end | 213 | 176 | 63 | 10.50% | -3.16 pts | -0.67 pts |
| TTM | Neff's original exit | 213 | 196 | 6 | 9.54% | -4.17 pts | -0.12 pts |
| C3 | 6 months | 268 | 253 | 6 | 14.19% | 0.71 pts | 3.93 pts |
| C3 | 12 months | 268 | 248 | 12 | 13.53% | 0.02 pts | 3.77 pts |
| C3 | 24 months | 268 | 240 | 24 | 11.15% | -2.48 pts | 0.53 pts |
| C3 | held to the end | 268 | 218 | 63 | 10.45% | -3.21 pts | -0.61 pts |
| C3 | Neff's original exit | 268 | 237 | 12 | 11.99% | -1.60 pts | 1.20 pts |
| C5 | 6 months | 260 | 253 | 6 | 6.44% | -6.29 pts | -4.47 pts |
| C5 | 12 months | 260 | 242 | 12 | 8.78% | -3.55 pts | -1.73 pts |
| C5 | 24 months | 260 | 234 | 24 | 9.99% | -2.14 pts | 0.22 pts |
| C5 | held to the end | 260 | 218 | 57 | 9.54% | -2.66 pts | -0.90 pts |
| C5 | Neff's original exit | 260 | 234 | 18 | 9.94% | -2.19 pts | -1.48 pts |
The 5-year basis is therefore NOT the better growth basis — it simply has a shorter, later history: its first viable cohort (at least 100 ranked companies) starts only in Q4/2014, while the TTM and 3-year bases are already viable in Q1/2013. A stronger reading on the 5-year basis can simply be a shorter, later window, not a superior metric.
Core Question: Does Neff's Numerator Add Something Over a Naive P/E?
This is the clearest finding of this study. It compares the best ratio decile per growth basis against the cheapest naive P/E decile (kgv_d1) — both run over the same SHARED invested span, otherwise a thirteen-year return would sit next to a ten-year one and the gap would be the time window, not the metric. That shared span is NOT the same as each run's own span in the headline table above — the point gaps below therefore deliberately differ from a plain subtraction of the p.a. figures there:
Across all three growth bases, the ratio beats the naive P/E: by 2.66 points on the TTM basis, 4.25 points on the 3-year basis, and 3.30 points on the 5-year basis — each per year, run over the same span. Notably, the cheapest naive P/E decile itself (6.97%) sits in this window BELOW the most expensive naive P/E decile (9.00% from the headline table) — cheap P/E alone was not a durable signal in 2013–2026. Only combining it with growth, the way Neff's total-return ratio does, turns it into a signal that carries.
What Does the Dividend Contribute?
The same rank field once WITH and once WITHOUT the yield term in the ratio's numerator, same cohorts, same basket size, twelve months' holding period: the gap is 0.28 points on the TTM basis, 0.74 on the 3-year basis, and 1.23 on the 5-year basis — essentially zero, and WITHOUT a consistent sign. The dividend component that Neff himself credited for roughly 200 basis points of his historical edge ("the market would give us that yield, in effect, for nothing") cannot be reproduced in this backtest: in this window, the ratio's ranking is driven almost entirely by earnings growth, not yield.
Comparison Benchmarks: the Full Frame
For a decile and rule-based study, the study's own peer universe is the real benchmark: it contains exactly the companies the arms are drawn from. The other two benchmarks mark out the full frame the result sits in.
| Benchmark | p.a. | Max drawdown |
|---|---|---|
| S&P 500 Total Return | 15.02% | -23.87% |
| Equal-weighted price universe | 4.77% | -53.23% |
| Study's own peer universe, equal-weighted (run univ, 12 months) | 8.72% | -33.96% |
One Example: Deere & Company Meets the Windsor Rule
At the end of July 2013, Deere & Company (ticker DE) met all four conditions of the Windsor rule for the Q1/2013 cohort: its P/E sat at 10.17 — within the required band of 40 to 60 percent of the universe median. Earnings growth stood at 18.72% (band 7 to 20), sales growth at 12.71% (above the 7% threshold). The total-return ratio reached 2.06 — more than twice the market median of 0.75 at the time. One example that the rule is not an abstract formula, but produced concrete, real purchase decisions at the time.
“We preferred stocks whose total return, divided by the p/e, exceeded the market average by 2 to 1.”
— John Neff with Steven L. Mintz, John Neff on Investing, Wiley 1999.
Sensitivities: How Robust Is the Finding?
Without the 2020–2022 entries (Covid-free), the picture shifts markedly lower — a substantial share of the measured Windsor performance sits in those three years:
| Run | Covid-free | No mergers | Large-cap | Viable |
|---|---|---|---|---|
| ttm_wsr (Windsor, TTM basis) | 4.97% | 8.06% | 6.27% | 8.06% |
| c3_wsr (Windsor, 3-year basis) | 10.00% | 13.53% | 11.38% | 13.53% |
| c5_wsr (Windsor, 5-year basis) | 3.14% | 8.78% | 9.81% | 9.82% |
| kgv_d1 (cheapest P/E decile) | 3.06% | 6.97% | 7.64% | 6.97% |
| kgv_d10 (most expensive P/E decile) | 6.41% | 9.00% | 8.44% | 9.00% |
| univ (study's own peer universe) | 5.87% | 8.71% | 8.81% | 8.72% |
Merger artifacts (tickers that end after a merger even though the company keeps trading under a new name) and restricting the sample to viable cohorts (at least 100 ranked companies) change almost nothing by comparison — the Windsor results stay stable once these two distortions are stripped out. Among large-cap positions (at least $300 million in market cap on the purchase date, as a proxy for tradability) the picture shifts unevenly: the TTM Windsor rule loses noticeably, while the 3-year and 5-year bases largely hold up.
What the Literature Says
Neff's own track record at Windsor is well documented: 13.7% per year over 31 years (1964–1995) against 10.6% for the S&P 500 — an edge of 3.1 percentage points, turning $10,000 into more than $564,000 against roughly $233,000 in the index. In 1985 the fund closed to new investors at roughly $3.4 billion — then the largest US equity fund of its kind.
“In Windsor's lexicon, ‘total return’ described our growth expectations: annual earnings growth plus yield … total return divided by initial p/e could not have been more succinct.”
— John Neff with Steven L. Mintz, John Neff on Investing, Wiley 1999.
Neff's own metric, however, used ESTIMATED future earnings growth — Windsor's own five-year forecasts, with normalized earnings for cyclicals. Historical estimates of that kind don't exist for a backtest; this study therefore uses TRAILING growth instead. That measures something different from Neff's own judgment — a methodological gap that, if anything, works against the finding measured here, not for it.
How a related, even stricter value approach performs on the same universe — pure asset-value stocks rather than a growth-plus-valuation formula — is covered in the Graham Net-Net backtest.
How We Calculated This
- Source. Public mandatory filings with the US Securities and Exchange Commission (10-K/10-Q) for earnings, sales, and dividends, compressed into a calendar-quarter grid; prices from our own US stock price archive including delisted names.
- Cohort entry. The entire cohort buys four months after their shared quarter-end — not each company in its own reporting month, which would be a look-ahead for a rank-based metric.
- Costs and price floor. 0.1% cost per leg, minimum raw price 1 dollar on the purchase date, calculated on the adjusted price.
- Period. January 2013 to July 2026, 163 months. Equal-weighted portfolio, monthly rebalancing.
- Conservative headline number. Positions with a monthly return above 200% — typically un-backfilled reverse splits — are excluded from the headline figure; otherwise they would doubly favor the cheapest deciles.
- Hand check. Every metric was spot-checked by hand: one complete Windsor position through two independent calculation paths (directly from the price series and via the chained monthly returns), one Windsor-rule check against a real company-quarter, one original exit against a real position, and the report-versus-backtest-run cross-check across every run — largest deviation throughout: 1.0E-9 percentage points.
Deviations From the Original
A backtest is always an operationalization, never a literal reconstruction. These points documentedly deviate from the book original:
- Trailing growth instead of Neff's own forward-looking five-year estimate.
- The 70% branch of the sales-growth rule is a widely used secondary operationalization, not book wording.
- Market reference as the universe median instead of an informal market average; the 2:1 threshold targets the market (per the book quote), not the industry.
- A mechanical exit instead of a discretionary sale into strength.
- Cyclicals get no special treatment: no normalized earnings, no yield requirement, no P/E floor.
- The cohort buys as a block four months after quarter-end — the fundamentals are four months old on the purchase date.
What This Study Does Not Say
- 2013–2026 is a growth-dominated window (a value drought). A weaker result than Neff's own can partly reflect the window, not just the formula — and a stronger result would carry correspondingly more weight. This study never titles itself "Neff disproven" anywhere: the finding is nuanced, not negative. The ratio demonstrably beats the naive P/E; only the full rule falls short of the S&P 500.
- A substantial share of the Windsor performance sits in 2020–2022. Without the Covid entries, every value arm drops sharply. The result is therefore also a window effect, not only a formula effect.
- Publication timing. Neff's book appeared in 1999; the measurement window lies entirely after it. Published return predictors decay by 58% on average after publication (McLean/Pontiff 2016) — a weaker result than Neff's own is the expectation here, not a contradiction.
- No scanner, by design. No live tool follows from this backtest. There is no Windsor or Neff scanner, and no approval for one.
- A backtest is not a forecast. This study is market research, not investment advice and not a buy recommendation.
Frequently Asked Questions
Not reliably. On the conservative count, the Windsor rule returns 8.06% (TTM), 13.53% (3-year basis, essentially tied with the S&P 500), or 8.78% (5-year basis) per year, depending on the growth basis — against 15.02% for the S&P 500 Total Return. Against the study's own peer universe, only the 3-year basis is ahead (+3.77 points); the other two sit slightly behind.
Yes — that is the clearest finding of this study. Over the same invested span, the best ratio decile (growth plus dividend, divided by the P/E) beats the cheapest naive P/E decile by 2.66 to 4.25 percentage points per year, depending on the growth basis. Cheap P/E alone barely carried in this window: the cheapest decile (6.97%) sat below the most expensive one (9.00%).
Practically nothing, and with no consistent sign: −0.28 points on the TTM basis, −0.74 on the 3-year basis, +1.23 on the 5-year basis. The yield component that Neff himself credited for roughly 200 basis points of his historical edge cannot be reproduced in this backtest — the ranking is driven almost entirely by earnings growth.
The 3-year CAGR wins at four out of five holding periods (including 13.53% p.a. at twelve months, tied with the S&P 500) and trails only narrowly at "held to the end" (10.45% vs. 10.50% on the TTM basis). The 5-year basis is NOT better, it simply has a shorter, later history (its first viable cohort starts only in Q4/2014) — switching the basis alone does not turn a weaker result into a stronger one.
Partly, and that needs to be stated openly: 2013–2026 is a growth-dominated window (a value drought). Without the 2020–2022 entries the Windsor rule drops sharply (TTM basis from 8.06% to 4.97%, the cheapest P/E decile from 6.97% to 3.06%) — a substantial share of the measured value performance sits in those three years. A negative result can therefore partly reflect the window, not just the formula.
No, by design. This study is market research into a historical approach, not a proposal for a new tool. There is no approval for a Windsor or Neff scanner.


