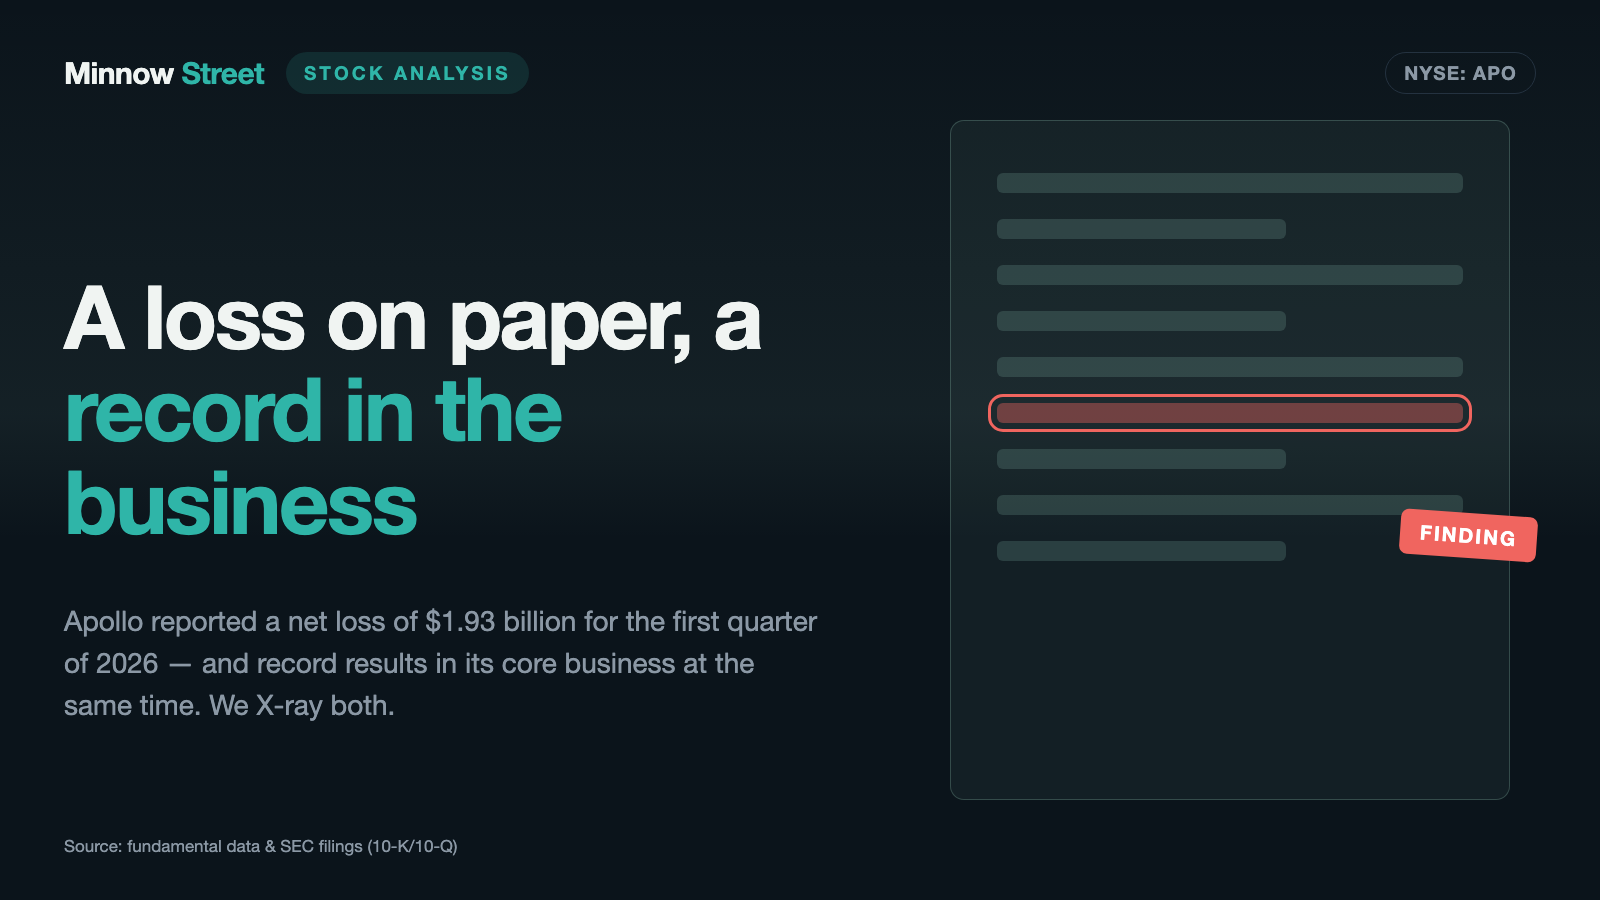
Apollo Global Management: A P/E of 81, a $1.93 Billion Loss — and a Record Quarter Hiding Behind Both Numbers
Apollo Global Management (NYSE: APO) reported a GAAP net loss of $1.93 billion for the first quarter of 2026, even though pre-tax income for the same quarter was a positive $283 million. The cause: a one-time, non-cash tax valuation allowance of roughly $1.7 billion in Bermuda. By the second quarter of 2026, Apollo was back to a $1,336 million profit, with record fee income ($785 million, up 25 percent) and $1.05 trillion in assets under management as of June 30, 2026. We read the 10-Q, the 10-K and eleven earnings calls against the grain of the headline number. Not investment advice — just the question of which of the two eye-catching numbers should actually matter to you the next time you glance at the ticker.
 Thomas Mücke
Founder & Publisher
Thomas Mücke
Founder & Publisher
As of Today
As of: September 18, 2026
- Closing price
- 125.90 $ -0.10%
- Market Capitalisation
- 75.1 $B
- P/E
- 79.4
- Growth Score
- 10/10
- AAQS
- 7/10
This analysis has a cut-off date. The Stock Guard tells you when something material changes in the numbers. Reserve your free spot
Chart
Interactive price chart (TradingView).
52-week range: 100.30 $ to 152.70 $ · Last price: 125.90 $ (As of: September 18, 2026)
Note: pure fact-based analysis, not investment advice and not a solicitation to buy or sell. All figures without guarantee.
There's a reflex everyone who has ever held a lab report in their hands knows: one value comes back flagged red, and your brain has already made the diagnosis before the doctor says a word. Call it the red-flag reflex — and it works the same way in the stock market, except the flagged value isn't cholesterol, it's "P/E of 81" or "net loss of $1.93 billion." In the summer of 2026, Apollo Global Management (NYSE: APO) is flashing both at once: the trailing price-to-earnings ratio stood at roughly 81 as of August 5, 2026 — a number that makes plenty of investors turn away on sight. And in the first quarter of 2026, the asset manager and retirement services company reported a net loss of $1.93 billion, even though pre-tax income for that same quarter was a positive $283 million. Two red flags, one reflex: keep scrolling. Let's make a deal instead: we'll read together what Apollo actually reported to the U.S. securities regulator, the SEC — the quarterly report (10-Q) as of March 31, 2026, the annual report (10-K) for 2025, the proxy statement (DEF 14A) for 2026, and the fresh earnings release from August 4, 2026 covering the second quarter. A filing to the SEC is honest under penalty of law, and this one tells a different story than the two red flags alone: a one-time tax entry in Bermuda, two business engines that both posted records in the same half-year, and an interest-rate sensitivity that is real and stays real, Bermuda charge or not. What you make of both numbers is, in the end, your decision.
What Apollo Global Management actually does — two engines under one roof
Apollo Global Management isn't a single business — it's a holding company running two very different profit engines. The first is traditional asset management: Apollo manages money for institutional investors (pension funds, insurers, sovereign wealth funds) and individual investors in credit funds, private equity funds and infrastructure funds, and it collects a fee for doing so regardless of whether those funds are having a good year or a bad one. In Apollo's own terminology, that fee income is called "Fee Related Earnings" (FRE) — picture a property manager who collects a management fee every month no matter what rents happen to be doing. The second engine is the retirement services business Athene, which Apollo fully merged into the group at the start of 2022: Athene sells retirement annuities, collects premiums, and promises customers a fixed, usually modest return. Apollo invests that premium money on Athene's behalf — in bonds, but increasingly in directly originated loans (private credit) that carry a higher yield. The gap between what Athene promises its customers and what that capital actually earns is called "Spread Related Earnings" (SRE) — picture a bank that borrows cheap (the annuity premiums) and lends it back out at a higher rate; the profit is the spread in between. Narrow that spread — through rate moves, competition, or weaker credit quality — and profit falls, without Athene losing a single policyholder.
What ties both engines together is what Apollo internally calls its "origination engine": instead of buying loans and bonds in the open market like most competitors, Apollo directly originates a growing share of them itself — negotiating terms straight with the borrower instead of purchasing an off-the-shelf product. Picture it this way: most asset managers buy bread from a wholesaler; Apollo increasingly runs its own bakery — supplying both its own funds (which pay fees for that, engine one) and Athene's balance sheet (which earns a higher yield for it, engine two). In 2025, that origination volume reached $305 billion group-wide — more on that number in the "What management promised" chapter below. A curious footnote from the company's own history: the present-day holding company briefly carried the placeholder name "Tango Holdings, Inc." during an internal restructuring in 2021, before becoming "Apollo Global Management, Inc." — the annual report still lists this in its glossary today. At the start of 2022, the resulting holding company fully combined with the previously separately listed Athene Holding Ltd.: two stocks became one, two annual reports became one. That merger is exactly why a single accounting decision in Bermuda can now move Apollo's entire consolidated result. Which brings us to the central tension of this analysis: one engine has delivered more than management itself promised for years running — the other is so large and carries such complex accounting that a single tax decision can flip the entire consolidated result. You may already know Apollo's private-equity side from our Rackspace stock analysis — the cloud services provider Apollo took private via leveraged buyout in 2016 and still majority-controls today. That holding is a useful reminder of how much of Apollo's business sits outside Athene entirely.
Where the quarterly report landed on our desk
Apollo showed up on our in-house stock scanner right after the August 4, 2026 earnings release — flagged with a rare double signal. On one side, a strikingly high trailing price-to-earnings ratio (roughly 81, data as of August 5, 2026) that normally reads as "expensive." On the other, quarterly earnings growth year over year of negative 57.3 percent — a pattern our scanner typically classifies as a profit-collapse warning. Both numbers come from the same source: the trailing-twelve-month (TTM) window that contains the $1.64 diluted EPS figure — and that window still includes the first quarter of 2026 with its $1.93 billion loss. The scanner is reporting exactly what the numbers say; whether that also describes what's happening in the business is a different question. That's what the rest of this piece answers, chapter by chapter, with a date attached to every figure.
The numbers over the years — honestly appraised
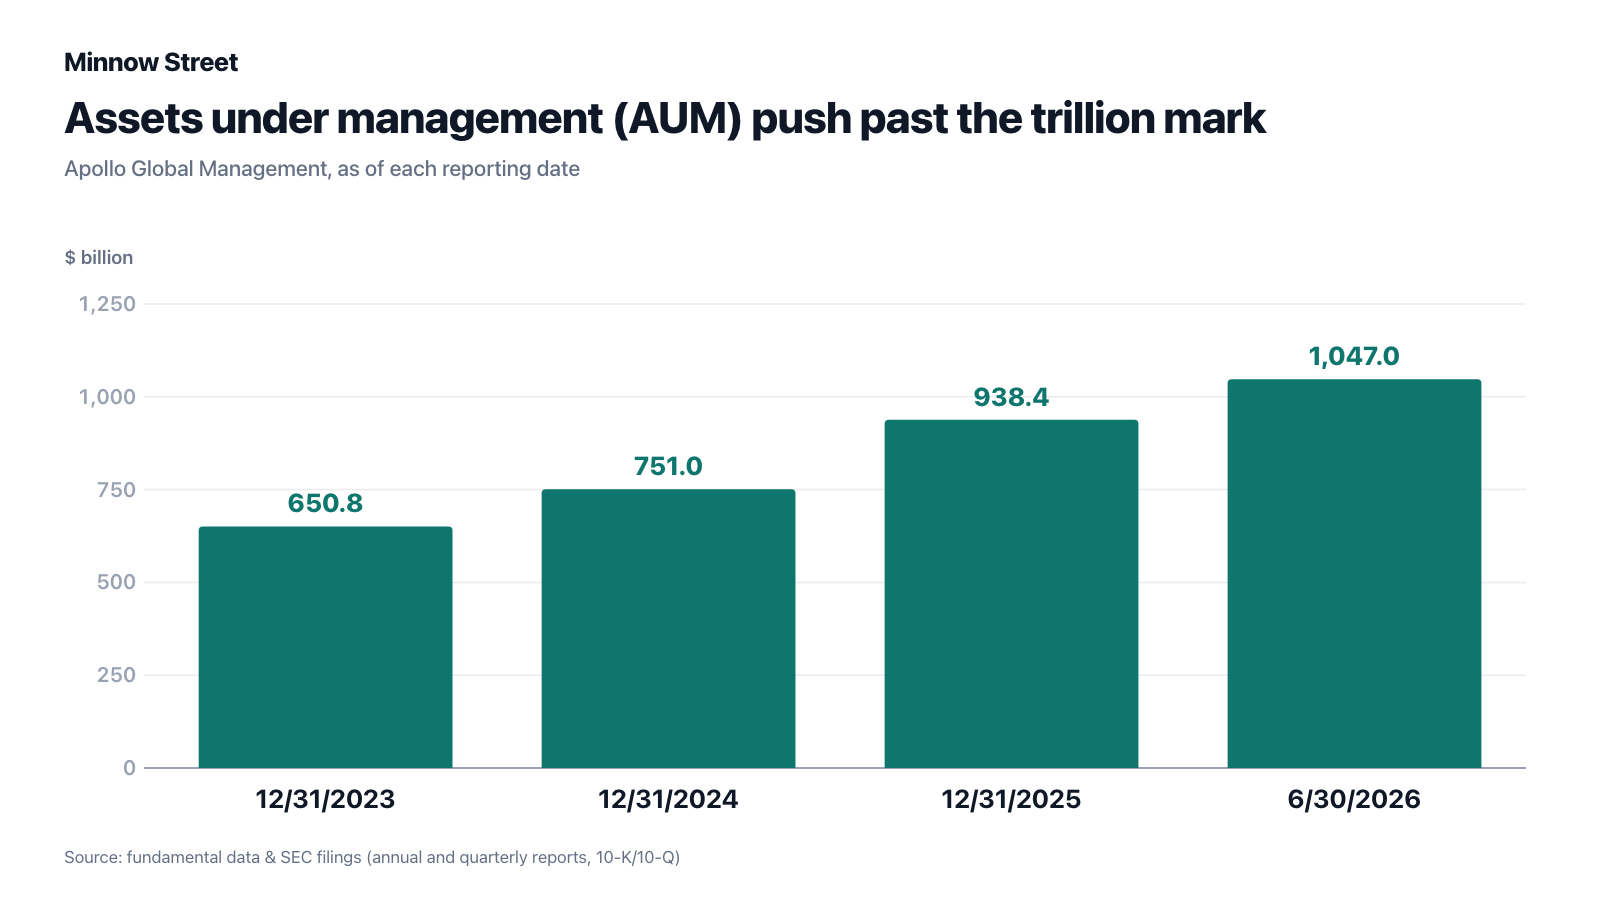
Let's start with what genuinely impresses: assets under management (AUM) grew from $650.8 billion at the end of 2023, to $751.0 billion at the end of 2024, to $938.4 billion at the end of 2025 — a 25.0 percent increase in 2025 alone. Apollo crossed the $1 trillion mark for the first time as of March 31, 2026 ($1.03 trillion), and reached $1.047 trillion by June 30, 2026, of which $858 billion is fee-generating. Both profit engines grew in lockstep: Fee Related Earnings (FRE) rose from $1,768 million (2023) to $2,063 million (2024) to $2,528 million (2025); Spread Related Earnings (SRE) rose from $3,108 million to $3,224 million to $3,361 million over the same years. Combined, that produced Adjusted Net Income (ANI — Apollo's own non-GAAP earnings measure, stripped of one-time items) of $4,082 million (2023), $4,565 million (2024) and $5,195 million (2025).
The first half of 2026 kept that pace — with records in both quarters: Fee Related Earnings reached $785 million in the second quarter, up 25 percent year over year and a new record; Spread Related Earnings climbed to $877 million, also a record. Combined, both engines generated $1,662 million in the second quarter of 2026 alone. Adjusted Net Income came in at $1,208 million in the first quarter and $1,314 million in the second — $2.11 per share for the quarter. Over the same period, Apollo raised $60 billion in net new capital in the second quarter alone ($298 billion over the trailing twelve months) and originated $74 billion in new loans and investments ($317 billion trailing twelve months). Over the last twelve months, Apollo returned more than $1 billion in dividends plus roughly $1.6 billion in share buybacks to stockholders. The dividend itself grew every year: $1.69 per share (2023), $1.81 (2024), $1.99 (2025) — for 2026, the company has set a target of $2.25 per share.
The Bermuda charge: why a record quarter still landed as a loss
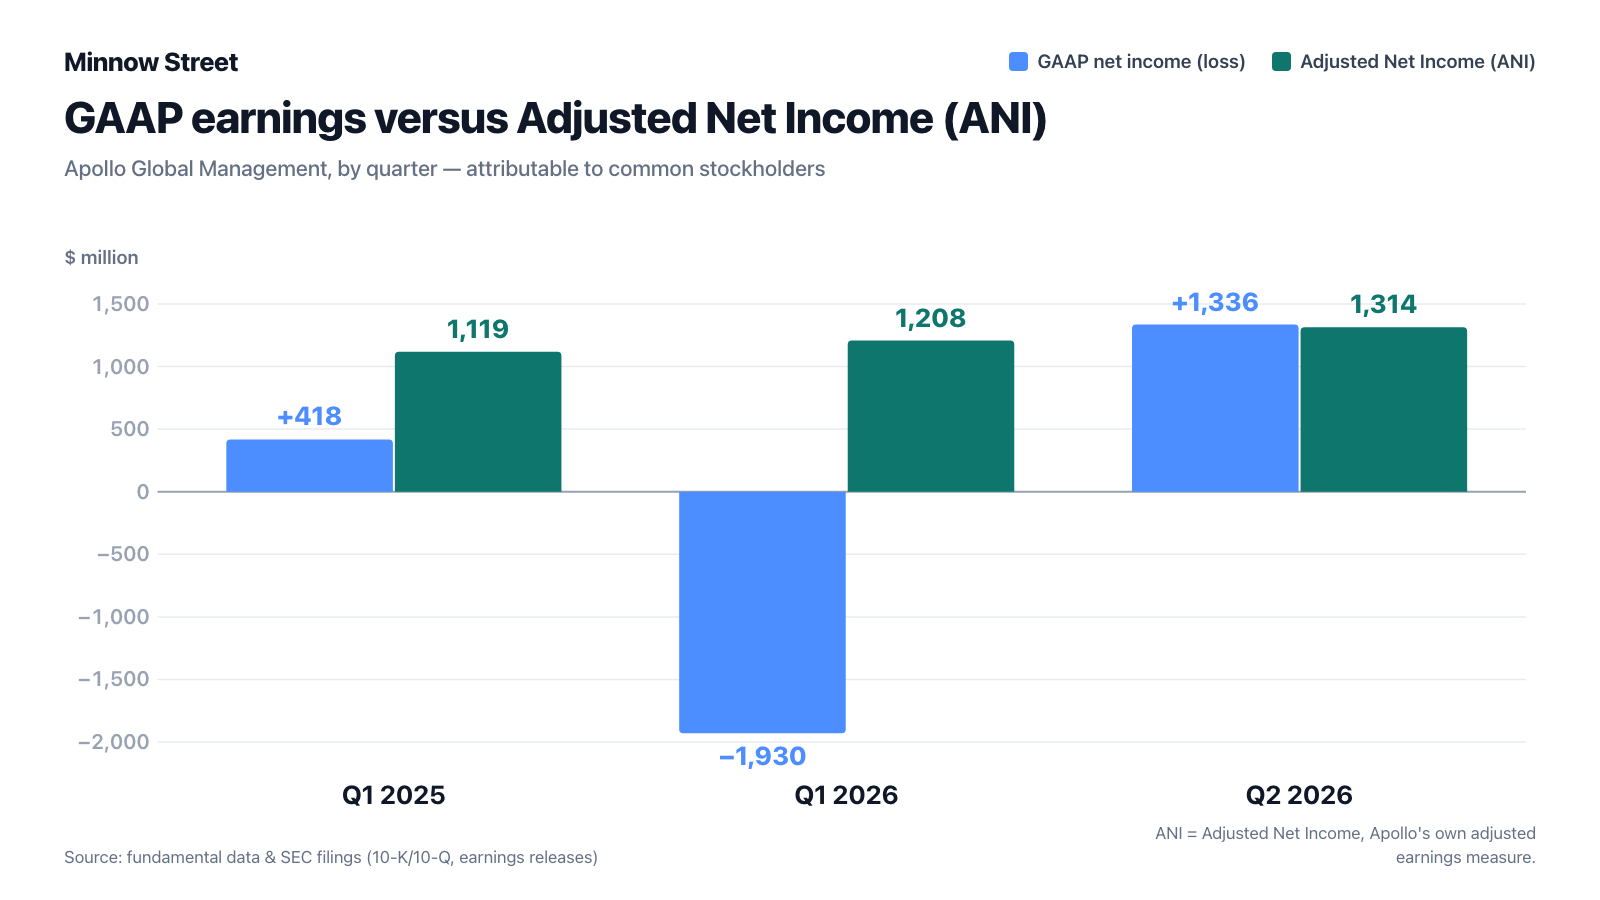
Now to the heart of the red-flag reflex from the opening. In the first quarter of 2026, Apollo generated pre-tax income of $283 million — positive, but well below the $1,181 million posted a year earlier, because capital markets were turbulent that quarter (more on that below). A year earlier, the bottom line attributable to common stockholders had still shown a $418 million profit. What turned that into a $1.93 billion net loss was not the operating business, but a single line item: the income tax provision of $1,694 million — more than six times pre-tax income. The quarter's effective tax rate: 598.6 percent (versus 20.6 percent a year earlier). The background: in January 2026, Apollo revoked its reinsurance subsidiary ACRA's election to be subject to Bermuda's Corporate Income Tax Act 2023 — a decision tied to the international OECD "Pillar Two" minimum-tax reform. Because ACRA and Athene no longer expect to incur Bermuda corporate income tax against which future deferred tax assets could be used, Apollo had to fully write down those tax assets — an accounting entry that moves no actual cash out the door.
"As a result of the foregoing, in the first quarter of 2026, the Company recorded a full valuation allowance against its Bermuda deferred tax assets, as the Company no longer expects Athene or ACRA to incur Bermuda CIT or Pillar Two tax expense against which such deferred tax assets could be utilized."
— Apollo Global Management, Inc., SEC quarterly report (10-Q) as of March 31, 2026, Note 11, "Income Taxes." Filing on sec.gov

How one-time this really was shows up clearly in the second quarter of 2026: pre-tax income jumped to $2,485 million, and the tax provision fell back to $396 million — an effective rate of roughly 16 percent, back in the normal range. Consolidated net income (before non-controlling interests) came to $2,089 million; $1,336 million of that was attributable to common stockholders, or $2.18 per share. Anyone looking only at the headline GAAP figures sees a company that swung from negative $1.93 billion to positive $1.34 billion within a single quarter — a roller-coaster that never happened in the actual operating business. That's exactly what Apollo's own adjusted metric, Adjusted Net Income (ANI), shows: $1,208 million in the first quarter and $1,314 million in the second of 2026, after $1,119 million in the first quarter of 2025 — a calm, growing line, not a swing. Picture a small business whose order book and bank balance both grew steadily all year — but a one-time correction to a prepaid tax account makes its quarterly tax filing look deep red, even though not a single customer paid a dollar less. That's exactly why the trailing twelve-month diluted EPS of $1.64 and the resulting P/E ratio of roughly 81 (data as of August 5, 2026) can be misleading — they'll keep carrying the Bermuda charge until Apollo files its report for the first quarter of 2027, even though the charge itself was economically closed out back in January 2026.
What management promised — and what actually happened
Read eleven consecutive earnings calls — from February 2024 through August 2026 — and a clear pattern emerges: on the fee business, Apollo consistently delivers more than it announced; on Athene's spread earnings, the road was considerably bumpier. On origination: the original five-year plan, dating from before 2023, called for $150 billion in directly originated loans and investments by 2026. By February 2024, CEO Marc Rowan had already raised that target to "$200 to $250 billion"; the Investor Day in September 2024 anchored it even higher. Apollo actually hit $305 billion in origination volume in 2025 — by management's own account, "three to four years" ahead of the original schedule. The pride in that trajectory was already audible on the 2023 year-end call:
"If you had told me at the beginning of the year that we were going to grow 25%-plus in FRE and 26% in SRE and that we would do that successfully, we would be doing a victory lap here; and I assure you we are, in fact, doing that victory lap."
— Marc Rowan, CEO, fourth-quarter/full-year 2023 earnings call, February 2024
The spread earnings (SRE) story ran less smoothly. In 2023, management had framed "low double-digit" annual growth as the normal state of affairs. The first correction came in August 2024: the 2024 target was cut to "mid-single-digit" growth, blamed on the orderly runoff of unusually profitable COVID-era policies and the cost of hedging the floating-rate portfolio. In May 2025, in the middle of the market turmoil following surprise U.S. tariff announcements, came a second cut: the 2025 growth target slipped again to "mid-single-digit," this time citing expected additional rate cuts, intensifying competition in the retail annuity channel, and higher prepayments. Rowan framed the quarter's deliberately defensive posture this way:
"Hope and prayer, we have found to be very poor business strategies but good strategies for life."
— Marc Rowan, CEO, first-quarter 2025 earnings call, May 2025
The trend reversed after that: full-year 2025 spread earnings grew a normalized 9 percent to $3,361 million, management guided to roughly 10 percent growth for 2026 — and in the second quarter of 2026, spread earnings actually reached a record $877 million (up 6.8 percent year over year), putting the earlier target range back within reach. Not every analyst question gets answered live, though: in August 2025, an analyst pressed for the exact bridge between individual spread-earnings drivers. Rowan's answer was an open deferral:
"I think on the SRE, we'll follow up offline, because we have 2 more questions, and the call has been among our longest calls."
— Marc Rowan, CEO, second-quarter 2025 earnings call, August 2025
That "we'll follow up offline" move isn't an isolated incident — detailed questions about the Athene balance sheet are repeatedly pushed to separate Athene investor formats not covered in these transcripts. Since the third quarter of 2025, management's tone has shifted noticeably: from defending individual metrics to running an active transparency campaign — a daily updated fair-value estimate for fixed-income positions ("Estimated Daily Value"), a partnership with data provider ICE for proprietary private-asset identifiers, and public criticism of competitors that use Cayman Islands reinsurance structures to operate with less capital. That campaign leads straight into the next chapter — because the valuation question Apollo is addressing so aggressively there is a real one.
What the filings say — the uncomfortable truths
Uncomfortable truth no. 1: Athene's interest-rate sensitivity — $4.7 billion on just 100 basis points
Athene's business model lives on the gap between what it promises customers and what it earns on their money — and that gap is sensitive to interest-rate moves. How sensitive, the 10-Q spells out directly:
"if there was an immediate parallel increase in interest rates of 100 basis points from levels as of March 31, 2026, Athene estimates a net decrease to its point-in-time income (loss) before income tax (provision) benefit from changes in the fair value of these financial instruments of $4.7 billion, net of offsets."
— Apollo Global Management, Inc., SEC quarterly report (10-Q) as of March 31, 2026, Item 3, "Quantitative and Qualitative Disclosures About Market Risk." Filing on sec.gov
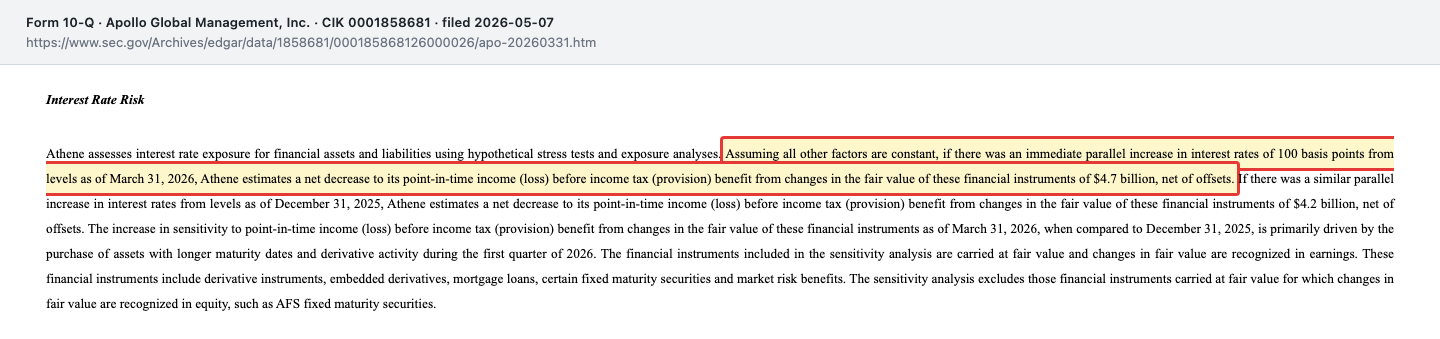
For context: $4.7 billion is more than 6 percent of Apollo's market capitalization (roughly $76.8 billion, data as of August 5, 2026) and nearly a full year of Adjusted Net Income ($5,195 million in fiscal year 2025). Picture a landlord who promised you a stable rent — but a single central-bank rate move blows a multibillion-dollar hole in his own books without a single unit being sold or a single lease being broken. That's not a balance-sheet error; it's the logical flip side of the "earn the spread" business model — and it's exactly why management has poured so much energy since late 2025 into trimming open rate exposure and building out transparency initiatives.
Uncomfortable truth no. 2: 64 percent of fund investments — priced by model, not by market
A large share of what Apollo reports as "assets under management" has no price you could simply look up on an exchange. The annual report says so directly:
"As of December 31, 2025, approximately 36% of the value of our funds' investments on a gross basis was determined using market-based valuation methods (i.e., reliance on broker or listed exchange quotes) and the remaining 64% was determined primarily by comparable company and industry multiples or discounted cash flow models."
— Apollo Global Management, Inc., SEC annual report (10-K) for fiscal year 2025, MD&A, "Overview of Results of Operations." Filing on sec.gov

Picture an art collection where a bit over a third of the pieces have a recent auction price attached — for the rest, an appraiser estimates value based on comparable works. That's not a shady practice; it's standard, and required, in the private-markets industry. But it means a substantial share of what Apollo reports as asset value rests on the judgment of its own valuation models — and it's exactly why management has, since early 2026, been building "Estimated Daily Value" and the ICE partnership (see the previous chapter) to make more of that externally verifiable.
Uncomfortable truth no. 3: private credit is banking without a market to check your own homework
The third uncomfortable point is tied to the second: a growing share of Athene's portfolio consists of directly originated loans (private credit) rather than exchange-traded bonds. The 10-K names the risk plainly:
"Certain of the funds we manage invest in private credit opportunities (including through direct origination), which may be illiquid, difficult to value and exit prior to maturity, and susceptible to credit deterioration, restructurings or losses."
— Apollo Global Management, Inc., SEC annual report (10-K) for fiscal year 2025, Item 1A, "Risk Factors." Filing on sec.gov

Picture a publicly traded bond: the market re-checks whether the price is still right every single day. With a directly originated private loan, you're simultaneously the loan officer and the only appraiser grading your own homework. That's compounded by concentration risk: Athene's investment portfolio is, among other things, concentrated in Athora (the European life insurer Apollo holds a significant stake in), and the 10-K separately warns that negative public perception of Athene could hurt its ability to win new pension-group-annuity customers. None of this means the business model doesn't work — Apollo's own historical loss rate, per the second-quarter 2026 earnings release, ran at 11 basis points, below the 12-basis-point industry average. But it does mean a meaningful share of Apollo's profit rests on its own ability to price credit risk better than the market — a claim that can't be proven with certainty until a real stress test forces the issue.
Valuation: P/E of 81 or P/E of 14 — which number counts?
Back to the opening question. Apollo's trailing price-to-earnings ratio stood at roughly 81 as of August 5, 2026 — a figure driven almost entirely by the Bermuda-distorted trailing-twelve-month diluted EPS of $1.64. The forward P/E, based on analyst estimates for the current fiscal year, sits at roughly 14 — squarely in the range you'd expect from a growing financial company. The PEG ratio (P/E relative to expected earnings growth) of 0.57 signals that, headline number aside, the market isn't pricing in an overpriced growth story. Other valuation anchors, all data as of August 5, 2026: price-to-sales (TTM) of 2.10; price-to-book of 3.90 (book value of $32.18 per share); the Wall Street analyst consensus price target sits at $149.26; the stock traded between $99.14 and $152.03 over the trailing 52 weeks, with a beta of 1.51 — noticeably more volatile than the broad market. The planned 2026 dividend of $2.25 per share works out to a forward yield of roughly 1.79 percent (data as of August 5, 2026). Whether 14 or 81 is the "right" number ultimately depends on whether you trust management to keep growing Adjusted Net Income (ANI) at its recent pace — a judgment call, not an arithmetic exercise. You'll find more deep dives like this one in our research section.
Opportunities and risks at a glance
What speaks for Apollo Global Management:
- The fee business and origination platform consistently deliver more than management promised: 2025 origination volume of $305 billion versus an original five-year target of $150 billion; Fee Related Earnings hit a record $785 million in the second quarter of 2026 (up 25 percent).
- Assets under management grew to $1.047 trillion as of June 30, 2026 (up 25 percent year over year), with $60 billion in net inflows in the second quarter alone.
- The Bermuda tax charge was one-time and non-cash — Adjusted Net Income (ANI) stayed stable and growing at $1,208 million and $1,314 million across both 2026 quarters.
- Growing capital return: the dividend rose from $1.69 to $1.99 per share (2026 target: $2.25), plus roughly $1.6 billion in share buybacks over the trailing twelve months.
- Strong credit ratings: Apollo is rated A2/A/A by Moody's, S&P and Fitch; Athene carries an even stronger A1/A+/A+/A+ (including A.M. Best).
What speaks against it:
- Athene's interest-rate sensitivity is real: an estimated $4.7 billion earnings impact from just a 100-basis-point rate increase (as of March 31, 2026) — more than 6 percent of market capitalization.
- 64 percent of fund investments are priced by valuation model rather than market price — a judgment call that only a real stress test would fully expose.
- Spread earnings (SRE) guidance was cut in both 2024 and 2025 before being met again — a pattern that could repeat if competition in the retail annuity channel keeps intensifying.
- Related-party transactions involving CEO Marc Rowan (roughly $3.5 million in private jet usage in 2025, a $200 million donor-advised fund he helps direct) are disclosed and audit-committee-approved, but remain governance-relevant.
- The trailing P/E of roughly 81 is misleading as long as the Bermuda charge sits inside the trailing-twelve-month window; the private credit business carries genuine credit risk with no daily market price to check it against.
A human conclusion
Back to the red-flag reflex from the opening. Both eye-catching numbers were real: Apollo genuinely reported a $1.93 billion net loss in the first quarter of 2026, and the price-to-earnings ratio genuinely stood at roughly 81 as of August 5, 2026. The mistake isn't seeing those numbers — it would be stopping there. The loss was a one-time, non-cash tax entry that will drop out of the trailing-twelve-month window once Apollo files its report for the first quarter of 2027; the fee business posted records in that very same half-year. But the second red flag these same filings disclose — Athene's $4.7 billion interest-rate sensitivity, the 64 percent of fund investments priced by model, the pure judgment call embedded in private credit pricing — doesn't disappear with the next quarterly report. It's the price of running two very different businesses under one roof: one that has delivered more than promised for years, and one whose balance sheet is so large and so complex that a single decision in Bermuda can flip the entire consolidated result. Which of the two numbers should matter more to you — the one that fades away, or the one that stays — is, in the end, your call. The decision is yours.
Sources
All original documents used in this analysis — for you to read yourself:
- Apollo Global Management, Inc. — Form 8-K, August 4, 2026, second-quarter 2026 earnings release (SEC EDGAR)
- Apollo Global Management, Inc. — Quarterly report (10-Q) as of March 31, 2026, filed May 7, 2026
- Apollo Global Management, Inc. — Annual report (10-K) for fiscal year 2025, filed February 25, 2026
- Apollo Global Management, Inc. — Proxy statement (DEF 14A) 2026, filed April 24, 2026
- New York Stock Exchange (filing on Apollo) — Form 25-NSE on the mandatory conversion of the Series A preferred stock, filed July 31, 2026
- Full SEC filing history for Apollo Global Management, Inc. (CIK 0001858681): EDGAR overview (sec.gov)
- Fundamental data (metrics, valuation, price statistics; data as of August 5, 2026), cross-checked against the SEC filings.
Transparency & disclaimer: This analysis is a journalistic contextualization of publicly available information. It is not investment advice, not a regulated financial analysis, and not a solicitation to buy or sell securities. Equity investments carry substantial risk, including total loss. All figures are provided without guarantee; data cut-off dates are noted throughout the text. Positions held by the operator are disclosed daily; where one exists, it appears as a notice at the top of this deep dive.
Key figures at a glance
All monetary figures in millions of $; earnings per share as reported.
| Metric | 2021 | 2022 | 2023 | 2024 | 2025 |
|---|---|---|---|---|---|
| Revenue | 5,951.0 | 10,968.0 | 32,644.0 | 26,114.0 | 32,049.0 |
| Operating Income (EBIT) | 1,976.0 | 115.9 | 5,882.0 | 8,299.0 | 8,258.0 |
| Net Income | 1,839.0 | 1,994.3 | 5,047.0 | 4,426.0 | 3,492.0 |
| Net Margin | 30.9% | 18.2% | 15.5% | 16.9% | 10.9% |
| Earnings Per Share | 7.77 $ | 3.41 $ | 8.57 $ | 7.33 $ | 5.74 $ |
Source: fundamental data & SEC filings (annual and quarterly reports, 10-K/10-Q)
Our Bottom Line at a Glance
- Growth engine: asset management positive
- Fee Related Earnings hit a record $785 million in the second quarter of 2026 (up 25 percent); 2025 origination volume of $305 billion far exceeded the original five-year target of $150 billion — a business that has repeatedly beaten its own targets since 2023.
- Earnings quality: GAAP swing versus economic reality neutral
- The $1.93 billion GAAP net loss in the first quarter of 2026 was a one-time, non-cash tax entry (the Bermuda valuation allowance); Adjusted Net Income (ANI) stayed stable at $1,208 million and $1,314 million across both 2026 quarters. The charge still distorts the reported trailing-twelve-month P/E until the Q1 2027 report is filed.
- Interest-rate sensitivity and valuation judgment at Athene negative
- A 100-basis-point rate increase would, per the company's own disclosure, reduce pre-tax income by $4.7 billion (more than 6 percent of market capitalization); 64 percent of fund investments were valued by model rather than market price as of 12/31/2025.
- Guidance track record on spread earnings (SRE) neutral
- SRE growth guidance was cut from "low double-digit" to "mid-single-digit" in both 2024 and 2025, then met again from late 2025 onward and exceeded with a record $877 million in the second quarter of 2026 — a setback-and-recovery pattern, not a structural break.
- Capital return and credit ratings positive
- The dividend rose from $1.69 to $1.99 per share (2026 target: $2.25), roughly $1.6 billion in share buybacks over the trailing twelve months, strong credit ratings (Apollo A2/A/A, Athene A1/A+/A+/A+).
- Governance neutral
- Notably low cash compensation for CEO Marc Rowan ($913,367 in 2025) alongside a large personal equity stake (5.9 percent), but disclosed related-party transactions (roughly $3.5 million in private jet usage in 2025, a $200 million donor-advised fund) and a meaningful roughly 29 percent against-vote on the 2026 say-on-pay proposal.
In the summer of 2026, Apollo Global Management shows two faces at once: a fee business that has beaten its own targets for years (2025 origination of $305 billion versus a planned $150 billion, record FRE in the second quarter of 2026), and a retirement services arm whose balance sheet is so large and complex that a single tax decision in Bermuda could flip reported consolidated income by $1.93 billion into the red — while the adjusted numbers ran at record pace throughout. The real, lasting Achilles' heel isn't the Bermuda charge; it's Athene's interest-rate sensitivity ($4.7 billion on just 100 basis points) and the fact that 64 percent of fund investments are priced by model rather than by market. Not investment advice.
What Our Rating Means
Open questions
The business works in principle, but one material question is open. As long as it stays open, our findings do not carry a quality verdict.
The asset management business is demonstrably healthy — record fee income, an origination platform that repeatedly beats its own targets, strong credit ratings. The light sits at yellow because the single largest earnings block in the company — the spread income from retirement services arm Athene — is interest-rate- and valuation-sensitive: its own guidance was cut twice before being met again, and 64 percent of the underlying fund investments are priced by model rather than by market. That's an open operational question, not a substance risk — there is no going-concern warning, no negative equity, and no interest coverage below one. The decision is yours.
A journalistic assessment by our editorial team at the time of the deep dive, based on public sources — not investment advice and not a solicitation to buy or sell. Your personal circumstances (investment goals, risk capacity, taxes) cannot be taken into account. What our levels mean, how verdicts are formed, and what conflicts of interest exist →
Worth Noting
- Apollo showed up on our in-house stock scanner right after the August 4, 2026 earnings release — flagged with a rare double signal of a strikingly high trailing P/E (roughly 81) and sharply negative TTM quarterly earnings growth (−57.3 percent), both consequences of the same Bermuda one-time charge in the first quarter of 2026.
- Valuation figures are dated and evergreen: market capitalization roughly $76.8 billion, trailing P/E 81.22, forward P/E 14.20 (all data as of August 5, 2026); daily prices are not a buy argument.
- Not to be confused: the GAAP net loss applies only to the first quarter of 2026 (not the full year), and was already replaced by a $1,336 million GAAP profit in the second quarter of 2026.
Stock Watch
This analysis is as of August 26, 2026. Stock Watch will tell you what's changed at APO since then.
Later $1 a month per stock — signing up is free, and you'll be the first to know when it launches.
The full analysis as a PDF for later
We will send you this analysis as a PDF — to print, file away, and read at your own pace. And we will add you to the free Stock Watch list for Apollo Global Management, Inc. (APO), so you hear about it when something material in this analysis changes.
Frequently Asked Questions
Apollo reported a GAAP net loss of $1.93 billion attributable to common stockholders in the first quarter of 2026, even though pre-tax income was a positive $283 million. The cause was a one-time, non-cash tax valuation allowance of roughly $1.7 billion in Bermuda, after Apollo revoked subsidiary ACRA's Bermuda tax election. By the second quarter of 2026, GAAP net income was back to $1,336 million.
FRE is the fee income from Apollo's traditional asset management business — predictable, independent of fund performance ($785 million in the second quarter of 2026, a record). SRE is the interest-rate spread that retirement services arm Athene earns between what it promises customers and what it earns on their money ($877 million in the second quarter of 2026, also a record) — a figure that reacts more sharply to interest rates and competition.
Apollo paid a $1.99 per share dividend in 2025 (2024: $1.81, 2023: $1.69) and has stated a 2026 target of $2.25 per share. That works out to a forward dividend yield of roughly 1.79 percent (data as of August 5, 2026). Apollo also repurchased roughly $1.6 billion of its own stock over the trailing twelve months.
Apollo Global Management (NYSE: APO) runs two businesses under one roof: traditional asset management, which collects fees for managing credit, private equity and infrastructure funds, and retirement services arm Athene, which sells retirement annuities and invests the premiums in higher-yielding assets. The two are connected by an "origination engine": Apollo directly originates a growing share of its loans instead of buying them in the open market.
The trailing P/E of roughly 81 (data as of August 5, 2026) is based on trailing-twelve-month diluted EPS of $1.64 — and that window still contains the Bermuda-related loss from the first quarter of 2026. The forward P/E, based on analyst estimates for the current fiscal year, sits at roughly 14, much closer to what the underlying operating trend suggests.
Athene makes up the largest share of Apollo's balance sheet and carries real interest-rate sensitivity: per the 10-Q as of March 31, 2026, an immediate 100-basis-point rate increase would reduce pre-tax income by an estimated $4.7 billion. In addition, 64 percent of fund investments are priced by valuation model rather than market price — a structural, ongoing risk factor, unlike the one-time Bermuda tax charge.
Found an error?
Did you spot a factual error, an outdated number, or a typo in this deep dive? Let us know briefly — your report goes straight to the editorial team.