AAQS Backtested: 16.95% a Year Since 1993 — and Just 0.77 Percentage Points Ahead Since 2010
The AAQS awards one point for each of ten quality criteria a company meets, ten in total. We rebuilt two mechanical portfolios around that score and ran them across the entire US stock market, survivorship-free, from January 1993 through August 2026. Over the full stretch the lead over the S&P 500 looks enormous — but we trust that number the least ourselves, because barely a quarter of the market carried a score at all in the late 1990s. In the window we do trust, from 2010 onward, the looser rule leads by well under one percentage point while the stricter rule holds up far better. We also tested a rebuild of our published quality traffic light against 454 real judgments.
 Thomas Mücke
Founder & Publisher
Thomas Mücke
Founder & Publisher
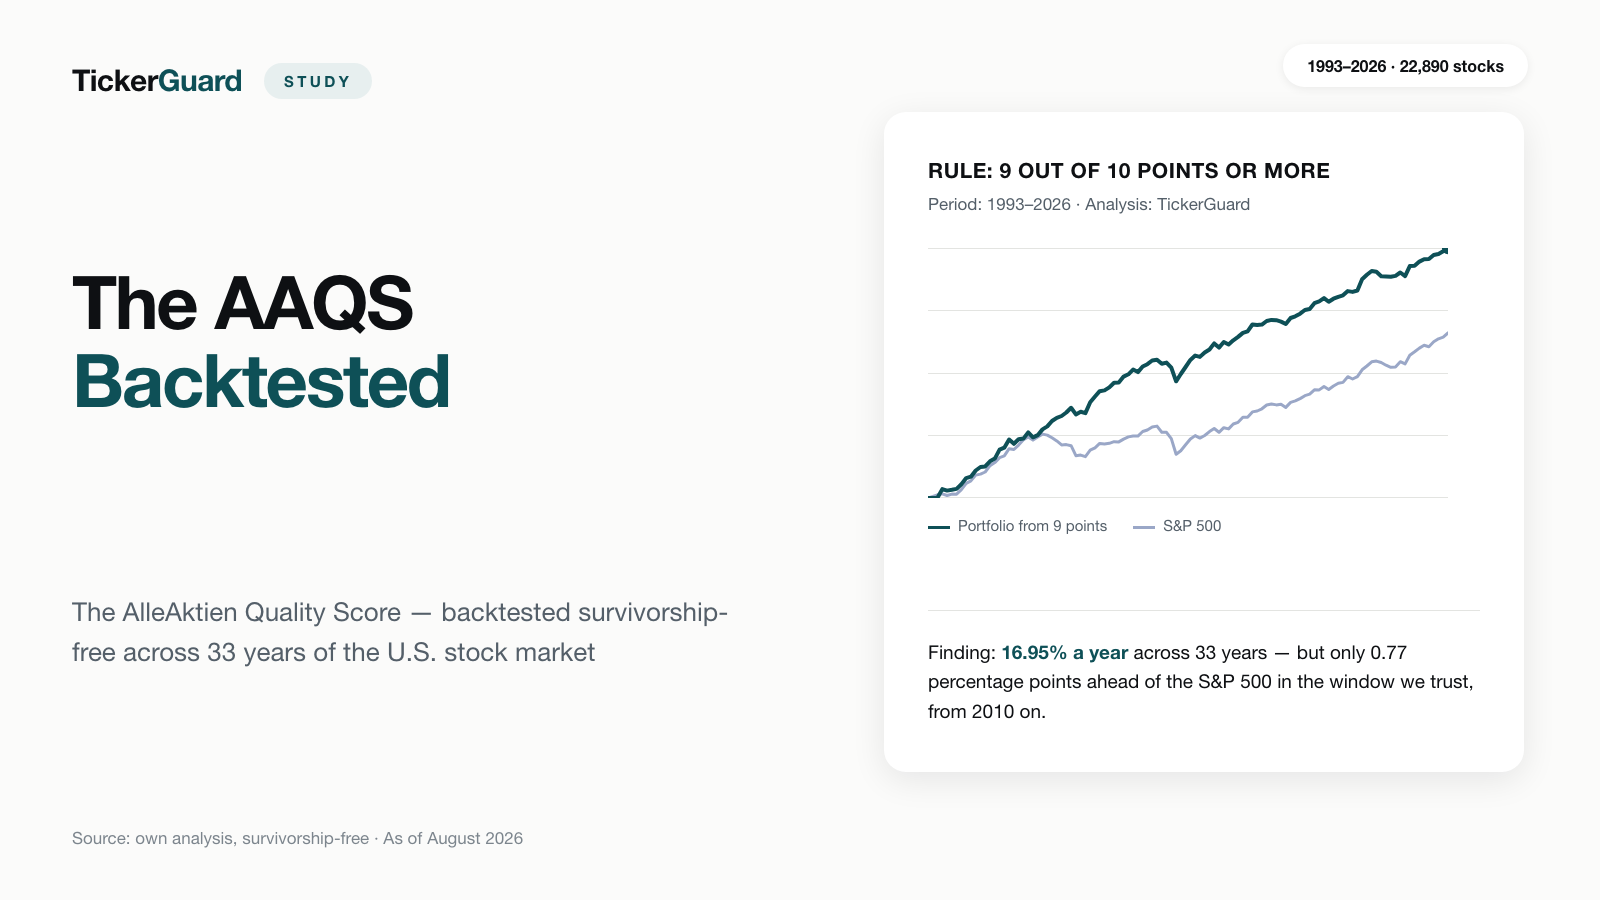
The AAQS — the AlleAktien Quality Score — awards one point for each of ten criteria a company meets, ten in total. We recalculated what two mechanical portfolios built on that score would have returned across the entire US stock market from January 1993 through August 2026 — survivorship-free, including every company that has since vanished from the exchange. Every figure in this study is a simulated result of a mechanical rule — no such portfolio ever existed and no investor earned these returns.
Over the full stretch the result looks spectacular: Portfolio A, buying once a stock reaches 9 out of 10 points and selling the moment the score drops below that, returned 16.95% a year against 10.9% for the S&P 500. That is exactly the number we trust least ourselves. Through the 1990s only a fraction of the market carried a score at all, and from 1997 to 2000 coverage fell to between 24% and 29%. A sampling gate we built decided the calculation only becomes reliable from 2010 onward.
Inside that reliable window the lead shrinks dramatically. Portfolio A returned 15.04% a year against 14.27% for the S&P 500 — a lead of just 0.77 percentage points. Portfolio B, the stricter rule that buys only at a perfect 10, returned 17.08%, a lead of 2.81 points. That inverts the obvious expectation: it is not the looser threshold that carries the result, but the stricter one.
The result in four numbers
Does the ten-part quality score AAQS hold up as a mechanical buy rule? We tested it across the entire US stock market, survivorship-free, from January 1993 through August 2026. Four numbers carry the result:
- 16.95% a year is what Portfolio A (buying from 9 of 10 points) returned over the full 1993-through-2026 stretch, against 10.9% for the S&P 500 — and that is the number we trust least ourselves, because coverage was thin through the 1990s.
- +0.77 percentage points is all that was left of Portfolio A's lead in the window we trust, from 2010 on (15.04% against 14.27% for the S&P 500).
- 17.08% a year is what Portfolio B (a perfect 10 of 10 points only) returned in that same window — a lead of +2.81 percentage points over the index; it was the stricter rule that held up, not the looser one.
- 17.65% a year is what Portfolio B managed from 2010 with the one added condition, out of eight tested, that held up in both portfolios: revenue acceleration — on a third fewer buys (1,315 instead of 2,003).
Over the full stretch the score looked spectacular; in the window we trust, from 2010 on, the broad buy from 9 points barely kept its lead, while the stricter 10-point rule held up more clearly.
The universe is 22,890 US stocks, and 16,484 of them — 72.01% — are delisted today: bankruptcies, takeovers, quiet exits. All stay in the sample for as long as they actually traded, which is what makes the test survivorship-free; counting only stocks still listed today would flatter the past. Trading happens the next trading day after a signal at the closing price, equal-weighted across every position, on dividend- and split-adjusted prices. The buy filter requires a minimum price of $1 and a minimum market value of $100 million. The base case runs without trading costs; a separate sensitivity run charges 0.1% per side.
| Metric | Portfolio A (9 out of 10 points or more) | Portfolio B (10 out of 10 points only) | S&P 500 (market-cap weighted) | S&P 500 (equal weight) |
|---|---|---|---|---|
| $100 would have grown to | $19,019.40 | $16,041.24 | $3,206.33 | $1,229.99 |
| Return a year | 16.95% | 16.36% | 10.9% | 11.39% |
| Worst drawdown | −48.07% | −46.18% | −55.19% | −59.92% |
| Volatility | 18.82% | 19.12% | 18.56% | 19.75% |
| Return per unit of volatility | 0.93 | 0.89 | 0.65 | 0.65 |
| Years measured | 33.52 | 33.52 | 33.52 | 23.27 |
| Average number of holdings | 249.2 | 102.9 | — | — |
| Buys and sells | 4,342 | 2,003 | — | — |
| Completed trades | 4,096 | 1,903 | — | — |
| Share of winning sells | 62.9% | 63.2% | — | — |
| Turnover a year | 49.0% | 55.2% | — | — |
| Buys into companies that later vanished | 17.1% | 12.9% | — | — |
Portfolio A turned $100 into $19,019.40 over the full 33.52-year stretch, Portfolio B into $16,041.24. The S&P 500 reached $3,206.33, its equal-weighted counterpart $1,229.99. Portfolio A's worst drawdown, at −48.07%, is milder than the S&P 500's −55.19% and far milder than the equal-weighted index's −59.92%; Portfolio B's −46.18% is milder still. Both portfolios also carry more return per unit of volatility: 0.93 for A and 0.89 for B, against 0.65 for both indices.
Portfolio A held 249.2 positions on average against Portfolio B's 102.9, generated 4,342 orders against 2,003, and turned its capital over 49.0% a year against 55.2%. A win rate of 62.9% for Portfolio A and 63.2% for Portfolio B sounds solid until read the other way round: close to four trades in ten still lose money. And 17.1% of Portfolio A's purchases — 12.9% for Portfolio B — went into companies that later disappeared entirely.
One qualification, not a footnote: the equal-weighted S&P 500 series only begins on 30 April 2003, a 23.27-year span, so its 11.39% is not measured over the same period as the other three columns. One reassurance too, since readers of backtest studies are used to the opposite: both portfolios and both comparison series trade dividend-adjusted prices, so the comparison is fair in that respect.
Why we do not trust our own headline number
A rule that only a quarter of the market could even qualify for is not a rule tested at any real scale. Coverage sank to between 24% and 29% from 1997 to 2000, meaning roughly seven in ten stocks in those years carried no score and could never be bought, whatever their quality. We built a sampling gate to decide, independently of the outcome, from which year the calculation deserves to be called reliable — and it settled on 2010. The table below repeats the headline metrics, normalized to $100 on 4 January 2010.
| Metric | Portfolio A (9 out of 10 points or more) | Portfolio B (10 out of 10 points only) | S&P 500 (market-cap weighted) | S&P 500 (equal weight) |
|---|---|---|---|---|
| $100 would have grown to | $1,021.29 | $1,367.86 | $914.28 | $717.63 |
| Return a year | 15.04% | 17.08% | 14.27% | 12.61% |
| Worst drawdown | −38.7% | −37.17% | −33.72% | −39.04% |
| Lead over the S&P 500 | +0.77 pp | +2.81 pp | — | −1.66 pp |
Over the 16.59 years since 4 January 2010, Portfolio A turned $100 into $1,021.29 and Portfolio B into $1,367.86, against $914.28 for the S&P 500 and $717.63 for its equal-weighted counterpart — a lead of 0.77 points for Portfolio A and 2.81 for Portfolio B. It is the stricter rule, not the looser one, that wins in the stretch we trust. Drawdowns tightened too, to −38.70% and −37.17%, close to the S&P 500's −33.72% but well inside the equal-weighted index's −39.04%.
Worth stating plainly: 16.6 years is essentially one market cycle, and a friendly one — recovery from the financial crisis, a decade-long bull market interrupted mainly by 2022, no extended bear market of the kind the 1990s or 2000s produced. A single friendly cycle is not proof the pattern holds in a hostile one.
What the score checks
The AAQS (AlleAktien Quality Score) is based on the criteria catalogue developed and published by AlleAktien. We calculate it independently from our own business figures; there is no partnership.
Just as clearly, here is what we did NOT test: this is our own rebuild of that criteria catalogue, not the score AlleAktien publishes. Three of the ten criteria had to be replaced by substitutes for the historical run, and we never compared our reconstructed scores against the values AlleAktien actually published. AlleAktien took no part in this study and has neither reviewed nor endorsed it.
The full catalogue, one point for each criterion met:
- Revenue growth over the last 10 years above 5% a year
- Expected revenue growth for the next 3 years above 5% a year
- EBIT growth over the last 10 years above 5% a year
- Expected EBIT growth for the next 3 years above 5% a year
- Net financial debt below four times EBIT
- EBIT positive in every one of the last 10 years
- Largest EBIT decline under 50%
- Tangible return on equity above 15%
- Return on capital employed (ROCE) above 15%
- Expected return — free-cash-flow yield plus expected EBIT growth — above 10%
From 9 of 10 points, a stock counts as a quality stock under this catalogue (AlleAktien's own description of the score). We also run it live: our AAQS scanner recomputes the same criteria catalogue daily; the backtest results do not carry over to it. The table below breaks both portfolios and both benchmarks down year by year.
| Year | Portfolio A (9 out of 10 points or more) | Portfolio B (10 out of 10 points only) | S&P 500 (market-cap weighted) | S&P 500 (equal weight) |
|---|---|---|---|---|
| 1993 (partial year) | +21.04% | +1.31% | +8.64% | — |
| 1994 | +1.32% | −0.24% | +0.4% | — |
| 1995 | +38.91% | +30.7% | +38.04% | — |
| 1996 | +23.25% | +24.51% | +22.56% | — |
| 1997 | +41.37% | +42.14% | +33.48% | — |
| 1998 | +20.5% | +16.86% | +28.69% | — |
| 1999 | +11.03% | +9.6% | +20.39% | — |
| 2000 | +23.59% | +25.45% | −9.74% | — |
| 2001 | +22.83% | +12.72% | −11.76% | — |
| 2002 | +0.46% | −2.51% | −21.58% | — |
| 2003 | +49.65% | +48.58% | +28.18% | +33.45% |
| 2004 | +30.13% | +26.26% | +10.7% | +16.48% |
| 2005 | +13.06% | +11.48% | +4.83% | +7.41% |
| 2006 | +19.02% | +16.79% | +15.85% | +15.46% |
| 2007 | +9.84% | +7.03% | +5.15% | +0.91% |
| 2008 | −27.58% | −25.58% | −36.79% | −40.06% |
| 2009 | +44.85% | +43.36% | +26.35% | +44.61% |
| 2010 | +24.35% | +25.57% | +15.06% | +21.37% |
| 2011 | +4.55% | +10.64% | +1.9% | −0.66% |
| 2012 | +18.49% | +16.42% | +15.99% | +17.16% |
| 2013 | +38.59% | +44.67% | +32.31% | +35.54% |
| 2014 | +4.35% | +7.82% | +13.46% | +14.06% |
| 2015 | −0.14% | +1.63% | +1.23% | −2.67% |
| 2016 | +17.18% | +17.58% | +12.0% | +14.5% |
| 2017 | +25.8% | +26.84% | +21.71% | +18.52% |
| 2018 | −3.92% | −4.77% | −4.57% | −7.84% |
| 2019 | +30.85% | +30.99% | +31.22% | +28.91% |
| 2020 | +25.4% | +31.67% | +18.33% | +12.66% |
| 2021 | +29.84% | +29.1% | +28.73% | +29.41% |
| 2022 | −17.07% | −20.43% | −18.18% | −11.62% |
| 2023 | +27.52% | +41.03% | +26.18% | +13.7% |
| 2024 | +11.29% | +15.37% | +24.89% | +12.79% |
| 2025 | +14.33% | +14.28% | +17.72% | +11.21% |
| 2026 (partial year) | +15.12% | +16.14% | +14.0% | +15.83% |
The dot-com bust is where the score's discipline shows most clearly: Portfolio A gained 23.59% in 2000 and 22.83% in 2001, essentially flat at 0.46% in 2002, while the S&P 500 lost 9.74%, 11.76% and 21.58% in those same three years. A score built on ten years of actual profitability kept earnings-free story stocks out of the portfolio in exactly the years that punished them hardest.
2008 tells a different story: Portfolio A fell 27.58% and Portfolio B 25.58%, sharply better than the S&P 500's −36.79% and the equal-weighted index's −40.06%, but still a serious drawdown — a quality filter reduces damage in a systemic crash, it does not prevent it. 2022 splits the two rules: Portfolio A lost 17.07%, a touch better than the S&P 500’s −18.18%, while the stricter Portfolio B lost 20.43% and finished behind the index.
2024 is the counter-example worth stating plainly: Portfolio A returned 11.29% against 24.89% for the S&P 500. A score built on profitability and moderate leverage does not buy the handful of mega-cap technology stocks that carried the index that year — the rule falls behind in exactly the concentrated rally it was never designed to chase. 1993 and 2026 are partial years in the table below, starting late January 1993 and ending early August 2026.
| Year | tradable | of those, gone today | with financial statements | with a score | coverage |
|---|---|---|---|---|---|
| 1993 | 1,555 | 453 | 1,500 | 1,119 | 72.0% |
| 1994 | 1,733 | 516 | 1,666 | 1,215 | 70.1% |
| 1995 | 1,915 | 578 | 1,838 | 1,359 | 71.0% |
| 1996 | 2,103 | 659 | 2,007 | 1,526 | 72.6% |
| 1997 | 5,863 | 4,322 | 2,575 | 1,703 | 29.0% |
| 1998 | 6,260 | 4,641 | 2,731 | 1,842 | 29.4% |
| 1999 | 8,354 | 6,654 | 3,126 | 1,994 | 23.9% |
| 2000 | 8,200 | 6,428 | 3,317 | 2,339 | 28.5% |
| 2001 | 7,708 | 5,853 | 3,478 | 3,071 | 39.8% |
| 2002 | 7,220 | 5,301 | 3,613 | 3,195 | 44.3% |
| 2003 | 7,232 | 5,247 | 3,799 | 3,320 | 45.9% |
| 2004 | 7,304 | 5,223 | 4,025 | 3,517 | 48.2% |
| 2005 | 7,381 | 5,213 | 4,269 | 3,743 | 50.7% |
| 2006 | 7,414 | 5,135 | 4,508 | 4,007 | 54.0% |
| 2007 | 7,490 | 5,110 | 4,783 | 4,308 | 57.5% |
| 2008 | 7,309 | 4,868 | 4,918 | 4,463 | 61.1% |
| 2009 | 7,162 | 4,666 | 5,022 | 4,564 | 63.7% |
| 2010 | 7,242 | 4,647 | 5,251 | 4,760 | 65.7% |
| 2011 | 7,205 | 4,533 | 5,429 | 4,948 | 68.7% |
| 2012 | 7,222 | 4,450 | 5,613 | 5,156 | 71.4% |
| 2013 | 7,320 | 4,417 | 5,917 | 5,457 | 74.5% |
| 2014 | 7,621 | 4,542 | 6,301 | 5,874 | 77.1% |
| 2015 | 7,787 | 4,568 | 6,562 | 6,240 | 80.1% |
| 2016 | 7,897 | 4,563 | 6,736 | 6,421 | 81.3% |
| 2017 | 7,949 | 4,445 | 6,900 | 6,597 | 83.0% |
| 2018 | 7,908 | 4,193 | 7,069 | 6,772 | 85.6% |
| 2019 | 7,708 | 3,801 | 7,104 | 6,815 | 88.4% |
| 2020 | 8,349 | 4,130 | 7,586 | 7,102 | 85.1% |
| 2021 | 10,056 | 5,287 | 9,025 | 8,315 | 82.7% |
| 2022 | 9,120 | 4,167 | 8,684 | 8,567 | 93.9% |
| 2023 | 8,289 | 3,154 | 7,967 | 7,946 | 95.9% |
| 2024 | 7,508 | 2,035 | 7,184 | 7,128 | 94.9% |
| 2025 | 7,190 | 1,232 | 6,820 | 6,757 | 94.0% |
| 2026 | 6,851 | 446 | 6,331 | 6,331 | 92.4% |
None of the year-by-year swings above mean much without knowing how much of the market actually carried a score at the time. In 1993, 1,119 of 1,555 tradable stocks — 72.0% — already had one. That share collapsed as the decade went on: to 29.0% in 1997 (1,703 of 5,863 tradable stocks), and to just 23.9% in 1999 (1,994 of 8,354), the weakest year in the entire study. It climbed back only slowly — 28.5% in 2000, 50.7% in 2005, 65.7% in 2010, 80.1% in 2015, 85.1% in 2020, 92.4% by 2026.
The collapse from 1997 has a specific cause: from that point on, the price series fill up with thousands of small companies that later vanished from the market entirely and for which usable financial statements were never available. In 1999, 6,654 of the 8,354 tradable stocks are not listed today. A stock with no usable filing gets no score, and no score means it is never bought, however promising it looked at the time — exactly why the earliest years carry a thinner slice of the market, and exactly why we built the separate "window from 2010" section rather than let the full-period headline stand alone.
The next question is what happens when the underlying assumptions change — trading costs, the size filter, the sell rule for stale filings, whether the portfolio keeps its weights balanced. The table below runs six variants against the base case.
| Run | Portfolio A: $100 would have grown to | Portfolio A: return a year | Gap to the base case | Portfolio B: return a year | Gap to the base case |
|---|---|---|---|---|---|
| Base case | $19,019.40 | 16.95% | — | 16.36% | — |
| with trading costs (0.1% per buy and sell) | $17,030.18 | 16.56% | −0.39 pp | 16.0% | −0.36 pp |
| without size filter (micro caps allowed) | $21,164.03 | 17.32% | +0.37 pp | 16.49% | +0.13 pp |
| without selling on stale filings | $19,035.25 | 16.95% | 0.00 pp | 16.37% | +0.01 pp |
| without rebalancing | $13,808.95 | 15.84% | −1.11 pp | 15.52% | −0.84 pp |
| buys only when the traffic light is not red | $18,705.50 | 16.89% | −0.06 pp | 16.2% | −0.16 pp |
Trading costs, at 0.1% per side, cost roughly 0.4 points a year — 16.95% falls to 16.56% for Portfolio A, 16.36% to 16.00% for Portfolio B. Dropping the size filter and letting the smallest, least liquid stocks back in actually improves the result slightly, to 17.32% and 16.49%: the rule is not carried by a handful of illiquid micro-caps. Turning off the sell trigger for stale filings makes essentially no difference — 16.95% and 16.37%. The most expensive assumption is not rebalancing: without continually restoring equal weights, the result drops to 15.84% and 15.52%, a loss of 1.1 points — part of this study's return comes directly from re-equalizing position sizes, not stock selection alone.
The counter-check: the same rule without forward-looking criteria
We also ran the rule with three criteria removed. Criteria 2, 4 and 10 depend on future expectations no longer available as history; the main run substitutes trailing three-year growth, the counter-check drops all three, scoring to a maximum of 7 with thresholds of 6 of 7 and 7 of 7. Full period: $13,723.81 for Portfolio A — 15.82% at −49.75% — and $12,119.24 for Portfolio B, 15.39% at −48.51%. From 2010: 14.12% and 15.72%. Main run and counter-check are not directly comparable, since they score a different number of criteria — but the counter-check moves the same direction, surviving the loss of every forward-looking criterion.
The traffic light: a rebuild, not a record
The important honesty comes first: the quality traffic light published alongside our analyses is an editorial judgment. It does not exist for the past and cannot be reconstructed retroactively. What we tested instead is a rule-based rebuild: buy only if a stock is not red on the day of purchase, "not red" combining green and amber. Four warning signs feed it, each computed from the figures published as of the purchase date — insofar as those were not restated later:
- Equity has been wiped out (negative).
- Operating income does not cover interest expense (interest coverage below 1).
- Two consecutive years of cash outflow from operations despite a reported profit.
- Cash on hand would not last a year at the current rate of outflow.
What a human reader sees and the rebuild cannot: an auditor's going-concern note, a dispute or change at the top of the company, dependence on one customer or lender, a looming delisting. And the rebuild only filters purchases — a holding already in the portfolio is not sold when it turns red. The table below tests it against 454 published judgments we could recalculate as of their publication date.
| published green | published amber | published red | Total | |
|---|---|---|---|---|
| Rebuild: red | 4 | 93 | 78 | 175 |
| Rebuild: not red | 20 | 232 | 27 | 279 |
| Total | 24 | 325 | 105 | 454 |
Of 105 truly red judgments, the rebuild caught 78 — a recall of 74.3%. But of the 175 red flags it raised in total, only 78 were actually red — a precision of just 44.6%. It finds most of the real warning signs, but more than half its red flags are false alarms. The largest driver is interest coverage, responsible for 89 of them, well ahead of equity (14) and cash runway (12); operating cash flow produced not a single false alarm on its own.
In practice the rebuild mostly turns ambers into false reds — a company with a manageable weakness gets treated like one genuinely in trouble. Whether the filter actually helps returns is a different question, which the table below answers directly.
| Run | without the filter | with the filter | Difference |
|---|---|---|---|
| Portfolio A, full stretch | 16.95% | 16.89% | −0.06 pp |
| Portfolio B, full stretch | 16.36% | 16.2% | −0.16 pp |
| Portfolio A, from 2010 | 15.04% | 14.86% | −0.18 pp |
| Portfolio B, from 2010 | 17.08% | 16.98% | −0.10 pp |
| Portfolio A, counter-check without forward-looking criteria | 15.82% | 15.74% | −0.08 pp |
| Portfolio B, counter-check without forward-looking criteria | 15.39% | 15.21% | −0.18 pp |
The filter costs something in every one of the six runs, never more than 0.2 points: Portfolio A drops from 16.95% to 16.89% over the full period, 15.04% to 14.86% from 2010, and 15.82% to 15.74% in the counter-check; Portfolio B drops from 16.36% to 16.2%, 17.08% to 16.98%, and 15.39% to 15.21%. Exactly what the calibration above would predict: a filter that gets less than half its own warnings right mostly excludes healthy companies rather than protecting against failing ones — small in every run, but the same direction in all six.
The improvement sweep: eight added conditions, one holds up in both portfolios
A score tells you how good a business looks today. It says nothing about when to buy it, how long to hold it, or what to pay. So we stress-tested the rule set in a run of its own: eight added conditions, each measured once without and once with trading costs of 0.1% per side — 16 runs, each of them computing both portfolios at once, across the full period and again in the window we trust, from 2010 on.
The eight conditions cover four ideas that come up again and again around quality portfolios. Trend: buy only above the 200-day line. Momentum: buy only when the stock beat the benchmark over the past six months. A stickier sell rule: do not sell the moment the score slips below the buy threshold, but one or two points below it. Valuation: buy only at a free-cash-flow yield of 0%, 3% or 5% and up. And finally, the only condition that looks at the pace of the business rather than the price: revenue acceleration — the latest fiscal year must have grown faster than the annual average of the three years before it.
The result up front: seven of the eight conditions do nothing for the stricter rule in the window we trust, or cost it return. The eighth delivers more return on a third less trading.
| Run | Portfolio A: full period | Portfolio A: from 2010 | Portfolio A: buys | Portfolio B: full period | Portfolio B: from 2010 | Portfolio B: buys |
|---|---|---|---|---|---|---|
| Base case (no added condition) | 16.95% (16.56%) | 15.04% (14.66%) | 4,342 | 16.36% (16.0%) | 17.08% (16.72%) | 2,003 |
| buys only above the 200-day line | 16.65% (16.26%) | 14.85% (14.48%) | 4,012 | 15.8% (15.45%) | 16.66% (16.31%) | 1,808 |
| buys only with a stronger half-year than the benchmark | 17.08% (16.69%) | 14.92% (14.55%) | 3,947 | 16.69% (16.33%) | 16.91% (16.55%) | 1,761 |
| sell only one point below the buy threshold | 16.13% (15.83%) | 14.72% (14.43%) | 3,387 | 16.07% (15.81%) | 16.5% (16.23%) | 1,529 |
| sell only two points below the buy threshold | 15.6% (15.34%) | 14.43% (14.17%) | 3,097 | 15.64% (15.41%) | 16.2% (15.96%) | 1,426 |
| buys only with a free-cash-flow yield of 0% or more | 17.17% (16.8%) | 15.31% (14.94%) | 4,023 | 16.32% (15.97%) | 17.08% (16.73%) | 1,884 |
| buys only with a free-cash-flow yield of 3% or more | 16.7% (16.32%) | 14.38% (14.01%) | 3,353 | 14.85% (14.49%) | 15.54% (15.19%) | 1,423 |
| buys only with a free-cash-flow yield of 5% or more | 14.66% (14.29%) | 14.43% (14.06%) | 2,739 | 15.05% (14.68%) | 15.25% (14.9%) | 1,098 |
| buys only with revenue acceleration | 17.05% (16.71%) | 15.74% (15.4%) | 2,997 | 15.95% (15.63%) | 17.65% (17.33%) | 1,315 |
| S&P 500 (SPY) | 10.9% | 14.27% | — | 10.9% | 14.27% | — |
Exactly one of the eight conditions holds up in both portfolios: revenue acceleration. With it, Portfolio B returns 17.65% a year from 2010 instead of 17.08% — 17.33% instead of 16.72% after trading costs. More remarkable than the half point is what it costs: the condition cuts the number of buys from 2,003 to 1,315, roughly a third fewer. More return on a third less trading is the rarer and the more credible kind of improvement — it comes from doing less, not from doing more.
Honesty requires the other side. Across the full period since 1993 the same version of Portfolio B lands behind the base case, at 15.95% a year against 16.36%. For Portfolio A the condition helps in both windows — 17.05% against 16.95% over the full period and 15.74% against 15.04% from 2010. Which portfolio you are looking at matters here: in the window from 2010 Portfolio A is the weaker of the two rules (15.04% against 17.08%), while across the full period it leads (16.95% against 16.36%). We weight the window from 2010 more heavily because the early years are too thinly populated; anyone who trusts the full period more will read the Portfolio B finding as weaker.
The remaining seven conditions are counter-checks. Four findings stand out:
- The stickier sell rule hurts rather than helps. The assumption that the portfolio sells too twitchily, and that a buffer of one or two points would avoid churn, does not survive: from 2010 Portfolio B falls from 17.08% to 16.5% (one point of buffer) and 16.2% (two points), Portfolio A from 15.04% to 14.72% and 14.43%. Selling on the drop below the buy threshold is not a design flaw in the rule set — it is part of what makes it work.
- The trend filter costs. Buying only above the 200-day line pushes Portfolio B from 17.08% down to 16.66% from 2010, and Portfolio A from 15.04% to 14.85%. The filter apparently holds back precisely those quality stocks that have just become cheap.
- Of the valuation hurdles only the lowest helps — and only one portfolio. A free-cash-flow yield of 0% leaves Portfolio B unchanged (17.08% from 2010) but gains Portfolio A 0.27 percentage points (15.31% instead of 15.04%; 14.94% instead of 14.66% after trading costs). Set higher, the hurdle costs in both portfolios. From 3% Portfolio B drops to 15.54% and Portfolio A to 14.38%, from 5% to 15.25% and 14.43% respectively. That is not a clean “the higher the worse” staircase — for Portfolio A the 5% hurdle even edges out the 3% one. What it reliably costs is choice: for Portfolio B the 3% hurdle cuts buys from 2,003 to 1,423, the 5% hurdle nearly halves them (1,098).
- Momentum is not robust. Over the full period the condition looks good (Portfolio B 16.69% against 16.36%); in the window we trust it reverses (16.91% against 17.08%). An edge that disappears exactly in the stretch we trust most is not an edge to build a portfolio on.
What we did with it: our AAQS scanner still lists every stock with the full score of 10 out of 10 — revenue acceleration excludes nobody. It flags: hits whose latest fiscal year grew faster than the average of the three years before it carry a badge and sit at the top of the list, and a column of its own quantifies the edge in percentage points. That is the cautious translation of a finding that holds in one window and not in the other: make it visible, do not filter on it.
Limits of the method
- The score is reconstructed, not recorded. Nobody logged, twenty years ago, how many points a stock carried; this backtest computes it retroactively from figures already published as of each date.
- Restatements distort the reconstruction. Where a later correction improved a company's figures, the retroactive score comes out more favorably than it would have looked in real time.
- Expectations cannot be rewound. Criteria 2, 4 and 10 depend on forward-looking estimates that no longer exist historically; the main run substitutes trailing three-year growth, the counter-check drops all three.
- The early years are thinly populated — exactly why the window-from-2010 section is mandatory, not a footnote.
- Share count is only roughly traceable and feeds the size filter through market value; where none existed for early years, the oldest known figure was used.
- The traffic light is a rebuild, not a lookup — see its calibration above against 454 real judgments.
- Taxes and the bid-ask spread stay out of every run; only the dedicated cost run adds 0.1% per side.
- Not every stock is scorable. 9,303 of the 22,890 stocks carry no usable financial statements at all, and a further 59 — 0.26% of the universe — remained unscored at the time of the run. No filing means no score, and no score means no purchase.
- The equal-weighted comparison series only begins in 2003. Its 11.39% a year covers 23.27 years, not the full 33.52 years of the other columns.
- The window we trust is a single market cycle. The 16.59 years from 2010 were mostly friendly; how the same rule fares in a long sideways or high-rate stretch is not measured here.
- Test eight added conditions on the same data and you will find a good one even when none is good. The improvement sweep is therefore a hint, not a proof. In favour of revenue acceleration: in the window we trust it leads on BOTH portfolios while cutting the number of buys sharply. Against it: across the full period it falls behind on Portfolio B. A hint of that strength earns a flag, not a buy rule.
- A backtest is not a promise. It shows what a rule would have returned without a single exception — not what it will return going forward.
What does not follow from this study
This is a historical study, not investment advice. Nothing in it recommends buying or selling any stock, sets a price target, or forecasts any company. A score of 9 or 10 today tells you that a mechanical rule built on that threshold produced a particular historical return across thousands of trades over three decades — it says nothing about what any single stock will do next. Past results, real or simulated, are no reliable indicator of future returns.
Two related studies run the same kind of test on different rules: our Growth Gems backtest retested our own growth-scoring scanner, and our Magic Formula backtest and our study of Benjamin Graham's net-net rule each retested a well-known value formula. The full collection lives under all studies.
Frequently Asked Questions
The AAQS is AlleAktien's ten-point quality scorecard; one point per criterion met. We built two mechanical portfolios on it — buy from 9 points, and buy only at a perfect 10 — and ran both across 22,890 US stocks from January 1993 through August 2026, survivorship-free. What we tested is our own rebuild of that catalogue, not the score AlleAktien publishes; AlleAktien took no part in this study and has neither reviewed nor endorsed it.
Portfolio A would have returned 16.95% a year over the full 1993-through-2026 period, turning $100 into $19,019.40, against 10.9% a year for the S&P 500 — a simulated result before trading costs and tax. That is the number we trust least ourselves; see the next question for why.
Because barely a quarter of the market carried a score at all in the late 1990s — coverage fell to 23.9% in 1999. A rule only a fraction of the market could qualify for is not tested at real scale, so a sampling gate restricts our confidence to 2010 onward.
Portfolio A returned 15.04% a year against 14.27% for the S&P 500, a lead of just 0.77 percentage points. Portfolio B, the stricter rule, returned 17.08%, a lead of 2.81 points — the stricter rule wins in the period we trust most.
The published traffic light is an editorial judgment that cannot be reconstructed for the past, so we tested a rule-based rebuild instead. Against 454 real, published judgments it catches 74.3% of true red flags but is only 44.6% precise, and using it as a filter costs return in every run.
The score itself is reconstructed from historical filings, not recorded at the time; restatements can flatter it; three forward-looking criteria had to be approximated; and the reliable data only really starts around 2010. All twelve limits are listed in full in the study.
We tested eight added conditions one at a time. In the window we trust, from 2010 on, only one holds up in both portfolios: revenue acceleration — faster revenue growth than in the three prior years. Portfolio B then returns 17.65% instead of 17.08% a year, on a third fewer buys. Across the full period it falls behind, so we only flag such stocks.
No. This is a historical study, not investment advice. It contains no buy or sell recommendation, no price target and no forecast for any company. Past results, real or simulated, are no reliable indicator of future returns.


