Sector Tailwind Tested: Weinstein Stages Don't Beat a Simple Ranking
Stan Weinstein's rule: check the sector before the stock – the group pulls the individual name along. We rebuilt that thesis as a pre-registered test: a stage engine on the 30-week average, equal-weighted weekly indices for 11 GICS sectors, and a simple 6-month ranking as the rival. Tested against 9,908 trades from the crash-reversal backtest and 277 positions from the revenue-inflection backtest, the sector tailwind turns out to be real and measurable – in the broad signal arm, Stage-2 and Stage-4 entries sit 20 percentage points apart. But it improves neither recipe tested here: the stage traffic light beats the simple ranking in neither backtest, and for the reversal recipe the weak sector is actually the best pond of all. A sector-rotation strategy is therefore not introduced.
 Thomas Mücke
Founder & Publisher
Thomas Mücke
Founder & Publisher
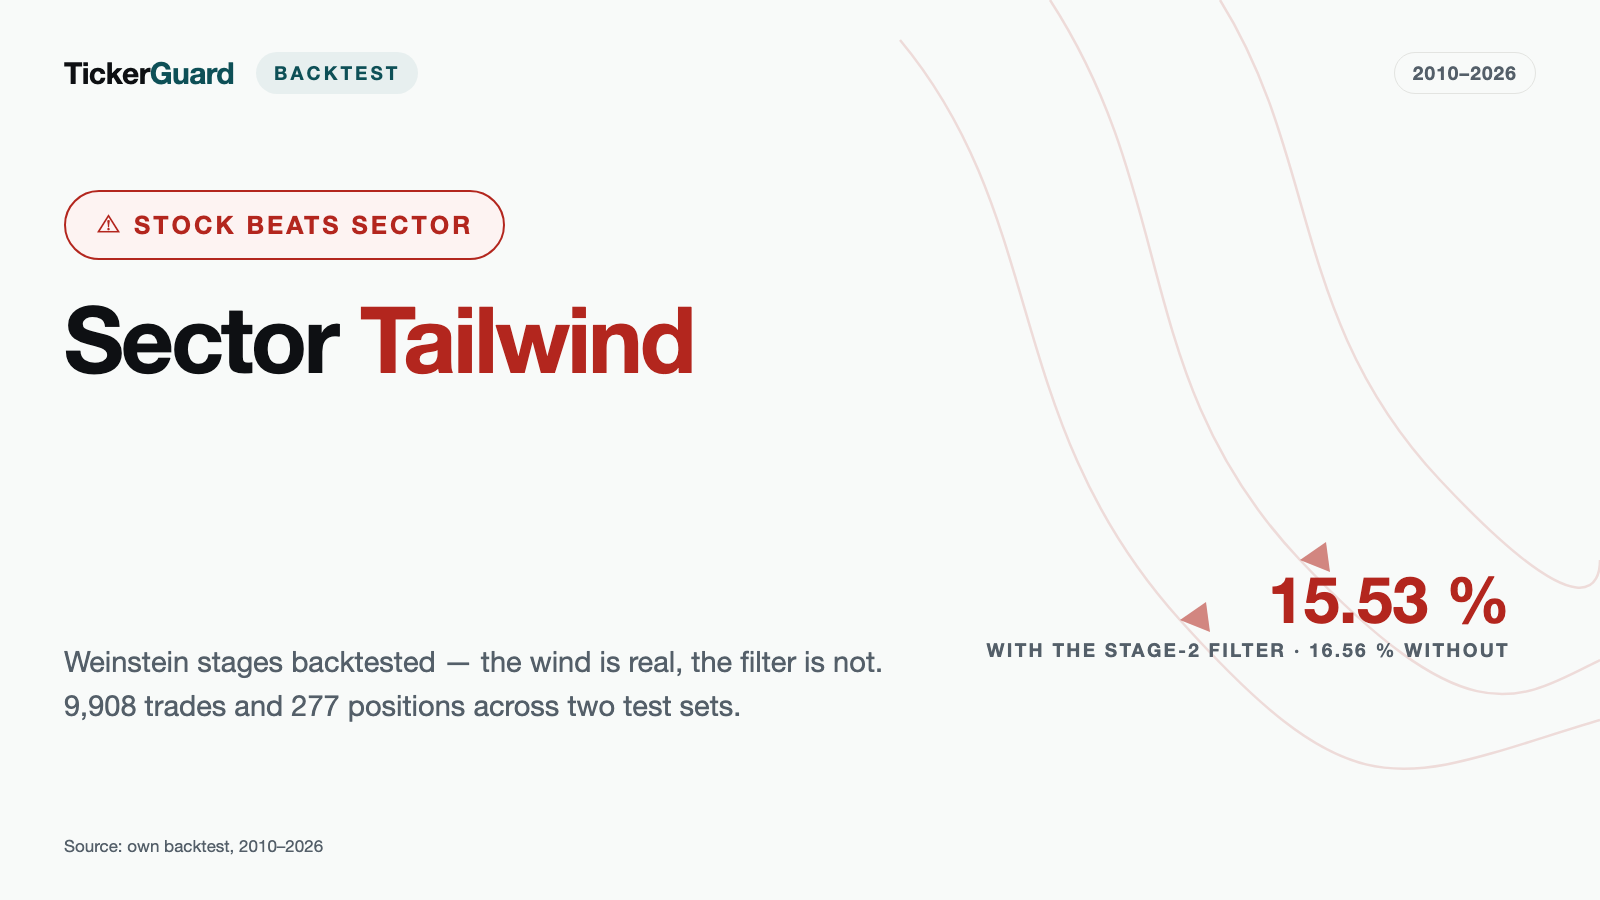
In his 1988 book "Secrets for Profiting in Bull and Bear Markets," Stan Weinstein made a simple claim: before buying a single stock, look at the industry group it belongs to first. His "Forest to the Trees" chapter argues that a strong stock in a weak group rarely stays strong for long — and a weak stock in a strong group often gets pulled along. This study tests whether that idea can be mechanized and applied to two backtests already published in this series: the Crash Reversal Backtest and the Revenue Inflection Backtest. The result comes in two parts: the sector tailwind is real and measurable — but it does not improve either of the two recipes tested here.
The result in four numbers
Does Stan Weinstein's sector staging add anything as a filter beyond a plain ranking of sectors by relative strength? We tested that against two backtests already published in this series — the crash-reversal recipe (9,908 trades) and the revenue-inflection recipe (277 positions). Four numbers carry the result:
- 24.29% vs. 4.27% p.a. In the broad signal arm of the revenue-inflection backtest (2,693 positions instead of 277), Stage-2 entries returned 24.29% a year, Stage-4 entries only 4.27% (N = 1,349 vs. 546). The sector tailwind is real — and shows up most where a recipe does the least selecting.
- +1.93 vs. +2.24 percentage points In the crash-reversal recipe, the Stage-2 filter (FA) beat the S&P 500 by 1.93 points, below the simple ranking variant (FB) at 2.24 points. The pre-registered condition "FA beats FB" was missed.
- 15.53% vs. 16.56% In the revenue-inflection recipe, the Stage-2 filter (FA), calculated conservatively, actually sat below the unfiltered recipe (F0). A sector filter did not improve this recipe — it cost return.
- +10.43% vs. +6.39% Of all things, Stage 4, the weak sector, was the best subset in the entire crash-reversal table, with a median of 10.43% across 2,695 trades — against 6.39% across all 9,908 trades. For a recipe that buys crashes, the tailwind idea played out backward.
In the tested window, a measurable sector tailwind existed without the Weinstein stages improving either of the two recipes tested here against the simple ranking.
Weinstein's sector thesis
Weinstein's core claim breaks down into three parts. First: the industry group matters more than the individual stock — staring only at one stock's chart means seeing the trees, not the forest. Second: a stock should be judged by its 30-week moving average, not by short-term swings. Weinstein states this so plainly in the first chapter of his book that there is no doubt about how much weight that line carries:
"Stocks trading beneath their 30-week MAs should never be considered for purchase, especially if the MA is declining."
— Stan Weinstein, "Secrets for Profiting in Bull and Bear Markets," McGraw-Hill, 1988, Chapter 1.
Third, Weinstein measures relative strength against the broad market with the Mansfield formula: ((RP / SMA52(RP)) − 1) × 100, where RP is the price ratio of the stock or group to the index. In Weinstein's day, the purpose-built Mansfield chart service delivered ready-made industry-group charts. That service no longer exists — reconstructing the methodology today means working from the book text itself. For the early chapters (1 through 3, the stage definitions and core mechanics), that works directly from the original text. For the deeper material from Chapter 4 onward, where Weinstein backs up the group analysis with further real-world examples, the full text was only reachable through secondary sources (reviews, summaries, trading forums) within the scope of this study — that gap is disclosed openly here rather than papered over.
Our mechanization: a pre-registered stage engine
Weinstein identified his four stages (1 = basing, 2 = uptrend, 3 = topping, 4 = downtrend) by eye, on a chart. A reproducible test needs a fixed rule instead. The stage engine used here was fixed before the calculation ran and works exclusively off the 30-week moving average and where the index sits relative to that line: it compares the current level of the average to its level four weeks earlier and additionally checks whether the index trades above or below the average. Stage 2 only qualifies as a candidate if the index sits ABOVE the line AND the line has risen by more than 0.5% over those four weeks; Stage 4 only if the index sits BELOW the line AND it has fallen by more than 0.5%. Everything in between is a transitional stage: Stage 3 after an uptrend, Stage 1 after a downtrend. A stage change is only confirmed after two consecutive weeks carrying the same signal, so a single outlier week cannot flip the stage. As a robustness check, the same engine was also run on a 40-week average.
There is no Mansfield chart service left to buy for the industry groups themselves — instead, 11 equal-weighted weekly indices were built, one per GICS sector (communication services, consumer discretionary, consumer staples, energy, financials, health care, industrials, information technology, materials, real estate, utilities), each as a chain index starting at 100. A week only counts if the index has at least 20 members. Each company's sector comes from a cascade — first the GICS classification, then a coarser sector field, finally the SEC's SIC code — covering 19,654 of 22,757 symbols (86.4%), 6,065 of 6,338 active stocks (95.7%), and 13,589 of 16,419 delisted stocks (82.8%). As a simple rival to the stage traffic light, there is also a 6-month ranking: every sector is sorted by its trailing six-month return and split into an upper and a lower half (3-month and 12-month variants ran alongside as controls).
So the result could not be bent into shape after the fact, the success rule was written down before the calculation ran:
"Stages count as 'measurably better' only if FA (the Stage-2 filter) beats the FB variant (upper half of the ranking) on the headline metric in BOTH backtests, AND the control groups (GA = Stage 4 only, GB = lower half only) are correspondingly worse." — from this study's pre-registered decision rule, fixed before the calculation was run.
How strong is the sector tailwind on its own?
Before turning the stages loose on the two recipes, it is worth looking at the sector indices by themselves. In 852 scorable weeks per sector (April 9, 2010 through July 31, 2026), they ran very differently:
| Sector | Median members per week | Return p.a. |
|---|---|---|
| Communication Services | 233 | 8.20% |
| Real Estate | 223 | 8.41% |
| Consumer Staples | 186 | 8.76% |
| Consumer Discretionary | 528 | 10.39% |
| Utilities | 124 | 11.41% |
| Energy | 333 | 12.04% |
| Materials | 269 | 12.18% |
| Financials | 1,005 | 12.68% |
| Industrials | 621 | 14.49% |
| Health Care | 810.5 | 14.50% |
| Information Technology | 659 | 15.93% |
Almost eight percentage points separate the weakest sector (Communication Services, 8.20% p.a.) from the strongest (Information Technology, 15.93% p.a.) — the tailwind is real, not a rounding artifact. Measured across all 9,009 scored sector-weeks — the stage series only begins in week 34 of each sector, because neither the average nor the four-week comparison exists before that — the stages break down as follows: Stage 2 (uptrend) 56.4%, Stage 4 (downtrend) 16.3%, Stage 3 (topping) 15.7%, Stage 1 (basing) 11.6% of weeks. The question this study asks is not whether this tailwind exists — the table above already answers that — but whether it adds anything to two stock-picking recipes that are already sharply honed.
Stage 1: tailwind or stock selection?
To answer that, every single trade from the two source backtests was split into two parts: the sector tailwind (the return of the matching sector index over the same holding period) and the stock-specific rest (the difference to the actual trade return). Stage and ranking half were both pulled from the last reading STRICTLY BEFORE the entry date — 19.7% of entries in the crash-reversal recipe land exactly on a weekly close, and taking that day's own reading would have leaked same-day information into the label.
Crash Reversal (9,908 trades)
Across all 9,908 trades of candidate K5 ("11% profit target or day 12 at the latest"), the mean return is 3.64 percentage points, the median 6.39%. The 9,771 trades carrying a sector assignment can be decomposed: there the mean return is 3.62 percentage points, of which only 0.61 points come from the sector tailwind (median 0.46 points) — a tailwind share of 16.8% — and 3.01 points are stock-specific rest (median 4.15 points). Among the 6,498 winning trades, the mean return is +10.99 points, split into +1.59 points of tailwind and +9.41 points of rest; among the 3,273 losing trades, the mean is −11.01 points, split into −1.32 points of tailwind and −9.69 points of rest. On both sides, the stock-specific rest carries the larger share.
Revenue Inflection, K·org arm (277 trades)
In the main arm of the revenue-inflection recipe, the headline number looks different at first glance: across the 268 scorable of the 277 positions, the sector tailwind accounts for roughly half the return on average (6.79 of 13.70 percentage points, 49.6%) — a seemingly much larger sector role. A second look tempers that: the MEDIAN rest is negative (−1.72 points) against a median return of only 2.07% — this figure comes purely from the arithmetic mean and is carried by a handful of large outliers, not by the typical position. Among the 142 winning trades, the mean return is +50.19 points, split into +13.27 points of tailwind and +36.92 points of rest; among the 126 losing trades, the mean is −27.43 points, of which only −0.51 points is tailwind and −26.92 points is rest. Here too, the rest dominates the magnitude — on the losing side, almost entirely.
Core finding of the decomposition: the stock-specific rest dominates the return in both backtests. The sector tailwind explains neither the crash-reversal recipe's nor the revenue-inflection recipe's order of magnitude of gains or losses.
Stage 2: does a sector filter improve the recipes?
The decomposition only shows how much of an already-executed trade's result can be attributed to the tailwind. Whether a sector filter applied BEFORE entry adds value is a separate question, tested for each recipe with F0 as the unchanged recipe, FA as the Stage-2 filter, FB as the filter on the upper ranking half, and the matching controls GA (Stage 4 only) and GB (lower half only).
Crash Reversal (net blended costs, headline metric: vs. S&P winsorized at the 2.5% and 97.5% tails; all figures are per-trade returns, not a portfolio curve)
| Variant | N (share) | Median | vs. S&P winsor. | Hit rate | Target-hit rate |
|---|---|---|---|---|---|
| F0 — all trades | 9,908 (100%) | +6.39% | +1.87 pp | 66.6% | 43.7% |
| FA — Stage 2 only | 3,351 (34%) | +5.28% | +1.93 pp | 64.3% | 41.5% |
| FB — upper ranking half | 4,473 (45%) | +7.83% | +2.24 pp | 68.2% | 46.5% |
| GA — control: Stage 4 only | 2,695 (27%) | +10.43% | +2.55 pp | 72.1% | 52.2% |
| GB — control: lower half | 5,246 (53%) | +5.44% | +1.51 pp | 65.0% | 41.3% |
FA improves slightly on F0 in the vs.-S&P metric (+1.93 instead of +1.87 percentage points) but falls from a median of 6.39% to 5.28% and from a 66.6% hit rate to 64.3%. What matters for the pre-registered comparison: FA, at +1.93 points, sits below FB at +2.24 points — and the control group flips the expected picture entirely. Stage 4 (GA), the ostensibly weak sector, is the BEST subset in the whole table at +2.55 points vs. the S&P and a 52.2% target-hit rate — better than F0, better than FA, better than FB — but only on return: the worst trade in GA sits at −73.6%, exactly the level of the unfiltered recipe, and no filter trims the left tail. For a reversal recipe that buys precisely the crashed stocks, the "tailwind" idea plays out backward: in a weak sector, the preceding crashes are likely to run deeper, and the bounce-back to cover proportionally more ground.
Revenue Inflection, main arm K·org (portfolio return p.a.)
| Variant | N (share) | % p.a. | conservative | Hit rate | max drawdown |
|---|---|---|---|---|---|
| F0 — no filter | 277 (100%) | 26.28% | 16.56% | 52.71% | −24.44% |
| FA — Stage 2 only | 160 (57.8%) | 24.94% | 15.53% | 53.75% | −49.80% |
| FB — upper ranking half | 127 (45.8%) | 29.12% | 15.71% | 55.12% | −49.42% |
| GA — control: Stage 4 only | 33 (11.9%) | 17.22% | 17.22% | 63.64% | −40.00% |
| GB — control: lower half | 141 (50.9%) | 19.15% | 16.34% | 51.06% | −30.98% |
"Conservative" is the calculation excluding the three positions flagged for suspected price-jump artifacts (a monthly return above 200%) — the same convention used in the published revenue-inflection report. In the headline calculation, FB's 29.12% p.a. against F0's 26.28% looks like an improvement at first. Under the conservative calculation, the picture flips: F0 sits at 16.56%, FA at 15.53%, and FB at 15.71% — BOTH filter variants fall below it. FB's apparent headline edge hangs entirely on those three outlier positions. And, just as with the crash-reversal recipe, FA (24.94%) also sits below FB (29.12%) here — the pre-registered "FA beats FB" condition is met in neither backtest. Max drawdown also worsens sharply, from −24.44% (F0) to −49.80% (FA) and −49.42% (FB) — a roughly halved portfolio swings harder, and both filters cut the position count by roughly half.
One important caveat on the GA control in this arm: with only 33 of 277 positions (11.9%), it is actually invested in only 115 of the 163 months in the observation window — the 17.22% p.a. figure describes a portfolio that sat in cash for just under a third of the time, and is not directly comparable to the continuously invested rows above it.
The pre-registered decision
Measured against the rule fixed before the calculation ran, the result is unambiguous — even though it is not what Weinstein's thesis would have predicted:
- Stages do not beat the ranking. In both backtests, FA sits below FB (crash reversal: +1.93 vs. +2.24 points vs. S&P; revenue inflection K·org: 24.94% vs. 29.12% p.a.), and the control groups do not behave symmetrically — in the crash-reversal recipe, the GA control is actually the best subset in the entire table. The more complex tool is therefore NOT pursued further.
- No sector filter is introduced. Under the honest metric — the conservative calculation for revenue inflection, the winsorized vs.-S&P metric excluding the 2020/21 cohorts for crash reversal — no variant robustly improves the already-published recipes. The FB edge in the crash-reversal recipe is only +0.38 percentage points on the winsorized headline metric (+2.24 against +1.87), and on the vs.-S&P median it shrinks from +0.59 to +0.19 percentage points once the 2020/21 cohorts are excluded; for revenue inflection, FB's conservative figure (15.71%) sits below F0 (16.56%).
- Stage 3 — a sector-rotation strategy — is NOT triggered. The pre-registered success criterion for that step (a consistent split in the decomposition, a robust improvement in the filter test, symmetrical control groups) was met on none of the three counts.
Where the tailwind still shows up
The three findings above are not a claim that sectors are irrelevant to stock returns — quite the opposite. In the broad signal arm ALL of the revenue-inflection backtest — 2,693 positions instead of the 277 in the narrow K·org core — the stage traffic light separates very strongly: Stage-2 entries (FA) return 24.29% p.a. (14.05% conservative, N = 1,349), Stage-4 entries (GA) only 4.27% (4.21% conservative, N = 546) — a 20-percentage-point gap. That exact gap shrinks from 20 to 7.7 percentage points in the already-selective main arm K·org (24.94% vs. 17.22%, and GA there also carries the investment-rate problem above). The sector tailwind separates most strongly where the recipe itself does the least selecting — and fades once a recipe already filters sharply.
In the crash-reversal recipe, the direction actually reverses. Stage 4, the weak sector, is the best subset, with a median of +10.43% against +6.39% overall and a 52.2% target-hit rate against 41.5% for Stage 2. There is a plausible economic reason: a reversal recipe buys precisely the crash. In a weak sector, the preceding crashes tend to run deeper on average, and a bounce from further down covers proportionally more ground — the "tailwind" idea holds here, just mirror-reversed.
A further warning sign against a stable effect: the ranking's direction runs opposite between the two revenue-inflection arms. In the main arm K·org, the upper ranking half leads (FB 29.12% vs. GB 19.15%); in the L-alt·org arm, it is clearly the LOWER half that leads (GB 25.97% vs. FB only 7.22%). A filter whose sign depends on which stock segment you look at is measuring noise in the data rather than a stable rule.
Follow-up test: fine industry level
There is an obvious objection to everything above: eleven sectors are too coarse. "Information Technology" throws semiconductor makers and software vendors into the same bucket; "Health Care" mixes early-stage biotech with hospital operators. Weinstein's own notion of a group also sits closer to industry groups than to eleven broad sectors. So we repeated the same test one level down: 74 GICS industries instead of 11 sectors — every threshold, every cost assumption, every winsorization and every labelling rule carried over unchanged. No parameter sweep, no re-optimization, the same pre-registered decision rule.
One caveat belongs at the front of this chapter, because it colors everything that follows: at the fine level the data base is considerably thinner. Only 12,420 of 22,757 symbols (54.6%) carry an industry label, against 86.4% at the sector level. Above all, coverage splits apart between living and vanished names: 91.4% of the 6,338 active stocks, but only 40.3% of the 16,419 delisted ones — a spread of 51.1 percentage points. The reason is mundane and precisely for that reason dangerous: the fine industry label comes from a master-data set maintained for today. A company still listed almost always has one; a company that disappeared usually does not. At the sector level a fallback source catches those cases; at the fine level there is none. The fine industry index is therefore built mostly from survivors and tends to show a flattering path. This chapter accordingly supports statements about differences between filter variants, but none about the level of returns. On top of that, in any given year only 52 to 59 of the 74 industries have enough members for an index at all, and 12 industries never clear the threshold — "of 74" effectively means "of 62".
The decision figures at both levels
| Crash Reversal, vs. S&P winsorized | F0 | FA (Stage 2) | FB (upper half) | GA (Stage 4) | GB (lower half) |
|---|---|---|---|---|---|
| Sector level (11 sectors) | +1.87 pp | +1.93 pp | +2.24 pp | +2.55 pp | +1.51 pp |
| Fine level (74 industries) | +1.87 pp | +2.08 pp | +2.25 pp | +2.20 pp | +1.63 pp |
| N at the fine level | 9,908 | 3,030 | 4,069 | 2,767 | 5,006 |
Edge over the S&P 500, winsorized mean, net blended costs. Both levels across the same 9,908 trades.
| Revenue Inflection K·org, portfolio return p.a. conservative | F0 | FA (Stage 2) | FB (upper half) | GA (Stage 4) | GB (lower half) |
|---|---|---|---|---|---|
| Sector level (11 sectors) | 16.56% | 15.53% | 15.71% | 17.22% | 16.34% |
| Fine level (74 industries) | 16.56% | 16.66% | 23.06% | 5.96% | 14.79% |
| N at the fine level | 277 | 153 | 132 | 40 | 127 |
Conservative calculation excluding suspected price-jump cases. The fine-level GA column rests on just 40 of the 277 positions (14.4%) and is invested in only 106 of the 163 months — it is not comparable to the almost continuously invested columns (159 to 162 months).
What the follow-up test changes — and what it does not
The decision stands unchanged. The pre-registered condition was: stages only count as measurably better if the Stage-2 filter FA beats the ranking variant FB on the headline metric of both backtests AND the control groups GA and GB come out correspondingly worse. At the fine level FA again sits behind FB — in the reversal recipe at +2.08 against +2.25 percentage points, in the revenue-inflection recipe at 16.66 against 23.06 percent. In both tests, at both levels, the same sign. That FA at the fine level lands narrowly above the unfiltered recipe for the first time, at 16.66 percent — at the sector level it sat below it, at 15.53 percent — changes nothing: the decision turns on the comparison with FB, and that again goes against the stage filter. The control groups do stand cleaner than at the sector level: for revenue inflection, GA at 5.96 and GB at 14.79 percent now sit below FA and FB as expected. For the reversal recipe the control stays inverted, however — GA beats FA at +2.20 against +2.08 percentage points — and that very inversion has been the core of the finding since the sector level. The follow-up test confirms the decision rather than overturning it: no filter on sector or industry is introduced, and the group rotation stays untriggered.
One figure in the second table needs an explanation of its own, because at first glance it seems to argue for the filter: at the fine level the ranking variant FB reaches 23.06 percent on the conservative calculation, 6.50 percentage points above the unfiltered recipe — while at the sector level the same variant, at 15.71 percent, sat below it. That jump is the strongest argument AGAINST the filter: an edge that flips sign with the fineness of the grouping is not a rule, it is dispersion. On top of that, the figure rests on 132 of the 277 positions, and the largest drawdown grows from 24.4 to 38.5 percent along the way. And it is a level statement — precisely the kind this level's coverage gap cannot support.
Three findings from the sector level also survive the finer grouping. First, the stock-specific rest still dominates: among the 6,130 winning trades of the reversal recipe, on average 9.17 of 11.01 percentage points come from the rest and only 1.84 from the sector tailwind; for the revenue-inflection recipe it is on average 32.84 of 49.70 points of rest against 16.86 points of tailwind. Against the sector level, the finer grouping therefore lifts the measured tailwind only modestly — from 1.59 to 1.84 percentage points in the reversal recipe, from 13.27 to 16.86 in the revenue-inflection recipe — and it overturns the magnitude nowhere. Second, Stage 4, the weak industry, remains the better pond for the reversal recipe: a median of +8.96 percent against +6.39 percent across all trades, a hit rate of 69.8 against 66.6 percent. The effect is smaller than at the sector level (+10.43 percent median there), but it does not flip. Third, the ranking direction still runs opposite between the arms: in the main arm K·org the upper half leads (23.06 against 14.79 percent on the conservative calculation), while in the L-alt·org arm the lower half does (10.61 against 9.81 percent). A filter whose sign depends on the segment is measuring dispersion, not a rule.
The fine level does deliver one genuine gain: the weak ranking advantage in the reversal recipe no longer hangs on two exceptional years. On the vs.-S&P median, the FB edge shrinks only from +0.62 to +0.41 percentage points once the 2020/21 cohorts are excluded, whereas at the sector level it collapsed from +0.59 to +0.19 percentage points; on the winsorized headline metric it stays essentially untouched at +0.38 against +0.39 percentage points. The advantage is therefore more stable — but it stays small, and it stands alone.
What the follow-up test explicitly does not deliver is less risk. The largest drawdown of the main arm deepens from 24.4 percent for the unfiltered portfolio to 32.0 percent under FA and 38.5 percent under FB. Both filters cut the portfolio to roughly half its positions (55 and 48 percent respectively), and a smaller portfolio swings harder. The whole follow-up test is moreover paid for with the coverage gap named above — 54.6 against 86.4 percent — and a survivorship tilt of 51 percentage points that makes every level statement at the fine level less reliable than at the coarse one. Bottom line: a finer industry breakdown is not the missing ingredient. It does shift individual figures considerably — but it does not shift the answer to the original question.
Limitations of this study
- The sector assignment is static and current-day. Every company gets exactly one sector from today's GICS/sector/SIC cascade, applied across the entire history since 2010 — this study does not capture regrouping over time (through mergers or portfolio changes, for example).
- The sector indices are equal-weighted, not cap-weighted. A small-cap name counts exactly as much as a sector heavyweight — Weinstein's own group indices in his era were closer to a capitalization- or price-based weighting.
- The stage engine knows neither Mansfield relative strength nor trading volume. It measures only the slope of the 30-week average and whether the index sits above or below it. Weinstein's own methodology also draws on relative strength against the broad market and volume patterns — both were deliberately left out here to keep the engine simple and fully specifiable in advance.
- 3,103 of 22,757 symbols (13.6%) have no sector — 2,830 of 16,419 delisted stocks (17.2%) — because neither GICS, sector, nor SIC data is available. The effect on the trades actually tested is much smaller: in the crash-reversal recipe the sector is missing for 138 of 9,908 trades (1.4%), in the revenue-inflection recipe for 9 of 277 positions (3.2%). These trades flow unfiltered into F0 only and drop out of every filter variant.
- The secondary-source gap in Weinstein himself. For the chapters from 4 onward, where the group analysis is deepened with further case studies, only secondary literature was available within the scope of this study — not the full original text.
- The follow-up test at the fine industry level rests on a narrower data base. The 74-industry calculation in the chapter above covers only 54.6 percent of symbols and just 40.3 percent of delisted names. Its statements about differences between filter variants hold; its statements about the level of returns do not. At trade level this enlarges the unlabelled remainder: 534 instead of 138 of the 9,908 reversal trades (5.4 percent) carry no industry, 799 carry no stage before entry, and in the revenue-inflection main arm it is 15 instead of 9 positions. All of them stay in F0 and drop out of every filter variant — the comparison at the fine level is therefore more unevenly staffed, systematically at the expense of names with thin master data.
Readers who want to see where the 9,908 decomposed reversal trades come from can find the source study in our Crash Reversal Backtest; the 277 positions of the main K·org arm come from our Revenue Inflection Backtest. More backtest studies in this series live together under Studies.
Figures as of August 9, 2026; follow-up test at the fine industry level August 10, 2026.
This article is a historical analysis of publicly available price and fundamental data and not investment advice. It contains no buy or sell recommendation and no forecast; individual companies named in it serve solely to illustrate historical price patterns. Past results — whether simulated or real — are not a reliable indicator of future returns. Anyone making investment decisions should assess their own situation and risks, if in doubt with professional advice.
Frequently Asked Questions
In his 1988 book, Stan Weinstein argues that the industry group matters more than the individual stock: a strong stock in a weak group rarely stays strong for long, while a weak stock in a strong group often gets pulled along. His central tool is the 30-week moving average, which he describes as a minimum requirement for a purchase. This study mechanizes that idea and tests it against two backtests already published in this series.
The engine compares a sector index's 30-week moving average to its level four weeks earlier and checks whether the index sits above or below that line. Stage 2 applies when the index is above it and the line has risen by more than 0.5%; Stage 4 when the index is below it and the line has fallen by more than 0.5%; everything in between is a transitional stage. A change is only confirmed after two weeks carrying the same signal. The rule was fixed before the calculation ran, and a 40-week-average variant ran alongside as a check.
No. In the crash-reversal backtest, the Stage-2 filter's 1.93-percentage-point edge over the S&P 500 sits below the upper ranking half's 2.24 points. In the revenue-inflection backtest, the Stage-2 filter's conservative figure in the main arm is 15.53%, the ranking variant 15.71%, both below the unfiltered recipe's 16.56%. The pre-registered success condition was met in neither test.
The crash-reversal recipe specifically buys stocks after a crash. In a weak sector, those crashes tend to run deeper on average, and a bounce from further down covers proportionally more ground. That is why Stage 4, with a median of 10.43% and a 52.2% target-hit rate, is the best subset in the entire table – the tailwind idea holds here, just mirror-reversed.
Yes, clearly. In the broad signal arm of the revenue-inflection backtest, which covers every position carrying a signal rather than just the narrow core, Stage-2 entries return 24.29% a year and Stage-4 entries only 4.27% – a 20-percentage-point gap across 1,349 vs. 546 positions. The tailwind separates most where a recipe does the least selecting, and shrinks to a good third once a recipe already filters sharply.
The sector assignment is static and current-day, so it does not capture regrouping over time. The sector indices are equal-weighted rather than cap-weighted. The stage engine uses neither Weinstein's relative-strength formula nor trading volume. And for the deeper chapters from 4 onward in Weinstein's book, only secondary sources were available within the scope of this study, not the full original text.
No. The follow-up test using 74 GICS industries instead of 11 sectors was run with unchanged rules and reaches the same conclusion: the Stage-2 filter still trails the simple ranking variant in both backtests (+2.08 against +2.25 percentage points for the reversal recipe, 16.66 against 23.06 percent for revenue inflection). That FB lands above the unfiltered recipe at the fine level but below it at the sector level does not argue for the filter: an edge that flips sign with the fineness of the grouping is dispersion. The stock-specific rest still dominates, and Stage 4 remains the group with the highest median (+8.96 against +6.39 percent) and the highest hit rate (69.8 against 66.6 percent) for the reversal recipe. The only new finding is that the weak ranking advantage there no longer hangs on 2020 and 2021. In exchange, the fine level covers only 54.6 percent of symbols instead of 86.4 percent, and just 40.3 percent of delisted names — so it does not support statements about the level of returns.


