R&D Inflection Backtest: A Research Surge Is No Reliable Buy Signal — 10.98% Against 14.82% per Year
A company that has been quiet for years and suddenly ramps up R&D spending by forty percent or more: is that a reliable buy signal? We tested the question across 163 months and 1,830 companies that produced at least one signal — split between companies with a real business behind the number and companies with no meaningful revenue at all, with delisted stocks kept in the portfolio and with the SEC filing date rather than the quarter end as the cut-off. The answer is honestly negative: on twelve and twenty-four months the main segment trails the S&P 500, an apparent edge after three years collapses on closer inspection into three positions, and for companies without revenue an R&D explosion is a losing bet on every single horizon. As an early warning for a coming revenue inflection, the R&D inflection barely works either.
 Thomas Mücke
Founder & Publisher
Thomas Mücke
Founder & Publisher
The question: is a research surge a buy signal?
A company that has been quiet for years and suddenly ramps up R&D spending by forty percent or more: is that a buy signal? We tested the question across 163 months — January 2013 to July 2026 — on US stocks, split between two worlds where an R&D inflection means something entirely different: companies with a real business behind the number (main segment), and companies without meaningful revenue (pre-revenue segment), where an R&D inflection is mostly a cash-raise story.
The result is honestly negative. On the holding periods most investors actually plan for — twelve and twenty-four months — the main segment trails the broad market. An apparent edge after three years falls apart on closer inspection. And for companies without revenue, an R&D surge is a losing bet on every horizon.
The result in four numbers
Is a research surge of at least forty percent after a quiet period a reliable buy signal? We tested the question across 163 months — January 2013 to July 2026 — on US stocks. Four numbers carry the result:
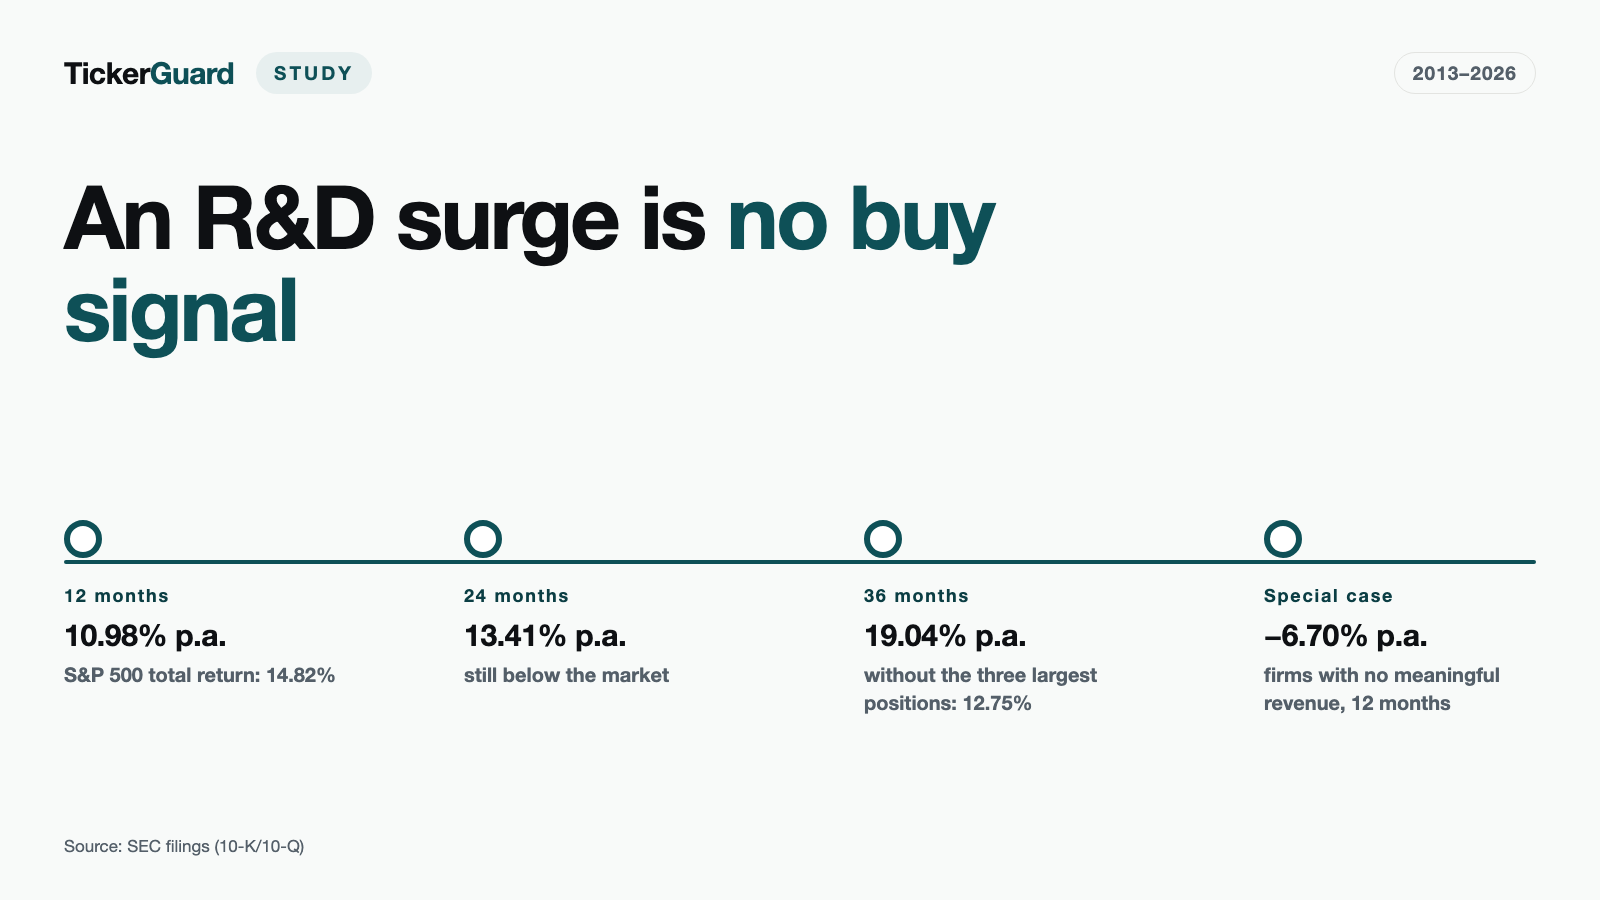
- 10.98% a year is what the main segment returned on a 12-month hold, conservative.
- 14.82% is what the S&P 500 Total Return returned over exactly those same months — the signal trailed it, also on a 24-month hold (13.41% against 14.82%).
- 12.75% is what remained of the apparent 36-month edge (19.04%) once the three biggest winners were stripped out — below the S&P 500's 14.22%.
- 9.88% — only this share of the 951 observable companies saw a revenue inflection follow within 12 months; as an early indicator the research surge barely worked, and for companies without meaningful revenue it cost −6.70% a year.
A sudden research surge was not a signal that beat the broad market in the tested window — for companies without meaningful revenue it was a losing bet across the board.
How is the signal defined?
We looked for companies whose trailing-twelve-month R&D expense rose by at least 40 percent over the same figure a year earlier, in at least two consecutive quarters — open-ended on the upside, since doubling the R&D budget is the strongest expression of the thesis, not a disqualifier. The precondition is quiet beforehand: the four quarters immediately before the first acceleration quarter each had to grow by less than 15 percent. We measure on the trailing-twelve-month sum rather than the single quarter, because the R&D line is the most jagged row on the income statement. Full methodology details are further down.
The headline figure in every table is the conservative one — computed without positions showing a single-month return above 200 percent, which are suspected of being unadjusted price corrections rather than real moves. It is therefore not always the lower number, but the one cleaned of suspect price series; the full run stands next to it in every row.
What does the R&D inflection return over 12, 24 and 36 months?
| Holding period | Positions | p.a. conservative | p.a. full | max drawdown (full run) | S&P 500 TR |
|---|---|---|---|---|---|
| 12 months | 82 | 10.98% | 12.83% | −60.35% | 14.82% |
| 24 months | 70 | 13.41% | 13.32% | −50.89% | 14.82% |
| 36 months | 59 | 19.04% | 18.66% | −42.17% | 14.22% |
On the "Positions" column: it counts every position in the arm and is therefore the basis for the full run and for the drawdown column. The conservative run drops the positions under jump suspicion and therefore rests on 81 (12 months), 69 (24 months) and 58 (36 months) positions — exactly the set the next table uses.
On a 12-month hold, the main segment returns 10.98% a year (conservative, on 81 of 82 positions) against the S&P 500 Total Return's 14.82%. On 24 months it's 13.41% (69 of 70 positions) against the same 14.82% — trailing again. Only at 36 months does the picture flip: 19.04% a year (58 of 59 positions) against 14.22% for the S&P 500. That apparent edge is the most eye-catching figure in the whole study — and, as the next section shows, the least robust.
Why doesn't the 36-month edge survive scrutiny?
The probe below strips out the biggest winners one after another and looks at what is left. It runs on exactly the conservative set that already carries the return column above.
| Holding period | Positions (conservative set) | p.a. conservative | without the top 1 | without the top 3 | without the top 5 | S&P 500 TR |
|---|---|---|---|---|---|---|
| 12 months | 81 | 10.98% | 8.04% | 5.13% | 3.64% | 14.82% |
| 24 months | 69 | 13.41% | 12.25% | 7.93% | 5.20% | 14.82% |
| 36 months | 58 | 19.04% | 17.35% | 12.75% | 10.65% | 14.22% |
The 19.04% at 36 months rests on 58 positions. Remove just the single biggest and the return drops to 17.35% — still above the market. Remove the three biggest and it drops to 12.75%, below the S&P 500. Remove the five biggest and it's down to 10.65%. And the two biggest positions aren't two separate success stories — they're one and the same company, bought twice: Centrus Energy, whose stock rose more than 700 percent over 36 months from its 2019 entry. An edge that hangs on three trades, two of which belong to the same company, isn't a robust rule — it's a single case dressed up as a statistic.
Even excluding the so-called Covid base effect (entries between April 2020 and December 2022 removed, because a trailing-twelve-month comparison is systematically distorted there), the picture stays subdued: the 36-month return then falls to 12.01% (38 positions) — below the S&P 500's 14.22% in the same window. The apparent long-term edge is therefore backed neither by a broad base nor by a period free of the base effect.
Quiet, or a rebound? A side finding on a thin base
The rule's quiet condition only has a ceiling: a company that first slashed its research and then returned to its old level satisfies it just as easily as one that genuinely accelerated from a truly quiet level. We separated the two cases:
| Holding period | Arm | Positions | p.a. conservative | p.a. full | S&P 500 TR |
|---|---|---|---|---|---|
| 12 months | genuinely flat quiet period | 20 | 4.15% | 4.15% | 13.63% |
| 12 months | rebound after a downturn | 62 | 8.33% | 10.46% | 14.82% |
| 24 months | genuinely flat quiet period | 17 | 10.64% | 10.64% | 13.40% |
| 24 months | rebound after a downturn | 53 | 12.80% | 12.66% | 14.82% |
| 36 months | genuinely flat quiet period | 14 | 24.71% | 24.71% | 13.55% |
| 36 months | rebound after a downturn | 45 | 17.52% | 16.94% | 14.22% |
Here too the positions column counts every position in the arm. On the conservative run, "rebound after a downturn" rests on 61 (12 months), 52 (24 months) and 44 (36 months) positions; for the genuinely flat quiet period no position drops out.
At 36 months, the genuinely flat quiet period returns 24.71% a year, clearly ahead of the 17.52% for a rebound after a downturn. That figure, however, rests on just 14 positions — too few to build a rule on. We show it explicitly as a lead for further research, not as a standalone finding of this study. Note also that the two sub-arms run over different calendar windows; the benchmark in the last column therefore covers the same period as the arm beside it, row by row.
What happens when pre-revenue companies ramp up R&D?
For biotechs and other companies without meaningful revenue, an R&D inflection is mostly a cash-raise story: after a fresh capital increase, R&D spending rises almost mechanically, regardless of whether a product is in sight.
| Holding period | Positions | p.a. conservative | p.a. full | total-loss scenario (floor) | max drawdown (full run) | S&P 500 TR |
|---|---|---|---|---|---|---|
| 3 months | 119 | −24.18% | −16.27% | −16.27% | −99.78% | 14.63% |
| 6 months | 114 | −37.24% | −29.40% | −31.02% | −99.90% | 14.82% |
| 12 months | 105 | −6.70% | −3.50% | −5.31% | −94.09% | 14.63% |
| 24 months | 80 | −14.16% | −11.57% | −14.98% | −93.93% | 14.82% |
| 36 months | 66 | −11.19% | −10.50% | −14.77% | −92.31% | 14.82% |
Positions column as above: every position in the arm. The conservative run rests on 118 (3 months), 113 (6 months), 104 (12 months), 77 (24 months) and 62 (36 months) positions.
The result is clearly negative on every single horizon. After twelve months it's minus 6.70% a year (conservative, on 104 of 105 positions), after 24 months minus 14.16% (77 of 80 positions), after 36 months minus 11.19% (62 of 66 positions). Even at three and six months this segment loses 24.18% and 37.24% a year respectively. In hindsight, an R&D explosion with no revenue behind it isn't a buy signal — it's a warning sign.
Does an R&D inflection foreshadow a revenue inflection?
The more interesting follow-up question isn't whether the R&D surge itself is a buy signal, but whether it foreshadows something: does an R&D inflection regularly precede a revenue inflection — which we examined separately in our Revenue Inflection Backtest Study?
| Horizon | observable companies | with a later revenue inflection | share |
|---|---|---|---|
| 12 months | 951 | 94 | 9.88% |
| 24 months | 929 | 141 | 15.18% |
| 36 months | 888 | 165 | 18.58% |
The answer is mostly no. Of 982 companies with an R&D inflection of the main variant in the main segment and 2,157 with a revenue inflection, 588 overlap. Among those shared cases, the revenue inflection came first 296 times, the R&D inflection only 249 times, and both fell in the same month 43 times. When the revenue inflection does follow, the median gap between the two signals is 20 months; in the other direction, when the revenue inflection comes first, it's a median of 12 months. The R&D inflection is therefore not a reliable early warning for a coming revenue inflection — it tends to occur at the same companies without reliably predicting it.
How does the R&D inflection compare to the revenue inflection?
We already tested a related rule: the revenue inflection, where it's not R&D but revenue itself that jumps sharply after a quiet period. There, the organically-grown main arm returned 16.56% a year on a 12-month hold on the conservative run (26.28% on the full run) — against an S&P 500 Total Return of 15.02% over the same period. Conservative against conservative, 16.56% against 10.98%, the gap stays wide. Within the same signal family, the revenue inflection remains the clearly stronger buy signal: a sudden jump in revenue says more about a company's future than a sudden jump in research spending. Readers interested in related growth signals will find further backtests in our studies overview, including the organic hypergrowth backtest on whether growth comes from a company's own strength or from acquisitions.
How we calculated this
The cut-off date is the whole point of every backtest in this series: we calculate exclusively on quarters that had already been filed with the US Securities and Exchange Commission (SEC) as of the relevant month-end — not as of the quarter's calendar end. A backtest that uses a figure from the day its quarter ends buys several weeks too early, and that exact window often contains part of the price jump for a stock that's just taking off.
- Acceleration. The trailing-twelve-month R&D expense is at least 40% above the same figure a year earlier, in at least two consecutive quarters.
- Quiet period. The four quarters immediately before the first acceleration quarter each grew by less than 15%.
- Entry. At month-end of the month in which the second acceleration quarter was filed with the SEC.
- Costs. 0.1% per side (buy and sell).
- Minimum price. $1 on the entry date, measured on the raw (unadjusted) price.
- Delisted stocks are included and stay in the portfolio; if a price series ends mid-period, the position is force-sold at the last available price. That's the reason this backtest can say anything at all.
- Universe and period. US stocks, January 2013 to July 2026 (163 months); quarterly revenue and R&D figures from public quarterly and annual filings with the SEC, prices and the S&P 500 Total Return benchmark from our own price history.
What this study doesn't say
- It only applies to companies that actually do research. Of 7,405 companies in the universe, only 3,292 (44.46%) report any R&D expense at all. Commodity, retail and real-estate companies, for instance, typically report no R&D — that's not a data gap, it's the scope of the study.
- The total-loss scenario is a floor, not a failure rate. It marks every position whose price series ends mid-period in a delisting as minus 100%, even when the company was acquired for cash at a fixed price. Of the 109 forced sales that occurred on a 36-month hold across all 859 buys of the main segment — the tables above show the 59 first signals per company out of those —, 68 (62.39%) actually ended in a profit.
- The conservative figure is not automatically the more cautious one. The filter removes positions with a single-month return above 200%, because such jumps frequently stem from unadjusted price corrections. But it sees only the jump, not its cause: when it catches a real price move that later gave the gain back, it RAISES the conservative figure. Wherever the conservative number exceeds the full one, that is exactly what happened — which is why both stand side by side in every row.
- A 36-month hold can only buy through July 2023. 335 signals across the whole run were therefore never entered at all, because their holding period would have run past the end of the study — the 36-month reading rests on a shorter entry window than the shorter horizons.
- Taxes and spreads are missing. We model 0.1% costs per side, nothing else.
- A backtest is not a forecast. This study is market research, not investment advice and not a buy recommendation.
Bottom line: what does this mean for investors?
In hindsight, a sudden R&D surge alone is not a signal to trust. On the horizons that matter for most investment decisions — twelve and twenty-four months — it trails the broad market. The eye-catching 36-month figure hinges on three positions, two of which belong to the same company, and falls below the market average without them. For companies without meaningful revenue, an R&D explosion is a losing bet across the board. And as an early-warning system for a coming revenue inflection, the R&D inflection barely works either — the revenue inflection tends to come first.
No live scanner comes out of this backtest, and that is deliberate. Readers looking for a growth signal that did beat the market in hindsight will find it in the Revenue Inflection Study and in the scanner of the same name.
Frequently Asked Questions
Not on the horizons that matter for most investors. On a 12-month hold, the main segment returns 10.98% a year (conservative, on 81 of 82 positions) against 14.82% for the S&P 500 Total Return; on 24 months it's 13.41% (69 of 70 positions) against the same 14.82%. Only at 36 months does the rule pull ahead at 19.04% — but as the next question shows, that figure isn't robust.
Because it rests on just 58 positions and hinges on three of them. Remove the single biggest and the return drops to 17.35%; remove the three biggest and it drops to 12.75% — below the S&P 500's 14.22% in the same window. Two of those three biggest positions are also one and the same company (Centrus Energy), bought twice. Even excluding the Covid base effect (entries between April 2020 and December 2022 removed), the 36-month return falls to 12.01% (38 positions) — below the index's 14.22% in the same window.
Because the two tables count different sets. The first shows every position in the arm; it carries the full run and the drawdown column. The second rests on the conservative set, from which positions with a single-month return above 200 percent have already been removed — at 36 months that is exactly one. The same difference appears at 12 months (82 against 81) and at 24 months (70 against 69). The conservative returns are identical in both tables, because both are computed on the narrower set.
There, an R&D inflection is mostly a cash-raise story — after a capital increase, R&D spending rises almost mechanically, whether or not a product is in sight. The return is negative on every horizon: −24.18% p.a. after 3 months, −37.24% after 6 months, −6.70% after 12 months (104 of 105 positions), −14.16% after 24 months (77 of 80 positions) and −11.19% after 36 months (62 of 66 positions), all conservative.
Barely. Of 982 companies with an R&D inflection and 2,157 with a revenue inflection, 588 overlap. Among those shared cases, the revenue inflection came first 296 times, the R&D inflection only 249 times. Within 12 months of an R&D inflection, only 9.88% of 951 observable companies actually saw a revenue inflection follow (24 months: 15.18% of 929, 36 months: 18.58% of 888) — and when it does follow, the median gap is 20 months.
Only to companies that actually do research. Of 7,405 companies in the universe, 3,292 (44.46%) report any R&D expense at all; the rest — commodity, retail and real-estate companies, for instance — simply have none. That is not a data gap, it is the scope of the study. Of the research-reporting companies, 1,830 produced at least one signal in the period; 982 of them carried an R&D inflection of the main variant in the main segment.
Notably weaker. In our Revenue Inflection Backtest Study, the organically-grown main arm returned 16.56% a year on a 12-month hold on the conservative run (26.28% on the full run) against 15.02% for the S&P 500 Total Return over the same period — a wide gap against this study's 10.98%, even measured the same way. Within the same signal family, the revenue inflection remains the clearly stronger buy signal.


