On Average a Profit, in the Typical Case a Loss: 438 Buys After Phase 3 Success Reports
A biotech stock reports that its pivotal trial succeeded — and the shares jump. Buying on that news is a bet on what comes next: FDA approval. We ran that bet through sixteen years of data. We harvested 8,402 regulatory filings, reviewed 5,632 of them individually, confirmed 486 as genuine positive Phase 3 reports, and turned 438 into trades. Along the way we also documented 560 drug pathways to the FDA. The result is uncomfortable: on average, the trade looks good; in the middle, it loses money. And even where approval actually arrived, the good news was usually already priced in by the time it landed. At the end comes the counter-check — 92 programmes judged blind, without knowledge of the outcome.
 Thomas Mücke
Founder & Publisher
Thomas Mücke
Founder & Publisher
It is one of the more reliable price moves on the market: a biotech company reports before the opening bell that its pivotal trial hit its primary endpoint — and the stock jumps. The logic is straightforward. The last big scientific hurdle is cleared; all that is left is the agency's signature. Buying after the report is no longer a bet on the science. It is a bet on the paperwork.
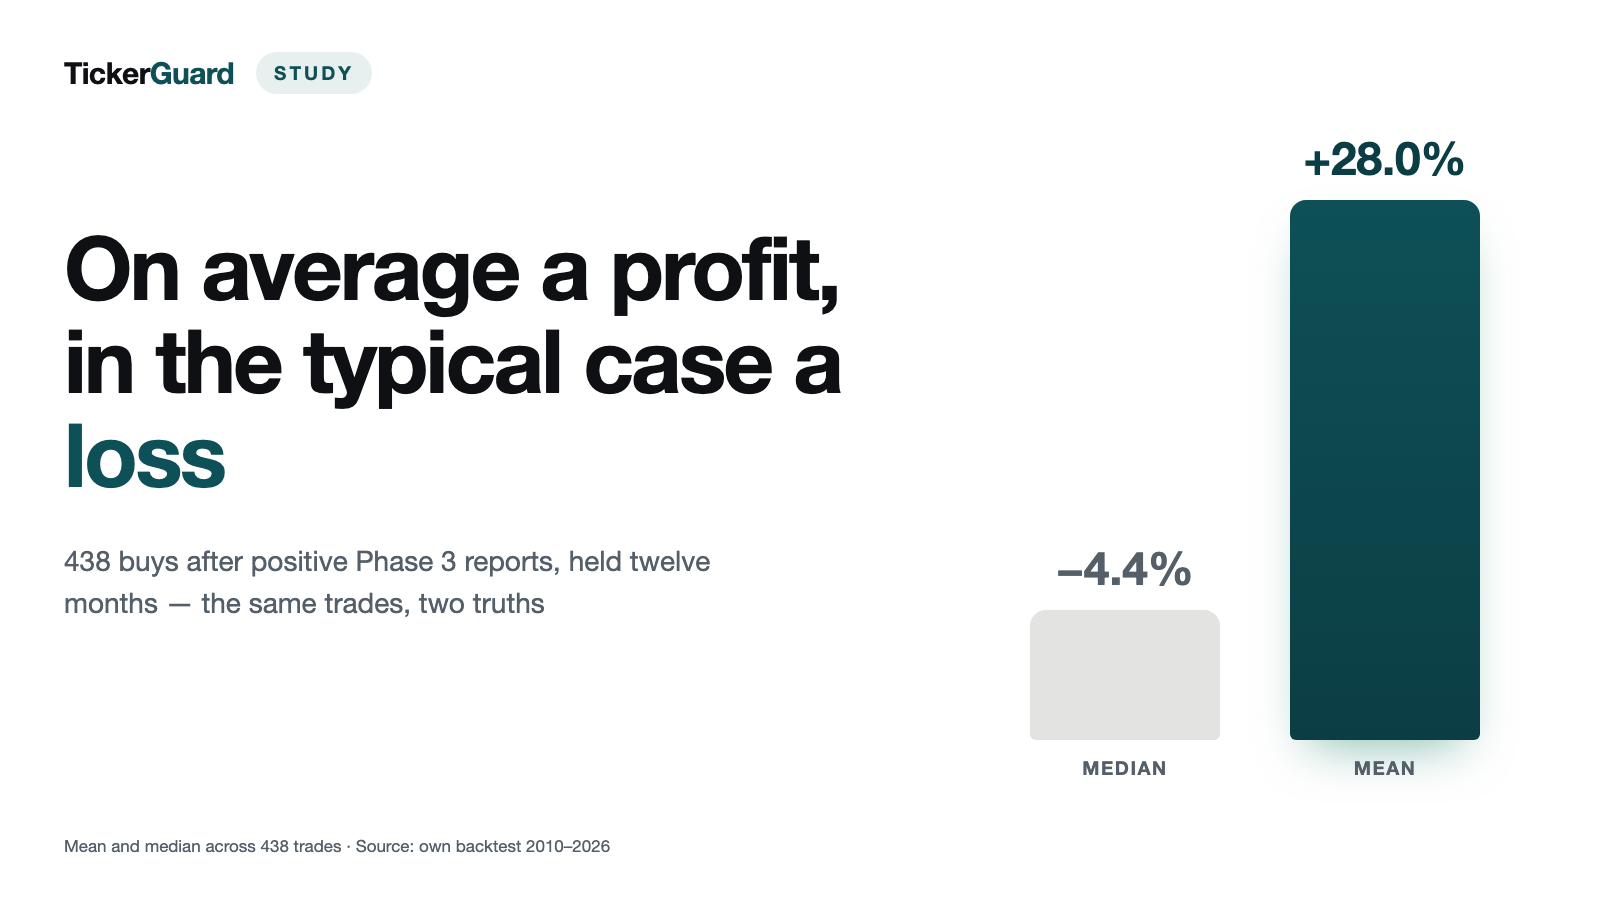
That bet does not pay off in the middle. We ran it through sixteen years of data: 8,402 regulatory filings harvested from the SEC's full-text index, 5,632 of them individually reviewed, 486 confirmed as genuine positive Phase 3 reports, 438 turned into trades. The 12-month mean return is +28.0% — the median is −4.4%. Both numbers are correct, and the gap between them is the real story: a handful of very large winners carry the entire result, while the typical trade loses. Measured against the broad market, that same typical trade trails by 19.1 pp.
A note on mean and median. The mean throws the results of all 438 buys into one pot and spreads them evenly — it answers the question: what does the rule return if you buy every single signal, rare monster winners included? The median is the buy that sits exactly in the middle of the ranking — half did better, half did worse. It answers a different question: what is most likely to happen to me if I buy one of these stocks? When the two sit as far apart as they do here, that gap is itself the finding: a few outliers to the upside carry the average, and the typical case loses.
This study has three parts that build on each other: the path from the success report to the decision and how long each leg takes, what buying actually returned, and finally the counter-check — 92 programmes judged without knowledge of the outcome, compared against the agency's actual decision only afterward.
The result in four numbers
What does buying a stock return after it reports positive Phase 3 results? We tested that across 438 buys in a backtest running from 2010 to 2026. Four numbers carry the result:
- +28.0% mean return after twelve months across all 438 buys — the median, by contrast, −4.4%: a handful of large winners carry the result, the typical trade loses.
- 19.1 pp is how far the median trailed the S&P 500 index fund after twelve months; after eighteen months the gap was 27.4 pp.
- +5.7% median for the 185 trades that were measurable through the approval date — yet still 10.8 pp behind the index; the path from the report to approval took a median of 477 days.
- 54 of 54 programmes judged blind as "approve" were in fact approved (out of 92 reviewed), zero false clearances — but for 87 of the 92 cases, prior knowledge from model training could not be ruled out.
In the tested window from 2010 to 2026, the typical buy after the success report trailed the market — even where approval eventually came, the median trade still lagged the index.
How the data set was built
The raw material is regulatory filings from publicly traded US companies. Using the SEC's full-text search index, we searched for 18 phrases companies typically use to report a trial success — "met the primary endpoint," "positive topline results," "demonstrated a statistically significant" and others. That returned 8,402 filings. A rule-based first pass did a rough sort; everything it flagged as positive or unclear went to individual review: 5,632 reports were read individually and answered a set of questions — is this really a positive Phase 3 report, which drug, which indication, which trial? 486 survived that review.
Of those 486 confirmed reports, 477 remained once repeat coverage of the same news was collapsed — only the first report in each group counts. Another 39 fell out because no ticker could be assigned, the ticker was missing from the price source, the raw price was below one dollar, or there was no price series at all on the report date: 22 times the ticker was missing from the price source, 9 times the raw price was below one dollar, 5 times no ticker could be assigned, 3 times the price series was missing on the report date. That leaves the 438 trades in this study. Entry is the closing price of the first trading day AFTER the report — never the report day itself, because anyone reading the report can no longer buy at that day's close. Returns are measured against an S&P 500 index fund and a biotech index over the same period. Trading costs of 0.4% per round trip are shown as a separate deduction, not buried in the headline numbers.
One rule was added in the course of a spot check, and it moved numbers. Ticker symbols are reassigned after a company leaves the exchange — under the same symbol, the price source then carries the price series of an entirely different company. Where that happened, the measured entry sat up to seven years after the report date, and the measured return no longer belonged to the company that had reported. A buy therefore only counts if the reporting company's price series was running on the report date and the entry falls no more than five trading days after the report. 17 buys consequently run on the historical price series of the symbol; three reports dropped out entirely because no price series existed on their report date.
For the regulatory side we used two independent sources. The first is the approval letter itself: it states the application's filing date in writing.
"Please refer to your New Drug Application (NDA) dated June 26, 2015, received June 26, 2015, and your amendments, submitted under section 505(b) of the Federal Food, Drug, and Cosmetic Act (FDCA) for Exondys 51 (eteplirsen) Injection, 50 mg per mL." — FDA approval letter for application 206488, September 19, 2016
A letter like this is an event record: the date it names is the date something happened. The second source is the companies' own filings — they report on submissions, acceptances, decision dates and Complete Response Letters. This data consists of report dates, not event dates: it only tells us when a company disclosed something, not when it occurred. Every span built from it is therefore an upper bound — the actual event happened no later, possibly earlier. This distinction runs through the entire study, and we flag it in every table.
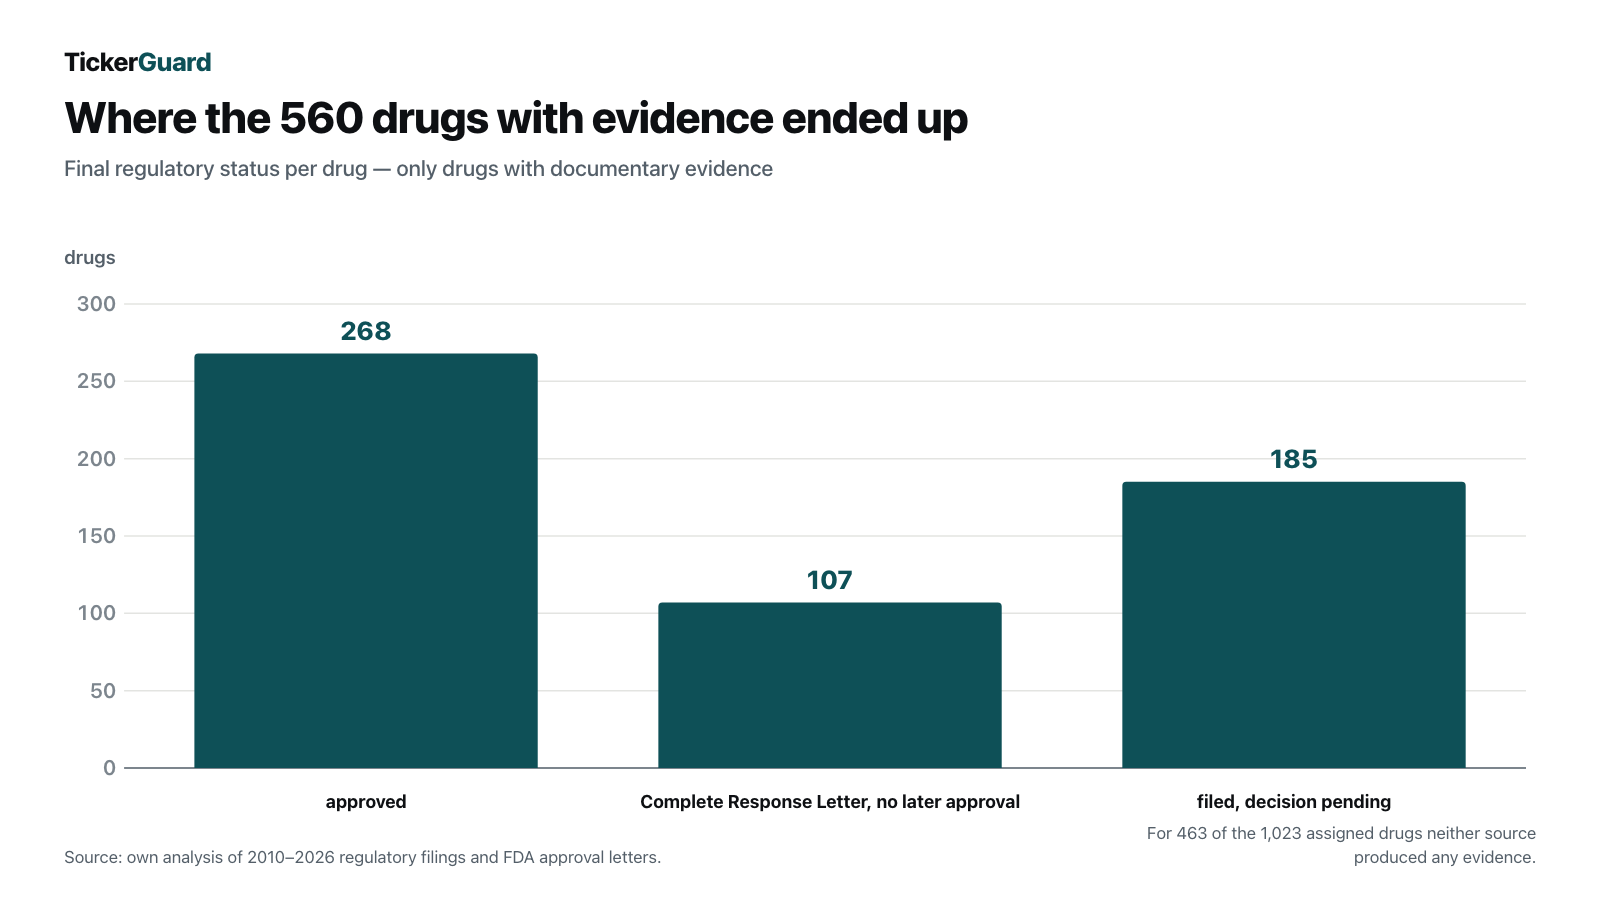
The path to the agency: 268 approvals, 107 rejections
Counting runs per drug, not per line of evidence. A drug that first received a Complete Response Letter and was later approved anyway counts as approved; the letter remains on record as an intermediate step.
| End of the road | Drugs |
|---|---|
| approved | 268 |
| Complete Response Letter, no later approval | 107 |
| filed, decision pending | 185 |
| total (drugs with evidence only) | 560 |
This table is not a success rate — and it is not meant to be one. 1,023 drugs are assigned in total, and for 463 of them neither source found anything. They are missing entirely. Anyone computing a rejection rate from the 560 drugs with evidence is computing it on a subset in which well-documented cases are overrepresented — the rate would come out too high. Two further caveats belong here: for 106 of the approved drugs there is also a Complete Response Letter on record, but report dates alone cannot say whether it came before or after the approval. And for 52 of the filed drugs, the filing itself is not directly evidenced, only a decision date the agency set — which cannot exist without an accepted application. That is an inference, not a source citation, which is why it is stated here.
How long the path takes
The time spans are the reason this bet is more expensive than it looks — they tie up capital for years.
| Stage | Basis | Cases | Median | Middle half |
|---|---|---|---|---|
| Success report to filing | event date | 100 | 245 days | 156 to 477 days |
| Success report to filing | report date (upper bound) | 107 | 203 days | 91 to 372 days |
| Filing to approval | event date | 305 | 360 days | 273 to 691 days |
| Success report to approval | mixed | 126 | 477 days | 332 to 677 days |
From the success report to approval, the median is 477 days, or about sixteen months. The middle half of programmes falls between 332 and 677 days. The leg from filing to decision, with a median of 360 days, is the longer one — and it is the most solid number in this table, because both dates come from approval letters and are therefore genuine event dates. The leg before it rests partly on report dates and should be read as an upper bound accordingly.
What buying returned
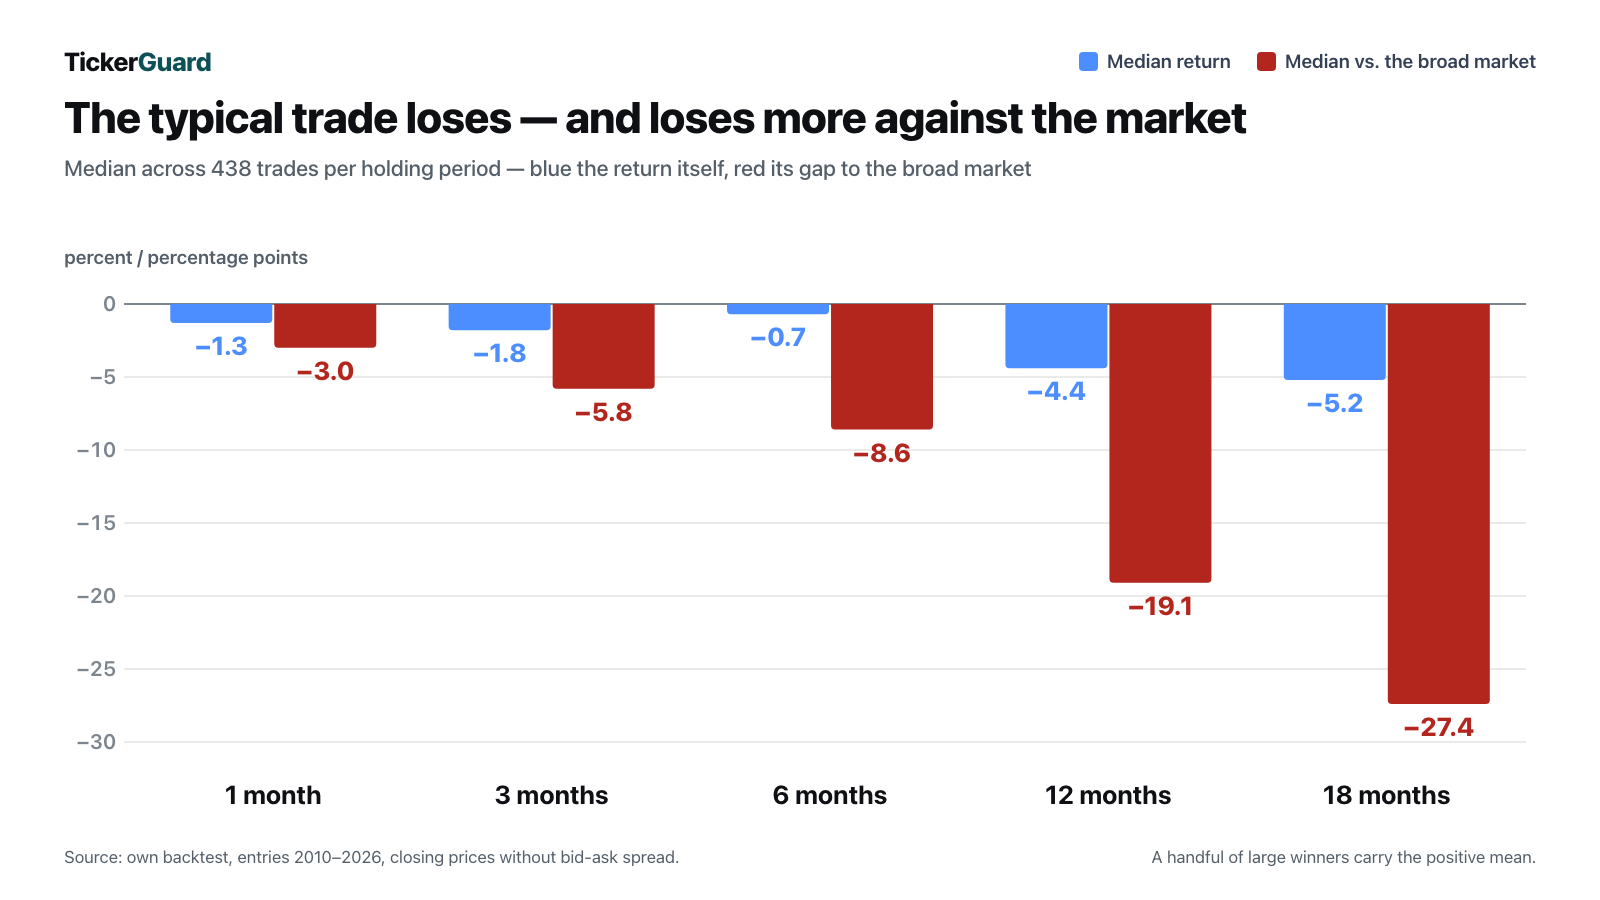
Now the money question. Shares are bought at the closing price of the first trading day after the report — after the jump, not before it. The jump itself belongs to whoever had the news first; for anyone reading the report, it is no longer tradable.
| Holding period | Trades | Mean | Median | Hit rate | Median vs. S&P 500 | Median vs. biotech index |
|---|---|---|---|---|---|---|
| one month (21 trading days) | 438 | +4.9% | −1.3% | 47.5% | −3.0 pp | −3.1 pp |
| three months (63 trading days) | 438 | +9.8% | −1.8% | 47.7% | −5.8 pp | −6.3 pp |
| six months (126 trading days) | 438 | +15.1% | −0.7% | 48.9% | −8.6 pp | −8.8 pp |
| twelve months (252 trading days) | 438 | +28.0% | −4.4% | 45.9% | −19.1 pp | −13.6 pp |
| eighteen months (378 trading days) | 438 | +34.8% | −5.2% | 46.3% | −27.4 pp | −20.1 pp |
The finding is the same across all five holding periods, and it gets starker over time: the mean climbs step by step, the median stays negative throughout. After eighteen months the average sits at +34.8% and the median at −5.2%. The hit rate stays below half across all five holding periods — it runs between 45.9% and 48.9%, so fewer than one in two trades ends up in the black at all. And measured against the broad market, the typical trade's shortfall widens from 3.0 pp to 27.4 pp. The biotech index is a gentler yardstick, because it runs through the same cycles, but the median still trails it throughout.
This is the classic distribution of a lottery ticket: many small to moderate losses, a few very large winners. Whoever plays the rule with a single trade is more likely than not to hit one of the losers. Whoever spreads it across many trades captures the positive mean — but has to buy every dud along the way and hold for a long time. We measured the same effect elsewhere: in our backtest of buying after large price jumps, the mean also carried the result while the middle lost money.
What the mean is worth: an investor who does not cherry-pick individual names but puts all 438 buys into the portfolio at equal size gets the average — and the average beats the market: +28.0% after twelve months, 13.6 pp ahead of the S&P 500 index fund, and still +27.6% after trading costs. That route demands exactly what cherry-picking gives up: buying every dud, living with a hit rate below fifty percent, and holding on until one of the rare large winners turns the arithmetic around — and which one that will be, nobody knows in advance.
After costs
We assume 0.4% per round trip — buying and selling combined. At a one-year holding period that barely registers; at short holding periods it does.
| Holding period | Mean after costs | Median after costs |
|---|---|---|
| one month (21 trading days) | +4.5% | −1.7% |
| three months (63 trading days) | +9.4% | −2.2% |
| six months (126 trading days) | +14.7% | −1.1% |
| twelve months (252 trading days) | +27.6% | −4.8% |
| eighteen months (378 trading days) | +34.4% | −5.6% |
How much rides on the trades that ended early
A trade ends early when the stock is delisted or its price series simply stops. The first case is a real outcome that, if anything, is measured too favorably: the last quoted price is rarely one anyone could still buy at. The right-hand column therefore treats every such trade as a total loss. The truth sits between the two columns.
| Holding period | held to term | delisted | price series ends | Median as measured | Median with total loss |
|---|---|---|---|---|---|
| one month (21 trading days) | 437 | 1 | 0 | −1.3% | −1.5% |
| three months (63 trading days) | 425 | 5 | 8 | −1.8% | −2.2% |
| six months (126 trading days) | 401 | 15 | 22 | −0.7% | −3.4% |
| twelve months (252 trading days) | 369 | 26 | 43 | −4.4% | −11.3% |
| eighteen months (378 trading days) | 340 | 39 | 59 | −5.2% | −16.7% |
The difference is substantial: over eighteen months the median drops from −5.2% to −16.7% once every early exit is counted as a total loss. A meaningful part of the measured result therefore hinges on how one treats stocks that no longer exist by the end — and in this corner of the market, there are not a few of those.
Anchored to approval: the good news was already paid for
The holding periods used so far are arbitrary. The rule really means something else: hold until approval. 185 of the 438 trades, or 42.2%, carry a confirmed approval date after the report date, and for all 185 the span to that date was measurable as well — those are the ones we calculated. Alongside that, the reverse question: what happens in the three weeks after the approval date?
| Measurement | Cases | Mean | Median | Hit rate | Median vs. S&P 500 | Median vs. biotech index |
|---|---|---|---|---|---|---|
| Buy after the report, sell on the approval date | 185 | +35.8% | +5.7% | 53.5% | −10.8 pp | −6.1 pp |
| The 21 trading days after the approval date | 170 | −2.3% | −4.0% | 40.6% | −3.5 pp | −2.3 pp |
The first row is the only measurement in the headline reading where the typical trade wins: +5.7% at the median, +35.8% at the mean, and with a 53.5% hit rate, just over one in two of these trades ends in the black. Holding to approval did earn something — just less than the market did: that same median trails 10.8 pp behind the S&P 500 index fund. Over a roughly sixteen-month holding period, that comparison is the one that matters, and it comes out against the rule.
Whoever instead bets on the approval date itself arrives too late: in the 21 trading days that follow, the median loses 4.0%, the mean 2.3%, and both trail both benchmarks. By the day it landed, the good news was already in the price.
We went on to test that question on its own terms, at the last and supposedly safest moment: what buying two trading days before the decision would have returned, across 92 blindly judged programmes. There, too, the typical trade loses — even where the agency said yes in the end.
Which approval actually counts
Behind this table sits a decision that moves the result more than any calculation assumption does — and we got it wrong on the first pass. A drug application can take two forms: an original approval for a new drug, or an efficacy supplement filed against an existing application number when an already-approved drug gains a further indication. Our first match only recognized original approvals.
That is not a nuance, it is a systematic blind spot: a Phase 3 trial for a new indication of an already-approved drug almost never ends in an original approval — it ends in a supplement on the existing application number. Exceptions exist — a manufacturer can file a separate product with its own application number for the second indication — but the match already caught those, because they are original approvals. Cases exactly like this are part of the underlying 438 trades — at the approval anchor, they fell out of the count structurally. It surfaced with setmelanotide: the approval for the indication under study had been sitting in the register the whole time, just filed as a supplement.
Supplements now count — but none of them unchecked. For all 38 candidate cases, we read the agency's approval letter individually and checked it against the report: 24 fit, 14 do not. Those 14 rejections are the real value of this check, because without them the trade would be anchored to the wrong news. Four patterns recurred: the same drug but the wrong indication (for one lymphoma programme, the supplement pointed to a different approval four months too early); an application number belonging to a different manufacturer entirely; a plain label change with no new indication; and, in one case, a withdrawal rather than an approval. Which supplement is cleared for which report is recorded as a file with source URLs in the project, not as a rule buried in code.
For comparison, the stricter reading that only counts original approvals — our first, incomplete pass — sits alongside it:
| Measurement | Cases | Mean | Median | Hit rate | Median vs. S&P 500 | Median vs. biotech index |
|---|---|---|---|---|---|---|
| Buy after the report, sell on the approval date | 161 | +37.6% | +2.2% | 50.9% | −12.3 pp | −5.7 pp |
| The 21 trading days after the approval date | 151 | −2.6% | −5.0% | 40.4% | −5.1 pp | −2.5 pp |
The difference is not a rounding effect: the median rises from +2.2% to +5.7% because 24 additional trades are added whose approval actually happened. The finding itself does not change. Against the broad market the rule trails clearly under both readings — 10.8 pp versus 12.3 pp — and the 21 days that follow are negative under both. What changes is the answer to how much an investor earned; what stays the same is the answer to whether the index would have been the better place for the money.
One caveat holds under both readings: the approval date belongs to the drug named in the report, not to the company, and it must fall after the report date. No anchor nowhere means not approved — it can equally mean that the report never named a drug, that no source found an approval for that drug, or that the only known approval predates this report and therefore belongs to a different programme.
The counter-check: would we have decided the same?
The third question is the most interesting one, and it has nothing to do with prices anymore: can the published trial data alone predict how the agency will decide?
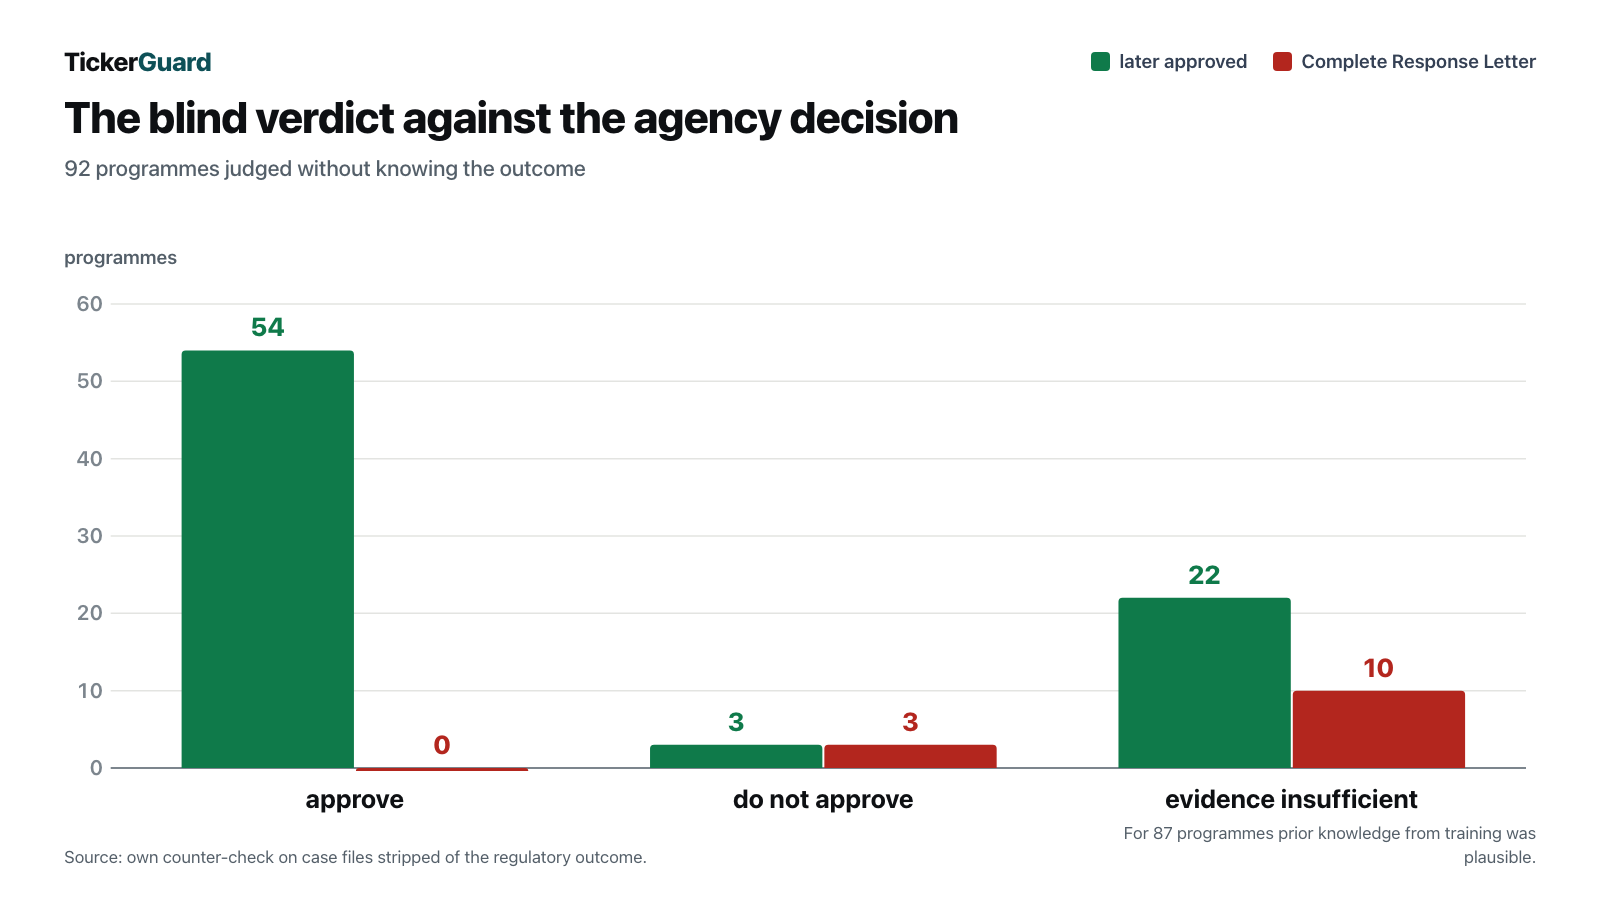
For the answer to mean anything, it had to be reached blind. So the process ran in two separate stages. In the first, the published trial data for 92 programmes with a known decision were assembled: design, sample size, control arm, primary endpoint, effect size, p-value, safety signals. The brief explicitly excluded the regulatory outcome. In the second stage, a separate step ruled on each of those files — approve, do not approve, or evidence insufficient — each with supporting reasons and a counterargument. Only then was it compared against the actual decision.
| Blind verdict | later approved | Complete Response Letter | total |
|---|---|---|---|
| approve | 54 | 0 | 54 |
| do not approve | 3 | 3 | 6 |
| evidence insufficient | 22 | 10 | 32 |
| total | 79 | 13 | 92 |
The decisive row is the first one. The verdict to approve was reached 54 times — and all 54 programmes were approved. Zero false clearances. The reverse holds too: none of the 13 programmes later rejected received that verdict. Read strictly, that is a very clean separation, and precisely at the point where a mistake would be costly.
The cost of that shows up in the third row: in 32 of 92 cases — one in three — the verdict was that the evidence was insufficient. Of those, 22 were later approved. The process is not clever, it is cautious: it rarely says something wrong, but it often says nothing. An investor who only bought on a clear approval verdict would never have been wrong in this sample — and would have missed 25 of the 79 later approvals, nearly a third.
Where the cases mentioned in the text appear
| Drug | Company | Indication in the file | Trial | Blind verdict | Decision | Prior knowledge possible |
|---|---|---|---|---|---|---|
| relacorilant | CORCEPT THERAPEUTICS INC | platinum-resistant ovarian cancer | ROSELLA | approve | approved | no |
| atacicept | Vera Therapeutics, Inc. | IgA nephropathy | ORIGIN | evidence insufficient | approved | no |
| roxadustat | FIBROGEN INC | chemotherapy-induced anemia | ANDES1 | evidence insufficient | Complete Response Letter | no |
| dtx401 | Ultragenyx Pharmaceutical Inc. | glycogen storage disease type Ia (GSDIa) | GlucoGene | evidence insufficient | Complete Response Letter | no |
| alks 5461 | Alkermes plc. | major depressive disorder | FORWARD-5 | do not approve | Complete Response Letter | yes |
| bardoxolone | REATA PHARMACEUTICALS INC | chronic kidney disease in Alport syndrome | CARDINAL | do not approve | Complete Response Letter | yes |
| ridaforolimus | ARIAD PHARMACEUTICALS INC | metastatic soft-tissue or bone sarcoma | SUCCEED | do not approve | Complete Response Letter | yes |
Two cases deserve a closer look because they arose without any detectable prior knowledge. For relacorilant from Corcept Therapeutics, the blind verdict was to approve — the agency approved it on March 25, 2026, in combination with nab-paclitaxel for platinum-resistant ovarian cancer, based on the same ROSELLA trial that was in the file. For atacicept from Vera Therapeutics, the verdict was instead that the evidence was insufficient, and it was approved anyway, on July 7, 2026. The fine print explains the verdict: it was an accelerated approval — the drug, marketed as Trutakna, is explicitly approved to reduce proteinuria, a surrogate endpoint. Whether it slows the long-term decline of kidney function is, according to the label, not established; continued approval may depend on a confirmatory trial demonstrating clinical benefit. That exact caution was already present in the file's reasoning.
The three cases where we disagreed
Three programmes are formally wrong verdicts: the blind verdict was not to approve, yet the drug carries an approval. We looked into each one individually, and all three show the same pattern — the file belonged to a different programme than the one that was approved. The comparison runs at the level of the drug, and the drug does not know the difference between two indications of the same molecule.
Binimetinib — ARRAY BIOPHARMA INC
File: NEMO — monotherapy in NRAS-mutant melanoma. Blind verdict: do not approve.
Array BioPharma withdrew the application for this indication on March 19, 2017, after the agency signaled that the benefit shown in NEMO — progression-free survival of 2.8 versus 1.5 months, no survival benefit — was not enough. The approval of June 27, 2018 belongs to a different programme: Mektovi combined with Braftovi in BRAF V600E/K-mutant melanoma, supported by the COLUMBUS trial.
For the NEMO file, the verdict was correct — that application never went through. (Source 1 · Source 2 · Source 3)
Tivozanib — AVEO PHARMACEUTICALS INC
File: TIVO-1 — first-line therapy in advanced renal cell carcinoma. Blind verdict: do not approve.
The agency advisory committee voted 13 to 1 against a favorable benefit-risk profile on May 2, 2013; AVEO reported the Complete Response Letter on June 10, 2013. Approval of Fotivda did not follow until March 10, 2021 — based on the later TIVO-3 trial and for a different treatment line: after at least two prior therapies.
For the TIVO-1 file, the verdict was correct — that application was rejected. (Source 1 · Source 2 · Source 3)
Zuranolone — Sage Therapeutics, Inc.
File: WATERFALL — major depressive disorder. Blind verdict: do not approve.
On August 4, 2023, the agency decided both applications on the same day: Zurzuvae was approved for postpartum depression — and on that same day, major depressive disorder received a Complete Response Letter on the grounds that the evidence of effectiveness was insufficient and at least one more study would be needed.
For the major depressive disorder file, the verdict was correct — it was the other indication that was approved. (Source 1 · Source 2)
The clearest case is zuranolone, because the agency decided both applications on the same day and the company announced both in a single release:
"Additionally, the FDA issued a Complete Response Letter (CRL) for the New Drug Application (NDA) for zuranolone in the treatment of adults with major depressive disorder (MDD). The CRL stated that the application did not provide substantial evidence of effectiveness to support the approval of zuranolone for the treatment of MDD and that an additional study or studies will be needed." — joint release from Biogen and Sage Therapeutics, August 4, 2023
Counted per indication, not one wrong verdict remains. That is an honest upgrade to the finding — and, at the same time, a weakness of the method worth naming: matching by drug is too coarse exactly at this point. It was still the better choice, because the obvious alternative — matching by company name — is worse still: a large company advances several drugs at once, and the approval of a neighboring drug looks just as correct when searched by name.
The caveat that overrides everything
For 87 of the 92 programmes, we could not rule out that the outcome was already known from model training. Approval proceedings are public, and prominent decisions are documented extensively. This process is therefore a reconstruction, not an advance prediction — it shows that the decision can be justified from the published data, not that it could have been predicted in advance.
What carries the most weight are the five cases with no detectable prior knowledge. Three of them saw approval in 2026 for exactly the programme in the file — relacorilant and setmelanotide in March, atacicept in July — while the other two ended in a Complete Response Letter. The blind verdict came out clearly in favor of approval once (relacorilant) and found the evidence insufficient four times: right for the two rejections, too cautious for the two remaining approvals. Five cases are not a statistic. But they are the only part of this counter-check that survives the prior-knowledge question cleanly, and they point in the same direction as the full 92.
What these numbers do not say
- The population is a search, not a list. It was harvested using search phrases against the SEC's full-text index. A success report that uses none of those phrases is missing — invisibly.
- The first pass decides what even gets read. The individual review is thorough, but it only sees what the rule-based pre-sort hands it. That pre-sort reads a window around the endpoint phrase, not the trial itself — a report it wrongly discards never reaches individual review and is missing invisibly.
- The stages of the regulatory path are partly report dates. A company filing only tells us when a company disclosed something, not when it happened. That is why the funnel makes no claim about sequencing, and every span drawn from this source is an upper bound.
- The approval anchor depended on our own selection process. That 185 trades carry an approval date instead of 161 is not new data — it is because we initially failed to read efficacy supplements at all; see above. Where one such decision created a blind spot once, it can create another elsewhere; the 185 remains more of a lower bound than a final number.
- Mergers and acquisitions cut price series short. They count here as the end of a trade, even though they were regularly a gain for the shareholder. That distortion works against the rule, not for it.
- These are not prices anyone actually traded at. Calculations use closing prices with no bid-ask spread. For the smallest names, that gap is larger than the measured excess return.
- The counter-check is a sample. 92 programmes are a small slice of the 560 documented drug pathways, selected because a decision existed and the trial data were publicly findable. Programmes with thin public coverage are underrepresented in it.
What follows from this
Buying after the Phase 3 success report is, in this form, not a rule that reliably makes money. The typical trade loses, and the longer it is held, the further it falls behind the broad market. Anyone who still wants to play it has to accept two things: spread very wide, because the return depends on a few outliers, and stay committed for years, because the median path to a decision runs sixteen months. And even then, the most uncomfortable number in this study still stands: even the success case — buy after the report, sell on the approval date — trails the market in the middle.
The more interesting finding sits alongside it. The agency's decision appears to be reasonably well justifiable from the published trial data: where the blind verdict clearly favored approval, approval followed without exception. The market simply no longer pays for that, because by then it already knows. Readers who like event-driven strategies will find more cases of the same pattern in our other backtests under Studies — a signal that carries real information, and a trading recipe that still fails to turn it into a profit.
This study is a historical analysis of publicly available records. It does not evaluate any individual stock, is not investment advice, and is not medical advice. The drugs and companies named appear as evidence for the method; the assessment of the trial data is a retrospective reconstruction, not a statement about the therapeutic value of any drug.
Frequently Asked Questions
Three things, on the same data set. First: of the drugs whose Phase 3 trial was reported a success, how many actually reached approval — and how long did each stage take? Second: what would buying the stock after that report have returned, measured against the broad market and against the biotech index? Third: would we have reached the same verdict as the agency using only the published trial data?
Because the distribution is extremely skewed. A single trade can return several hundred percent and pulls the average across all 438 trades up noticeably. The median, by contrast, shows how the typical case turned out — and it is negative across every holding period we measured. For the question of what will probably happen to any one investor, the median is the more honest number; for what the rule returns across many attempts, it is the mean.
A median of 477 days, or about sixteen months. The path splits into two legs: from the success report to filing the application, a median of 245 days; from filing to the decision, a median of 360 days. The middle half of cases falls between 332 and 677 days. Only decisions reached within three years of the report are counted here — the same cutoff the trades use when looking for their approval date.
Of 560 drugs for which either source found evidence, 268 are approved, 107 carry a Complete Response Letter with no later approval, and 185 are filed but still awaiting a decision. These numbers are explicitly not a success rate: for 463 of the 1,023 assigned drugs, no source found anything, and they are missing from the table entirely.
It ran in two stages, so the verdict could not be distorted by knowledge of the outcome. First, one step assembled the published trial data for 92 programmes — design, sample size, control arm, primary endpoint, effect size, p-value, safety signals — explicitly without the regulatory outcome. Only after that did a second, separate step rule on each file: approve, do not approve, or evidence insufficient. The comparison against the actual decision came last.
It is a reconstruction, not a genuine advance prediction. For 87 of the 92 programmes, prior knowledge from model training could not be ruled out — the outcome of many prominent approval decisions is publicly documented. What carries real weight are the five cases where no prior knowledge was detectable — three of them saw an approval in 2026 for exactly the programme in the file. The figure of 54 correct calls out of 54 is therefore a strong signal, not proof of forecasting ability.
Looking closely, they actually did. In all three cases — binimetinib, zuranolone and tivozanib — the file the verdict was based on referred to a different programme than the one that was later approved: a different indication, a different trial, a different treatment line. For the specific application under judgment, the verdict was correct each time; the comparison, however, runs at the level of the drug, and that level does not know the difference.
No. This study tests a well-known trading idea against historical data and states its limits openly. It does not evaluate any individual stock, offers no investment advice, and certainly no medical advice. The drugs and companies named appear as evidence for the method, not as a judgment of the company or the drug in question.


