Hypergrowth: One in Four Buys Fires in a Confirmed Downtrend
85 of the 349 organic hypergrowth buys — nearly one in four — fired in the middle of a confirmed downtrend, and that group has the worst median return in every one of the four holding periods tested; its sub-portfolio fell by as much as 95.80% along the way. The timing filter we had actually hoped for — a confirmed Weinstein uptrend plus proximity to the 52-week high — works only at a 12-month hold, where it lifts the annual return from 18.13% to 25.36%; at three months it costs 12.86 percentage points. In this study, avoidance is the steadier lever than timing.
 Thomas Mücke
Founder & Publisher
Thomas Mücke
Founder & Publisher
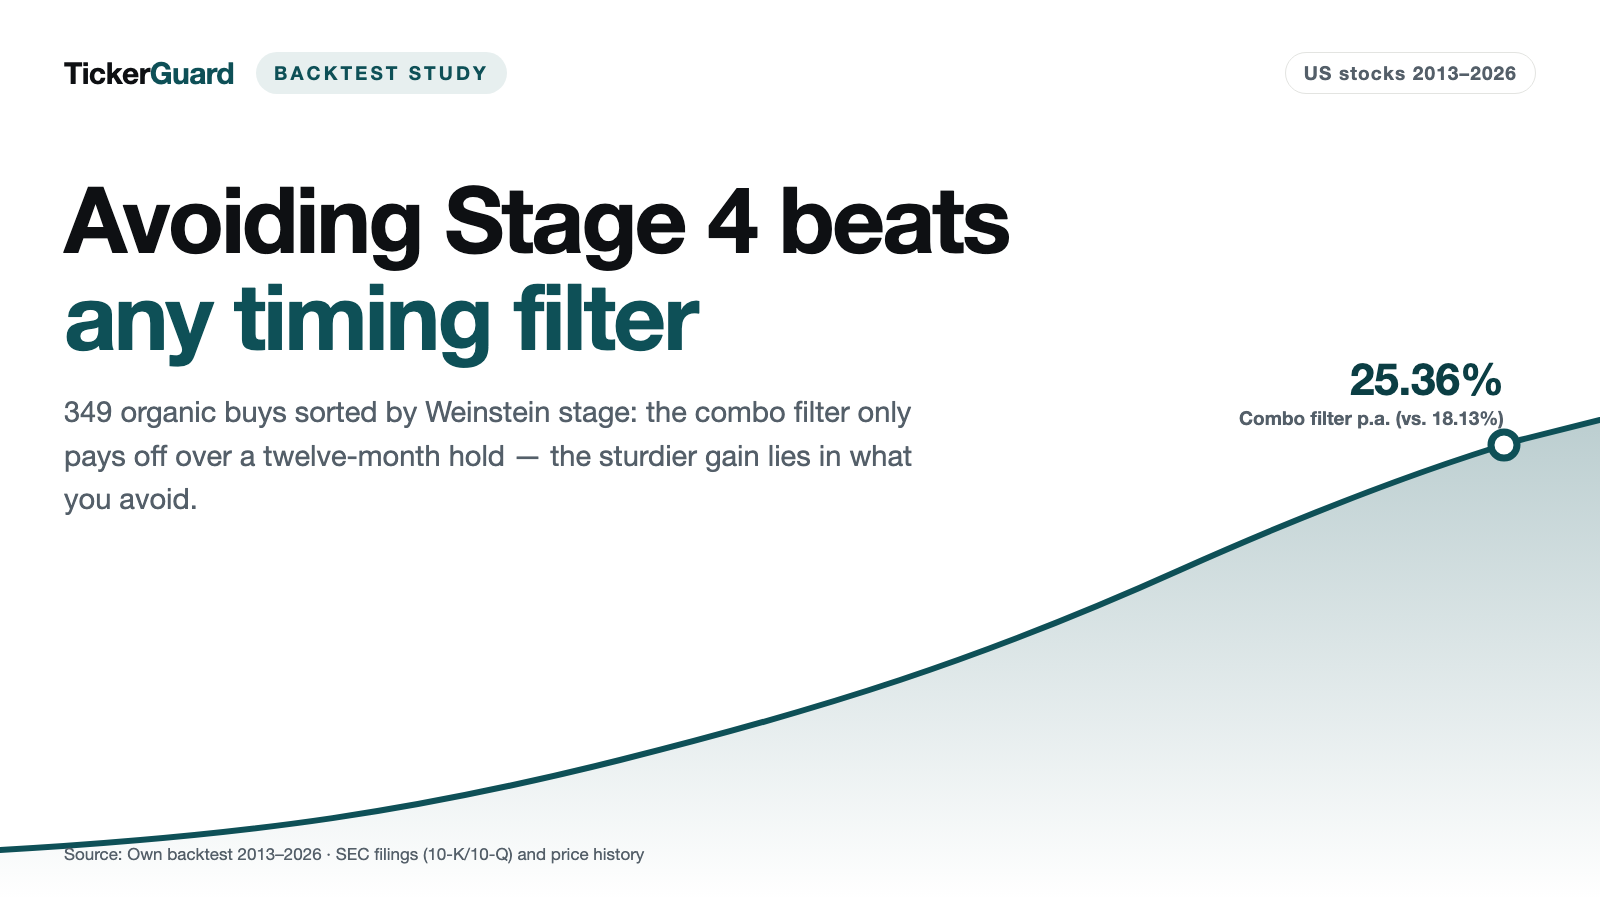
Nearly one in four buys fired in the middle of a confirmed downtrend — and those were the worst-performing buys in every holding period tested. That is the finding when you sort 349 buy signals for organic revenue hypergrowth by the chart phase the stock was in on its purchase date. It follows our base study on organic hypergrowth, which showed that companies growing revenue for seven straight quarters under their own power beat the S&P 500 Total Return Index in every holding period tested (18.13% to 31.83% a year against 15.02%), at the price of drawdowns between −52.07% and −55.04%. This follow-up asks a pure timing question about those same buys: can a simple technical filter improve anything — more return, less drawdown, or both?
The honest answer splits in two, and the two levels must not be conflated. At the individual-position level, the finding is unambiguous and holds in all four holding periods: buys in a confirmed uptrend (Stage 2) have the best median, buys in a confirmed downtrend (Stage 4) the worst. At the portfolio level, the combo filter carries only at a 12-month hold and when held while the signal lasts; at three and six months it costs return — and those are precisely the holding periods whose portfolio figures are too thinly populated to bear much weight: the 3-month combo portfolio holds a median of two positions.
The sturdier finding in this study, then, isn't the timing gain — it's avoidance. Stage 4 buys are the weakest group by a wide margin: the worst median in all four holding periods, down to −14.04%; at portfolio level they trail every other stage in three of four, near zero at six and twelve months (−0.41% and 0.82%); drawdowns as deep as −95.80%. What this study does not say: how much a portfolio would gain by simply leaving every Stage 4 buy out — we did not compute that variant. Data as of August 8, 2026.
The result in four numbers
Does a simple technical timing filter help the organic hypergrowth signal from the base study — or does it just get in the way? Four numbers from the data set carry the finding:
- 24.4% of all organic buys fired in Stage 4, a confirmed downtrend — 85 of 349, nearly one in four. That group had the worst median return in all four holding periods, at the 12-month main hold −14.04%.
- 25.36% a year is what the combo recipe (Stage 2 + near the high) returned at the 12-month main hold, against 18.13% for the unfiltered organic arm — an edge of +7.23 pp. That held only for this one holding period.
- −12.86 pp is what the same filter cost at a 3-month hold (18.97% against 31.83% for the unfiltered arm) — not a consistent return lever.
- 1.38 pp is what remained of the main hold's edge once 2021 and 2022 dropped out of the sample (instead of +7.23 pp with them) — more than one in three 12-month combo entries (34.3%, 46 of 134) come from 2022 alone.
The sturdier finding in the tested window from 2013 through 2026 was the weakness of Stage 4 buys, not the timing gain of the combo filter, which held only at a 12-month hold and nearly vanished once 2021 and 2022 were excluded.
The Weinstein stage: four chart phases, determined mechanically
Technical analysis following Stan Weinstein splits a stock's price history into four recurring phases: Stage 1 (basing, price moves sideways after a decline), Stage 2 (uptrend, the actual buy zone), Stage 3 (topping, price moves sideways after an advance), and Stage 4 (downtrend). We determine the stage for each purchase date mechanically from the 150-day moving average (SMA150) and its slope over the prior 21 trading days: a price above an SMA150 rising by at least 1% counts as Stage 2; a price below an SMA150 falling by at least 1% counts as Stage 4. When the slope is flatter than 1% in either direction, the prior phase decides between Stage 1 and Stage 3. We also measure proximity to the 52-week high: "near" means no more than 25% below the highest closing price of the prior 252 trading days.
Of the 349 organic buys, 5 belong to companies with fewer than 170 trading days of price history before the purchase ("too young," mostly recent IPOs) — no stage can be assigned to those. For 47 of the 349 buys (13.5%) the classification is "fuzzy," because neither the price slope nor the prior phase was clear enough for an unambiguous call. That fuzziness is confined entirely to Stage 1 and Stage 3 — the two classes this study actually turns on, Stage 2 and Stage 4, are sharply defined in every single case.
| Stage | n | Share | of which fuzzy |
|---|---|---|---|
| Stage 1 (basing) | 36 | 10.3% | 16 |
| Stage 2 (uptrend) | 156 | 44.7% | 0 |
| Stage 3 (topping) | 67 | 19.2% | 31 |
| Stage 4 (downtrend) | 85 | 24.4% | 0 |
| too young (IPO) | 5 | 1.4% | – |
Nearly a quarter of all organic buy signals (24.4%) fired in a confirmed downtrend — the revenue signal alone doesn't distinguish a stock that's just turning from one that's still falling. The median distance to the 52-week high across all 349 buys is −19.74%; 198 of the 349 buys (56.7%) fall within 25% of the yearly high.
Return by stage: clear-cut at position level, long holds only at portfolio level
We ran a separate sub-portfolio for each stage and each of the base study's four holding periods, using the identical equal-weighted method.
| Stage | 3 months | 6 months | 12 months (main) | Held while signal lasts |
|---|---|---|---|---|
| Stage 1 | 10.88% (−60.37%) | 14.19% (−63.61%) | 5.33% (−93.46%) | 19.20% (−57.00%) |
| Stage 2 | 16.94% (−55.66%) | 20.75% (−53.25%) | 22.95% (−50.85%) | 24.97% (−42.10%) |
| Stage 3 | 18.53% (−62.69%) | 29.98% (−69.83%) | 22.49% (−80.80%) | 24.45% (−70.72%) |
| Stage 4 | 19.00% (−87.28%) | −0.41% (−95.80%) | 0.82% (−82.39%) | 13.11% (−72.51%) |
At the position level, the pattern is unambiguous: Stage 2 has the highest median return and hit rate in all four holding periods, Stage 4 the lowest median — and the lowest hit rate in three of four; only at six months does Stage 1 sit just below Stage 4, at 36.1% against 36.5%. The gap is widest at the 12-month main hold — a median of +3.77% for Stage 2 (147 positions, 55.1% hit rate) against a median of −14.04% for Stage 4 (83 positions, 41.0% hit rate).
On median return, those two edges — Stage 2 at the top, Stage 4 at the bottom — hold in every single holding period:
| Stage | 3 months | 6 months | 12 months (main) | Held while signal lasts |
|---|---|---|---|---|
| Stage 1 | +0.07% / 52.8% | −7.83% / 36.1% | −0.33% / 50.0% | +1.62% / 52.8% |
| Stage 2 | +6.02% / 60.3% | +3.23% / 55.6% | +3.77% / 55.1% | +1.87% / 53.2% |
| Stage 3 | +3.52% / 56.7% | −0.17% / 48.5% | −0.53% / 47.7% | +0.45% / 52.2% |
| Stage 4 | −7.31% / 43.5% | −9.56% / 36.5% | −14.04% / 41.0% | −13.44% / 35.3% |
At the portfolio level, that confirms only partly, and this is exactly where a premature conclusion could go wrong: at a 3-month hold, Stage 4 actually returns 19.00% a year — slightly above Stage 2's 16.94% — even though the median individual Stage 4 buy sits at −7.31%. The reason is a handful of extreme, very thinly populated months that can distort an equal-weighted monthly return (more on this in the limitations section below). That effect disappears at 6- and 12-month holds, where Stage 4 falls clearly behind Stage 2.
The combo filter: what it buys, and where it costs
From the stage classification and proximity to the high, we build five subsets of the same organic arm: the full arm (a), Stage 2 buys only (b), buys near the high only (c), the combination of both (d, the actual recipe), and, for comparison, Stage 4 buys only (e).
| Holding period | Subset | n | Return p.a. | Max drawdown |
|---|---|---|---|---|
| 3 months | a) full organic arm | 349 | 31.83% | −54.77% |
| b) + Stage 2 | 156 | 16.94% | −55.66% | |
| c) + near the high | 198 | 16.44% | −52.34% | |
| d) Combo (Stage 2 + near the high) | 143 | 18.97% | −55.66% | |
| e) + Stage 4 | 85 | 19.00% | −87.28% | |
| 6 months | a) full organic arm | 345 | 25.23% | −55.04% |
| b) + Stage 2 | 153 | 20.75% | −53.25% | |
| c) + near the high | 194 | 17.87% | −46.12% | |
| d) Combo (Stage 2 + near the high) | 140 | 20.20% | −53.21% | |
| e) + Stage 4 | 85 | −0.41% | −95.80% | |
| 12 months (main) | a) full organic arm | 336 | 18.13% | −52.07% |
| b) + Stage 2 | 147 | 22.95% | −50.85% | |
| c) + near the high | 188 | 18.56% | −45.53% | |
| d) Combo (Stage 2 + near the high) | 134 | 25.36% | −47.30% | |
| e) + Stage 4 | 83 | 0.82% | −82.39% | |
| Held while signal lasts | a) full organic arm | 349 | 26.03% | −53.67% |
| b) + Stage 2 | 156 | 24.97% | −42.10% | |
| c) + near the high | 198 | 25.52% | −39.08% | |
| d) Combo (Stage 2 + near the high) | 143 | 26.88% | −38.90% | |
| e) + Stage 4 | 85 | 13.11% | −72.51% |
Four takeaways from this table matter most for practical use:
The combo filter lifts return in only two of four holding periods. At the 12-month main hold, it rises from 18.13% to 25.36% (+7.23 percentage points); held while the signal lasts, it rises only marginally, from 26.03% to 26.88% (+0.85 percentage points). At 3 months, it drops from 31.83% to 18.97% (−12.86 percentage points); at 6 months, from 25.23% to 20.20% (−5.03 percentage points). The filter is not a consistent return lever — it only works at a long hold.
On drawdown, the finding is more consistent. The combo's max drawdown is smaller than or equal to the full arm's in three of four holding periods — most notably held while the signal lasts (−53.67% → −38.90%, 14.77 percentage points better) and at the 12-month main hold (−52.07% → −47.30%). Only at 3 months does it slightly worsen.
Each filter component works weaker alone than combined — in three of four holding periods. At the main hold, Stage 2 alone returns 22.95%, proximity to the high alone 18.56%, combined 25.36%; at three months, 16.94% and 16.44% against 18.97%; held while the signal lasts, 24.97% and 25.52% against 26.88%. The one exception is six months: there Stage 2 alone, at 20.75%, beats the combination at 20.20%.
No mode beats the S&P 500 Total Return Index on both return and drawdown at once. The best combo result (held while signal lasts, 26.88% at −38.90%) clears the index's return (15.02%) by a wide margin — but at −38.90% its drawdown remains far deeper, and therefore worse, than the index's −23.87%.
The honest headline: avoidance is the steadier lever
The real finding of this study isn't the timing gain at the main hold, real as it is — it's the avoidance effect. At position level, Stage 4 buys have the worst median in all four holding periods (−7.31% to −14.04%) and the lowest hit rate in three of four (35.3% to 43.5%; at six months Stage 1 sits just below). At portfolio level (subset e in the table above) they trail every other stage in three of four holding periods: −0.41% at 6 months, 0.82% at the 12-month main hold, 13.11% held while the signal lasts, with drawdowns between −72.51% and −95.80%. The apparent exception at 3 months (19.00%) is, as shown above, a thin-sample artifact from a handful of extreme months — not a genuine counter-finding.
One caveat belongs here immediately: we did not compute a separate "everything except Stage 4" portfolio. The statement rests on comparing the stages against each other — Stage 4 is the weakest group, in every holding period at position level and in three of them at portfolio level too. What that comparison supports is the direction, not a return figure for a portfolio without Stage 4 buys.
The combo recipe sharpens the effect further: it cuts the share of positions that lose more than 50% of their value in every single holding period — at 3 months from 4.0% to 1.4%, at 6 months from 8.1% to 2.9%, held while the signal lasts from 9.2% to 4.2%, and at the main hold from 14.3% to 8.2%. That is a 43% reduction at the main hold and up to 65% at the short holds — so at twelve months, noticeably less than a halving.
| Holding period | n | Median | Hit rate | Share of positions < −50% | vs. full organic arm |
|---|---|---|---|---|---|
| 3 months | 143 | +5.34% | 59.4% | 1.4% | 4.0% |
| 6 months | 140 | +1.61% | 54.3% | 2.9% | 8.1% |
| 12 months | 134 | +3.93% | 56.0% | 8.2% | 14.3% |
| Held while signal lasts | 143 | +1.89% | 53.8% | 4.2% | 9.2% |
Extreme values in the 12-month combo: the best buy was GRWG at +193.81%, the worst NVAX at −73.86%. Of the 134 combo positions, 4 are still open at the data edge (July 2026), and one ended in a forced sale after delisting.
How robust is the combo recipe?
We subjected the combo recipe to the same three robustness checks the base study ran on the underlying organic signal: excluding the Covid-distorted 2021/2022 cohort, and varying the thresholds for proximity to the high and for slope.
Excluding 2021/2022 — the same exclusion rule as the base study, since the signal window spans seven quarters and the cohort crosses the calendar-year boundary:
| Holding period | Combo n (before → after) | Combo p.a. full | Combo p.a. excl. Covid | Δ | Combo drawdown excl. Covid |
|---|---|---|---|---|---|
| 3 months | 143 → 85 | 18.97% | 16.66% | −2.31 pp | −55.66% |
| 6 months | 140 → 84 | 20.20% | 18.13% | −2.07 pp | −53.21% |
| 12 months | 134 → 79 | 25.36% | 21.17% | −4.19 pp | −48.99% |
| Held while signal lasts | 143 → 85 | 26.88% | 13.28% | −13.60 pp | −78.92% |
At the main hold, the combo recipe survives the exclusion: 21.17% stays above the full organic arm excluding Covid (19.79%) and above the index. The edge shrinks substantially, though — from 7.23 to 1.38 percentage points — because the exclusion hits the recipe hard: roughly 41% of combo buys fall away, and at the main hold, 46 of the 134 combo entries (34.3%) come from 2022 alone. Held while the signal lasts, the result instead collapses (26.88% → 13.28%), with the drawdown worsening to −78.92%. At 3 and 6 months, the combo recipe stays behind the full organic arm in both versions.
On the threshold values, the main hold is stable, other holding periods less so: varying the proximity-to-high threshold between 15% and 35% keeps the 12-month return in a range of just 1.30 percentage points (24.06% to 25.36%), while at 6 months it swings between 14.81% and 21.93% (a 7.12-point range) — there, the proximity threshold isn't a reliable lever. Varying the slope threshold for Stage 2 between 0.5% and 2.0% instead, the return rises monotonically with filter strictness in three of four holding periods — at the main hold from 22.79% through 25.36% to 28.96% — though the sample shrinks to 115 positions at the strictest setting, and the direction reverses when held while the signal lasts (26.88% → 24.40%).
A single exceptionally strong month also carries meaningful weight: without the best individual month, the 12-month combo drops from 25.36% to 22.12% — September 2025's +42.75% return, on just 5 open positions, alone accounts for 3.24 percentage points. The 3-month combo depends even more heavily on outliers: without its best month (September 2025, +78.39% on a single open position), return drops from 18.97% to 14.00% — a good quarter of the stated return there rides on one month with one stock.
Honest limits
A subset portfolio is inherently more thinly populated than the base study's full organic portfolio — and that hits the shorter holding periods especially hard.
| Subset | invested months | median positions | months with < 3 positions | maximum |
|---|---|---|---|---|
| 3 months, full organic arm | 156 | 5.0 | 32 | 70 |
| 3 months, combo | 130 | 2.0 | 77 | 35 |
| 6 months, full organic arm | 162 | 8.5 | 10 | 86 |
| 6 months, combo | 147 | 4.0 | 32 | 39 |
| 12 months, full organic arm | 162 | 15.0 | 0 | 123 |
| 12 months, combo | 159 | 8.0 | 16 | 50 |
| Held while signal lasts, full organic arm | 162 | 11.0 | 0 | 90 |
| Held while signal lasts, combo | 156 | 6.0 | 21 | 40 |
The 3-month combo portfolio is effectively unusable as a return expectation: it holds a median of just two positions and has fewer than three open positions in 77 of its 130 invested months — a track record that measures individual outcomes, not a recipe. Only the 12-month main hold sits on a reasonably solid base, with a median of 15 positions (full arm) or 8 positions (combo).
Further caveats belong in any honest read of these numbers:
The 2022 cohort cluster. 34.3% of the 12-month combo entries come from the single year 2022, the year of the Covid base effect documented in the base study. As shown above, excluding that cohort costs 4.19 percentage points at the main hold.
Covid robustness is uneven. The 12-month main hold retains the combo recipe's edge without the Covid cohort, though shrunk. Held while the signal lasts, the result collapses instead, from 26.88% to 13.28%, with a worsening drawdown. A finding that's robust in only one holding period shouldn't be extended to the others.
Fuzzy classifications sit in Stage 1 and Stage 3. 47 of 349 classifications (13.5%) had to be resolved by prior phase or price position because neither was clear enough on its own. They're confined entirely to Stage 1 and Stage 3 — the findings on Stage 2 and Stage 4, which the combo recipe is built on, are unaffected; the findings on Stage 1 and Stage 3 should be read with more caution.
Small samples overall. The combo recipe rests on 134 to 143 positions per holding period, and only 79 to 85 after excluding Covid. At the strictest slope threshold, it's 115. That size supports reading a direction, not a reliable return expectation.
Five buys without a stage. Recent IPOs with fewer than 170 trading days of history fall out of every stage subset, including the combo recipe — meaning the filter simply doesn't apply to young stocks. On top of that, the price-data gap around younger IPOs already documented in the base study (Upstart, Coinbase, SoFi, among others, are missing from the price data) sharpens this further, since the filter already requires a long price history.
The thresholds are set, not optimized. The 1% slope threshold and the 25% proximity-to-high threshold come from classic Weinstein technical-analysis literature and weren't tuned for this study. The sensitivity checks above show how much the result depends on exactly these values — especially at the 6-month holding period.
Three buys in detail — and two deliberately excluded
Three examples from the 12-month combo recipe show how the classification works case by case:
| Company | Purchase date | SMA150 slope | Distance to 52-week high | Status | Return |
|---|---|---|---|---|---|
| JAZZ (Jazz Pharmaceuticals PLC) | 2013-01-31 | +3.50% | −4.97% | combo | +168.41% |
| AMD (Advanced Micro Devices Inc) | 2021-10-29 | +5.12% | −2.20% | combo | −50.15% |
| LITE (Lumentum Holdings Inc) | 2026-02-27 | +31.90% | −3.11% | combo (open) | +8.64% (5 months) |
| FATAQ (FAT Brands Inc.) | 2022-03-31 | −2.63% | −43.39% | excluded: Stage 4 | +1.28% |
| HRMY (Harmony Biosciences Holdings) | 2021-11-30 | +4.79% | −28.61% | excluded: too far from high | +74.98% |
AMD shows the filter is no return guarantee: a textbook Stage 2 buy near the yearly high that still lost half its value over twelve months. HRMY shows the flip side of filtering: a Stage 2 buy that would have returned 74.98% but missed the 25% proximity-to-high cutoff by a narrow margin (−28.61% distance) and was excluded from the combo recipe. Filters don't just weed out weak buys — occasionally they discard good ones too.
What this means in practice
The practical takeaway here is more modest than a timing recipe usually promises — but it's grounded in the data: in the tested data, buys performed better when the stock was already in a confirmed uptrend (price above a rising 150-day average) and not too far from its yearly high; the edge showed up only at a roughly 12-month hold, and even there it shrank under the robustness checks. The flip side weighs at least as much: buys made in a confirmed downtrend — the Stage 4 group — trailed every other stage in three of four holding periods, near zero at six and twelve months (−0.41% and 0.82%), with drawdowns between −72.51% and −95.80%.
The combo filter still isn't for the faint of heart: even at the 12-month main hold, the max drawdown stays at −47.30% — barely better than the unfiltered organic arm and still roughly double the S&P 500's worst drawdown. For anyone who wants to apply this recipe to today's candidates, there's now a backtested scanner in our section for backtested scanners: Organic Hypergrowth in an Uptrend. It surfaces stocks that currently meet the criteria described here — organic revenue hypergrowth, Stage 2, near the 52-week high. This isn't a buy recommendation; it's a tool applying the same rules tested in this study.
How this study was built
Stage classification. On the purchase date, on a daily basis, using split-adjusted closing prices: SMA150 is the average of the 150 closing prices up to and including the purchase date; slope is the percentage change in SMA150 over the prior 21 trading days; "flat" means a slope under 1% in either direction. Stage 2 means the price is above an SMA150 rising at least 1%. Stage 4 means the price is below an SMA150 falling at least 1%. When the slope is flat, the prior phase — the SMA150 as of 21 trading days ago compared with its level 63 trading days ago — decides between Stage 1 and Stage 3; when that's also ambiguous, price position decides, and the classification is flagged "fuzzy." Companies with fewer than 170 trading days of history before the purchase get no stage assignment.
Proximity to the 52-week high. Distance equals the closing price divided by the highest closing price of the prior 252 trading days (including the purchase date), minus 1. "Near" means a distance of no more than 25% below that high.
Classified once per buy, not per holding period. Since the four holding periods largely buy the same entries, stage and proximity classification runs once per company ID and entry month, then joins onto all four modes — 349 classifications cover 349 (3-month), 345 (6-month), 336 (12-month), and 349 (held-while-signal-lasts) positions.
Portfolio method. Identical to the base study: period Jan 2013 through Jul 2026 (163 months), equal-weighted average of the monthly returns of every open position in a given subset each calendar month, months with no open position counting as a zero return, the curve built by chaining monthly returns from a starting value of 1.0, drawdown measured against the running high-water mark. A 0.1% cost per buy and sell side is already built into the underlying position returns.
Reproduction check. Before running the stage analysis, we verified this same portfolio method against the base study's published numbers for the full organic arm: all four holding periods reproduce the published return to within 0.0000 percentage points (for example, 18.13% at the main hold), along with matching position counts and drawdowns — well within the required ±0.5 percentage-point tolerance.
Benchmark. The S&P 500 Total Return Index over the same period: 15.02% a year, max drawdown −23.87% — identical to the base study.
Sources and data basis. Historical price data from the existing market-data base, evaluated point-in-time up to and including each purchase date — no additional data pulls for this follow-up study, no write access to the data base. The organic classification itself is carried over unchanged from the base study (SEC filings, 10-K/10-Q). Data as of August 8, 2026.
What does not follow from this study
That a combo filter of Stage 2 and proximity to the high lifts return at the main hold doesn't mean it does so in every holding period, every market regime, or for every future buy — at 3- and 6-month holds, that exact same filter demonstrably costs return. The small, and in places extremely thin, samples (in the 3-month combo, sometimes just one or two positions a month) mean these numbers support reading a direction, not a reliable return expectation. The 2022 cohort cluster and the dependence on a handful of unusually strong months further show how sensitive even the sturdiest sub-finding (the main hold) is to specific stretches of time.
This study joins our own series of whole-universe stock backtests — starting with the organic hypergrowth base study itself, and including our retest of Joel Greenblatt's Magic Formula. We've also examined several of the individual companies named here in depth; the full collection lives in our stock analyses.
This article is a historical analysis and not investment advice. It contains no buy or sell recommendation, no price target, and no forecast; individual companies named in it serve solely to illustrate historical price patterns and the coverage limits of the data set — the accompanying scanner is no substitute for independent research either. Anyone making investment decisions should assess their own situation and risks — with professional advice where appropriate.
Frequently Asked Questions
It builds on the organic hypergrowth base study (organic arm B, main signal f7_x2.0) and asks a pure timing question: what chart phase, under the classic Weinstein stage framework (Stage 1 basing, Stage 2 uptrend, Stage 3 topping, Stage 4 downtrend), was a stock in on the day it was bought, and how close was the price to its 52-week high? Both are determined mechanically from prices available up to and including the purchase date, for all 349 organic buys and all four holding periods from the base study.
Only partly, and only for certain holding periods. The combo filter (Stage 2, and no more than 25% below the yearly high) lifts the annual return at the 12-month main holding period from 18.13% to 25.36% (+7.23 percentage points) and lowers the max drawdown from −52.07% to −47.30%. When held while the signal lasts, the effect is minimal at +0.85 percentage points. At 3- and 6-month holds, the filter actually costs return — at 3 months, by as much as −12.86 percentage points. It's not a universal lever.
Avoiding Stage 4 buys. At position level they have the worst median in all four holding periods (−7.31% to −14.04%) and the lowest hit rate in three of four (35.3% to 43.5%; only at six months does Stage 1 sit just below Stage 4, at 36.1% against 36.5%). At portfolio level they trail every other stage in three of four holding periods: −0.41% at six months, 0.82% at twelve months, 13.11% held while the signal lasts, with drawdowns between −72.51% and −95.80%. We did not compute a separate "everything except Stage 4" portfolio — the statement rests on comparing the stages against each other.
Only partly. At the 12-month main hold, the combo filter survives excluding 2021/2022: return stays at 21.17%, still above the full organic arm without Covid (19.79%) and above the index — but the edge shrinks from 7.23 to 1.38 percentage points, because 34.3% of the 12-month combo entries come from 2022 alone. Held while the signal lasts, the result collapses instead, from 26.88% down to 13.28%, with a drawdown of −78.92%.
Read them with caution. The 3-month combo portfolio holds a median of just two positions and has fewer than three open positions in 77 of its 130 invested months — a track record that measures individual outcomes, not a recipe. Only the 12-month main mode, with a median of eight combo positions per month, sits on a reasonably solid base. Even there, a meaningful chunk of the return rides on a few unusually strong months.
Yes. The recipe examined here — organic revenue hypergrowth, Stage 2, near the yearly high — is available as a backtested scanner, "Organic Hypergrowth in an Uptrend": /stocks/scanner/organisches-hyperwachstum-stage2. This isn't a buy recommendation or a price target; the scanner simply shows which stocks currently meet the criteria described in this study.


