The One-Cent Stop in the Backtest: 0 of 162 Variants Held Up
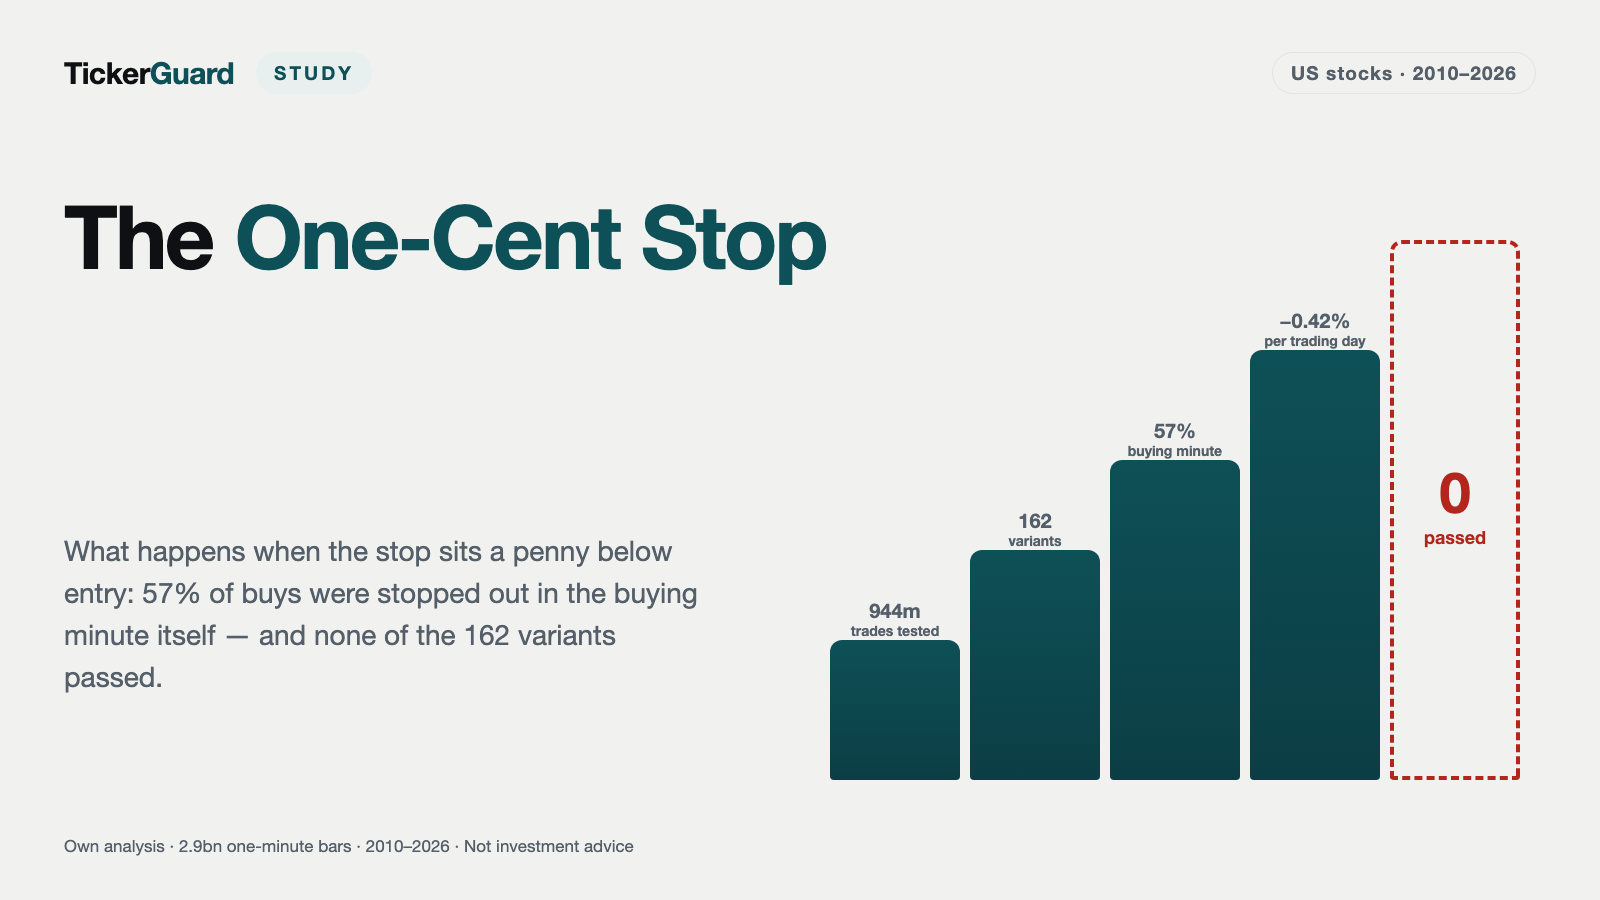
944 million trading attempts in the US stocks we analysed show: the ultra-tight one-cent stop, a recipe attributed to Dr. David Paul, did not hold up in the backtest in any of the 162 tested net variants. A full round trip of buying and selling cost 4.9 times the stop distance itself in the backtest – the arithmetic was lost before the price even moved.
 Thomas Mücke
Founder & Publisher
Thomas Mücke
Founder & Publisher
A recipe from the trading world sounds deceptively simple: buy on a breakout – the moment the price rises above a previous high – and set the stop, the automatic sell order triggered by a price drop, just one cent below the entry. A single failed attempt is supposed to cost almost nothing, while a successful breakout is allowed to run far. This recipe is often attributed to Dr. David Paul, a sought-after speaker at trading conferences. We recomputed it across 944,744,286 individual trading attempts in the US stocks we analysed, over 16 years.
The result in the backtest is already clear at this point: of 162 pre-registered net variants, not a single one cleared the pre-registered success bar – 0 of 162. The reason lies not in the market, but in the arithmetic: a full round trip of buying and selling cost 0.1255% at the typical entry price of the stocks in this study in the backtest – 4.9 times the one-cent stop itself. This cost gap decided the arithmetic before the first price even moved.
The Result in Four Numbers
- −0.42% was lost by a typical stock trading day of the US stocks in this study in the backtest after costs – all attempts of the day added up, in the least bad of the three entry rules tested (E2 high-of-day breakout).
- 57% of all purchases in the flagship chain E2 were stopped out in the backtest in the very minute of purchase – the buy and the forced sale fell in the same minute.
- 0 of 162 pre-registered net variants cleared the success bar in the backtest – gross, calculated with no trading costs at all, 21 of 45 variants did.
- 4.9 times as expensive was a full round trip of buying and selling in the backtest compared with the one-cent stop itself – 0.1255% against 0.0255% at the typical entry price of USD 39.28.
One-sentence verdict: the recipe did not hold up anywhere in the backtest – it did not fail against the market, but against its own cost arithmetic.
Every figure in this study leaves out the year 2020 entirely. The pandemic year was so exceptional on the market that it would have distorted every average; the full figures remain in the underlying data file, but the calculation shown throughout excludes 2020.
What This Is About
The recipe tested here, in plain terms: the stop, the automatic sell order triggered by a price drop, sits just one cent below the purchase price of a breakout – the moment the price rises above a previous high. If the price falls even slightly, the position is thrown out immediately; if it keeps rising, the profit is allowed to run freely. The promise behind it: many tiny losses against a few large winners.
This recipe is often attributed to Dr. David Paul – a South African engineer who was active in the markets from 1982 and traded full-time from 1988. He taught banks and financial institutions in South Africa and was a sought-after speaker at public trading conferences, including the MoneyShow; he also led the UK branch of VectorVest. Dr. Paul died in 2023 at the age of 68.
What is documented from him is a different teaching: entering at the "danger point" – the point where risk is smallest and profit potential largest, in the tradition of the analyst Wyckoff, who looked at price and volume together. In a MoneyShow interview, he said, in his own words:
"I want to put my entries where the masses put their stops."
— David Paul, PhD, MoneyShow interview "3 Primary Rules for Swing Traders," 14 December 2011, moneyshow.com
This is exactly the honest distinction this study draws: his documented teaching places the stop where it escapes the churn of prices and is not picked off by professionals or algorithms – outside the zone where the masses place their own stops. A stop just one cent below the entry, by contrast, sits right in the middle of that zone, exactly where his own documented teaching says a stop should not go. The one-cent stop is a widely repeated recipe attributed to Dr. Paul – not his documented own teaching. This study tests both readings: the tight one-cent stop and, as a counterpoint on the same stop ladder, a wide stop at the opening range or the low of the day.
Three pre-registered entry rules were tested. E1 opening breakout: the first five trading minutes form the opening range – the price range between the high and low of those first minutes; a purchase is made as soon as one minute closes above its highest price. The same building block, also on 5-minute candles, was tested in the sister study on intraday strategies. E2 high-of-day breakout: from 10:00 a.m., a purchase is made as soon as one minute closes above the highest price the day has seen so far. E3 pullback: after a minute with a lower low than the one before it, a purchase is made as soon as one minute closes above the high of the previous minute – and only if the price is above the day's opening. A purchase is never made at the signal price itself, but only at the opening of the following minute.
Pre-registered means: filters, entries and exits, and the success bar were all fixed before the first number existed. There was no after-the-fact parameter search and no adjusting until a variant looked positive – what held up or did not hold up in the end is a finding, not a story shaped in hindsight.
Why It Fails on Arithmetic
This calculation can be followed without any market knowledge. The typical entry price of the stocks in this study came to USD 39.28 in the backtest. A one-cent stop distance corresponded, at this price, to 0.01 ÷ 39.28 = 0.0255% – tiny, as promised.
But every single attempt cost a full round trip: buying once, selling once. Both sides together: a commission – the broker's trading fee – of USD 0.005 per share and side (0.0127% of the price) plus 0.0500% per side for spread and execution shortfall. The spread is the difference between the bid and ask price, that is, between the price at which a sale can be made and the price at which a purchase can be made. Both items together came to 0.0627% in costs per side – times two for buying and selling: 0.1255% for the full round trip.
| Item | Share of the price | At USD 39.28 |
|---|---|---|
| Stop distance: one cent | 0.0255% | USD 0.0100 |
| Commission per side (USD 0.005 per share) | 0.0127% | USD 0.0050 |
| Spread and execution shortfall per side | 0.0500% | USD 0.0196 |
| One full round trip (buy + sell) | 0.1255% | USD 0.0493 |
At this study’s typical entry price of USD 39.28. The round trip cost 4.9 times as much as the stop itself carried in risk. Every stop-out therefore cost one full round trip — roughly five times what the stop itself allowed to be lost. Source: price data, own calculations.
0.1255% divided by 0.0255% came to 4.9280, rounded in the text to 4.9 times. A stop that sat one cent below the entry therefore cost, on average, nearly five times as much in fees and spread as it carried in risk itself. For a sense of scale: even the gross advantage of the flagship chain E2, calculated with no trading costs at all, came to only +0.0214% per stock trading day in the backtest – a single round trip was therefore about six times as large as this advantage.
How Tight Can the Stop Be?
Median. The median is the typical case: half of all stock trading days sat above it, half below. It says nothing about how large the swings at the extremes are.
Average. The average is everything added up and spread evenly. Individual outliers can pull it strongly up or down – a single very good or very bad day can shift it. Wherever this study says "trimmed average," the top and bottom one percent of results were capped at that boundary beforehand (winsorised), otherwise a handful of extreme days would have decided the whole number.
Across all three entry rules, the backtest showed the same ladder:
| Stop distance | E1 · Opening breakout | E2 · High-of-day breakout | E3 · Pullback |
|---|---|---|---|
| One cent below the entry | −0.416% Median −0.540% · 10% winning days |
−0.368% Median −0.418% · 9% winning days |
−0.493% Median −0.643% · 12% winning days |
| One cent below the low of the signal minute | −0.348% Median −0.510% · 25% winning days |
−0.255% Median −0.380% · 20% winning days |
−0.403% Median −0.619% · 26% winning days |
| 0.05% below the entry | −0.392% Median −0.517% · 13% winning days |
−0.328% Median −0.357% · 12% winning days |
−0.463% Median −0.794% · 16% winning days |
| 0.10% | −0.365% Median −0.466% · 19% winning days |
−0.280% Median −0.318% · 17% winning days |
−0.421% Median −0.654% · 22% winning days |
| 0.25% | −0.295% Median −0.393% · 28% winning days |
−0.211% Median −0.376% · 25% winning days |
−0.321% Median −0.403% · 31% winning days |
| 0.50% | −0.221% Median −0.608% · 34% winning days |
−0.163% Median −0.607% · 33% winning days |
−0.234% Median −0.578% · 36% winning days |
| 1.00% | −0.160% Median −0.303% · 40% winning days |
−0.137% Median −0.253% · 40% winning days |
−0.164% Median −0.262% · 41% winning days |
| Wide (opening range or low of the day) | −0.162% Median −0.371% · 39% winning days |
−0.119% Median −0.162% · 43% winning days |
−0.168% Median −0.328% · 40% winning days |
| No stop at all | −0.125% Median −0.128% · 45% winning days |
−0.116% Median −0.124% · 44% winning days |
−0.124% Median −0.124% · 45% winning days |
| One cent, filled one cent worse | −0.520% Median −0.595% · 9% winning days |
−0.454% Median −0.484% · 8% winning days |
−0.616% Median −0.712% · 11% winning days |
| For comparison: simply hold (09:35 to the close, no signal, no stop) | −0.142% Median −0.123% · 4,133,969 stock trading days |
||
| For comparison: a randomly chosen entry minute with the same one-cent stop | −0.487% Median −0.575% · 4,407,452 stock trading days |
||
Result per stock trading day, all attempts of the day added up, after costs of 0.05% per side plus commission, at most five attempts per day, the year 2020 excluded. The tighter the stop, the larger the loss in the backtest. None of the three entry rules changed the sign. Source: price data, own calculations.
At the tightest end of the ladder, the one-cent stop, the flagship chain E2 lost −0.3675% per stock trading day in the backtest across the US stocks in this study (trimmed average), with a median of −0.4179%. At the other end, with no stop at all, it was only −0.1158% (median −0.1243%). The pattern in one sentence: the tighter the stop, the larger the loss in the backtest – the ladder is almost entirely monotonic from top to bottom.
Why the median and the average diverge here. For E2, the median at −0.4179% sat lower than the trimmed average at −0.3675%. That means the typical day was worse than the average, because the few days on which a winner was allowed to run turned out much larger in the backtest than the many small losing days – they pulled the average up, while the typical case stayed unimpressed in the red. That is exactly the promise of the recipe, many small losses against one large winner – it even held, it just fell far short of covering the costs.
The details of the ladder for the flagship chain E2 also show the 95% range – a confidence range from a resampling procedure with 1,000 draws (a so-called bootstrap), in which whole trading days were drawn each time, because attempts on the same day are related and cannot be drawn individually. In none of the four time periods (also called time slices – the 16 years studied were split into four blocks for this) and in none of the 16 years studied was any stop level positive.
| Stop distance | Stock trading days | Typical day median |
Average trimmed |
Share of winning days |
95% range | Positive time periods |
|---|---|---|---|---|---|---|
| One cent below the entry | 2,326,071 | −0.418% | −0.368% | 8.5% | −0.37% to −0.36% | 0 of 4 |
| One cent below the low of the signal minute | 2,326,071 | −0.380% | −0.255% | 20.1% | −0.26% to −0.24% | 0 of 4 |
| 0.05% below the entry | 2,326,071 | −0.357% | −0.328% | 11.9% | −0.33% to −0.32% | 0 of 4 |
| 0.10% | 2,326,071 | −0.318% | −0.280% | 16.5% | −0.29% to −0.27% | 0 of 4 |
| 0.25% | 2,326,071 | −0.376% | −0.211% | 25.0% | −0.22% to −0.20% | 0 of 4 |
| 0.50% | 2,326,071 | −0.607% | −0.163% | 33.0% | −0.18% to −0.15% | 0 of 4 |
| 1.00% | 2,326,071 | −0.253% | −0.137% | 39.9% | −0.15% to −0.12% | 0 of 4 |
| Wide (opening range or low of the day) | 2,326,071 | −0.162% | −0.119% | 43.2% | −0.14% to −0.10% | 0 of 4 |
| No stop at all | 2,326,071 | −0.124% | −0.116% | 44.4% | −0.14% to −0.09% | 0 of 4 |
| One cent, filled one cent worse | 2,326,071 | −0.484% | −0.454% | 8.3% | −0.46% to −0.45% | 0 of 4 |
| For comparison: simply hold (09:35 to the close, no signal, no stop) | 4,133,969 | −0.123% | −0.142% | 46.1% | −0.17% to −0.11% | 0 of 4 |
| For comparison: random entry minute, one-cent stop | 4,407,452 | −0.575% | −0.487% | 11.9% | −0.49% to −0.48% | 0 of 4 |
The same ladder in detail for the least bad of the three entry rules (E2, breakout above the high of the day). The 95% range comes from a resampling procedure with 1,000 draws in which whole trading days are drawn. In no row was even one of the four time periods positive. Source: price data, own calculations.
Diluted reading. The figures above only count stock trading days on which the rule fired at least once. Calculated instead across all 4,408,737 filtered stock trading days, with days without a signal set to zero, the loss in the backtest came out smaller, but stayed positive nowhere: E1 −0.2954%, E2 −0.1984%, E3 −0.3868% (trimmed average).
What a Single Purchase Delivered
So far this has been about the whole stock trading day, with all attempts added up. At the level of the single purchase, it becomes clear how quickly the one-cent recipe was over in practice: in the backtest of the flagship chain E2, an attempt with the one-cent stop lasted, on average, only 13.8 minutes, with a hit rate of 3.27% winners.
| Stop distance | Attempts | Typical attempt median |
Average trimmed |
Winners | Stopped out in the minute of purchase |
Holding time minutes |
|---|---|---|---|---|---|---|
| One cent below the entry | 8,311,355 | −0.142% | −0.133% | 3.3% | 56.7% | 13.8 |
| One cent below the low of the signal minute | 4,580,014 | −0.234% | −0.140% | 12.2% | 15.6% | 53.9 |
| 0.05% below the entry | 6,726,657 | −0.176% | −0.135% | 5.3% | 40.2% | 22.4 |
| 0.10% | 5,283,249 | −0.226% | −0.138% | 9.0% | 23.5% | 38.0 |
| 0.25% | 3,690,717 | −0.372% | −0.141% | 18.3% | 7.2% | 80.8 |
| 0.50% | 2,899,618 | −0.612% | −0.139% | 29.0% | 1.9% | 139.7 |
| 1.00% | 2,490,157 | −0.303% | −0.135% | 38.6% | 0.3% | 214.3 |
| Wide (opening range or low of the day) | 2,360,104 | −0.165% | −0.118% | 43.0% | 0.0% | 260.6 |
| No stop at all | 2,326,071 | −0.124% | −0.116% | 44.4% | 0.0% | 299.3 |
| One cent, filled one cent worse | 8,311,355 | −0.161% | −0.161% | 3.3% | 56.7% | 13.8 |
The same question per individual purchase instead of per trading day, entry rule E2. “Stopped out in the minute of purchase” means the buy and the forced sale fell in the same minute. With the one-cent stop that was the normal case in the backtest, not the exception. Source: price data, own calculations.
The most striking value in this table: 56.73% of all purchases – rounded to 57% in the text – were stopped out in the backtest in the very same minute in which they were bought. The buy and the forced sale fell together. By comparison: with the stop below the low of the signal minute it was only 15.61%, with a 1.00% stop practically never (0.35%). The tighter the stop, the more often the attempt was already over almost as soon as it began.
Thrown Out, Straight Back In
The core of the repeated recipe is re-entry: when a position is thrown out, the next signal of the same day triggers an immediate new purchase. That is exactly what made the result worse in the backtest with every additional attempt allowed, because every further attempt cost another full round trip.
| Family | At most 1 attempt | At most 3 | At most 5 (main calculation) | Unlimited (up to 30) | Attempts per day Median / 90% / maximum |
|---|---|---|---|---|---|
| E1 · Opening breakout | −0.134% | −0.307% | −0.416% | −0.575% | 4 / 10 / 30 |
| E2 · High-of-day breakout | −0.136% | −0.290% | −0.368% | −0.442% | 3 / 8 / 30 |
| E3 · Pullback | −0.133% | −0.333% | −0.493% | −1.043% | 7 / 20 / 30 |
The heart of the recipe is re-entry: thrown out, straight back in. Every additional attempt cost another full round trip of spread and commission — which is why the result in the backtest got worse with every permitted re-entry, not better. All figures are the trimmed average per stock trading day. Source: price data, own calculations.
For the flagship chain E2, a stock trading day lost −0.1356% in the backtest with at most one attempt allowed, already −0.2897% with at most three attempts, −0.3675% at the pre-registered main calculation of at most five attempts – and −0.4416% with unlimited attempts (up to 30 per day). On the median trading day with at least one signal, 3 attempts were made, at most 8 in 90% of cases, and up to 30 at the extreme.
Trailing Stop, Breakeven, Price Target
Does a different exit change the picture? We tested a trailing stop (the stop moves with the price, 0.5% or 1.0% below the high reached so far), a breakeven rule (the stop jumps to the entry price once the gain reaches +0.5%), and a fixed price target at twice the risk.
| Exit rule | E1 | E2 | E3 |
|---|---|---|---|
| Hold to the close (main calculation) | −0.416% | −0.368% | −0.493% |
| Trailing stop 0.5% below the high | −0.418% | −0.369% | −0.514% |
| Trailing stop 1.0% below the high | −0.415% | −0.363% | −0.501% |
| Stop moved to the entry price from +0.5% | −0.420% | −0.370% | −0.500% |
| Target at twice the risk | −0.515% | −0.490% | −0.614% |
| Stop below the signal minute + 2:1 target | −0.462% | −0.373% | −0.570% |
Instead of holding to the close: trail the stop, move it up to the entry price once the trade is ahead, or sell at twice the gain. None of these rules turned the result around in the backtest. All figures are the trimmed average per stock trading day. Source: price data, own calculations.
No variant turned the result positive. The full trader's chain – stop one cent below the low of the signal minute, price target at twice the risk – stayed at −0.5704% per stock trading day in E3, positive in none of the four time periods. With the price-target exit alone, the share of winning days came to only 0.92% (E1), 0.72% (E2), and 0.42% (E3): the target was almost never reached in the backtest, because the stop triggered first.
And What If Trading Cost Nothing?
The most honest part of this study: calculated with no trading costs at all, the entry was slightly positive in the backtest for the US stocks we analysed – in all three families, in 16 of 16 years, and in 4 of 4 time periods. 21 of 45 gross variants tested cleared the pre-registered success bar.
| Cost per side | E1 | E2 | E3 |
|---|---|---|---|
| None at all (before costs) | +0.0357% | +0.0214% | +0.0467% |
| 0.02% + commission | −0.2159% | −0.1927% | −0.2536% |
| 0.05% + commission (main calculation) | −0.4164% | −0.3675% | −0.4934% |
| 0.10% + commission | −0.7503% | −0.6588% | −0.8928% |
| Per individual attempt · None at all (before costs) | +0.0148% Winners 3.38% |
+0.0122% Winners 3.31% |
+0.0132% Winners 3.40% |
| Per individual attempt · 0.05% + commission (main calculation) | −0.1332% Winners 3.33% |
−0.1332% Winners 3.27% |
−0.1299% Winners 3.33% |
The top row is the actual finding: without spread and without commission the recipe did earn something in the backtest — in all three entry rules, in 16 of 16 years and in all four time periods. A single round trip was about six times the size of that advantage. The four upper rows are the trimmed average per stock trading day, the two lower ones the calculation per individual attempt (gross the plain average, net the trimmed average); the second line of each cell gives the share of winners. Source: price data, own calculations.
The gross advantage of the flagship chain E2 came to +0.0214% per stock trading day in the backtest, +0.0122% per individual attempt (winner share 3.31% gross against 3.27% net). A single round trip cost 0.1255% in reality – about six times as much as this gross advantage. The advantage was therefore real, but far too small to cover the cost of a single round trip.
Does the Picture Split Anywhere?
Three obvious splits were additionally tested in the backtest: price level, trading turnover, and time periods. In none of them did the result turn positive.
Price Level
| Price level | E1 | E2 | E3 |
|---|---|---|---|
| USD 5 to 20 | −0.566% 756,168 days |
−0.470% 563,932 days |
−0.671% 827,173 days |
| USD 20 to 100 | −0.377% 1,841,963 days |
−0.340% 1,391,238 days |
−0.448% 2,049,378 days |
| Above USD 100 | −0.332% 492,506 days |
−0.318% 370,901 days |
−0.392% 555,114 days |
One cent is a tenth of a percent of the price on a 10-dollar stock and only a twentieth of that on a 200-dollar stock. On expensive stocks the result in the backtest was the least bad — but it was positive nowhere. Trimmed average per stock trading day. Source: price data, own calculations.
For expensive stocks, the loss in the backtest came out smallest – but it turned positive nowhere. The cent stop itself shifted along with it: one cent corresponded to 0.1% of the price on a 10-dollar stock, but only 0.005% on a 200-dollar stock – a twentieth of that.
Trading Turnover
| Turnover third | E1 | E2 | E3 |
|---|---|---|---|
| The thinnest third | −0.445% 1,021,887 days |
−0.378% 769,539 days |
−0.535% 1,131,264 days |
| The middle third | −0.406% 1,036,944 days |
−0.358% 780,597 days |
−0.479% 1,151,791 days |
| The most heavily traded third | −0.394% 1,031,806 days |
−0.364% 775,935 days |
−0.463% 1,148,610 days |
On every trading day the stocks are split into three equally large groups by trading turnover. Even in the most heavily traded third, where spreads are tightest, the result stayed clearly negative in the backtest. Trimmed average per stock trading day. Source: price data, own calculations.
Split by trading turnover, too, the picture changed little: the thinnest turnover third lost the most in the backtest (E2 −0.3777%), the most heavily traded third somewhat less (E2 −0.3637%) – the difference between the three thirds was small overall.
Time Periods
| Period | E1 | E2 | E3 |
|---|---|---|---|
| 2010–2015 | −0.412% | −0.356% | −0.493% |
| 2016–2019 | −0.418% | −0.371% | −0.492% |
| 2021–2023 | −0.422% | −0.376% | −0.495% |
| 2024–2026 | −0.410% | −0.367% | −0.492% |
Across 16 years the picture was practically unchanged. There was no era in which the recipe once worked: zero of four time periods and zero of 16 years were positive in all three entry rules. Trimmed average per stock trading day. Source: price data, own calculations.
Across 16 years and four time periods, the picture stayed practically unchanged: no period and no year was positive in any of the three families – 0 of 4 time periods, 0 of 16 years. There was no era in the backtest in which the recipe once held up.
The Short Mirror
As a control, the same rule was mirrored: a short sale, in which a stock is sold that must first be borrowed, to be bought back later. The sale happens on a breakout to the downside, and the stop sits one cent above it. The picture stayed the same in the backtest – the opposite direction did not hold up either.
| Stop distance | E1 short | E2 short | E3 short |
|---|---|---|---|
| One cent above the entry | −0.414% 3,080,983 days |
−0.369% 2,312,208 days |
−0.487% 3,427,254 days |
| One cent above the high of the signal minute | −0.345% 3,080,983 days |
−0.258% 2,312,208 days |
−0.393% 3,427,254 days |
| 0.05% above the entry | −0.391% 3,080,983 days |
−0.333% 2,312,208 days |
−0.459% 3,427,254 days |
| 0.10% | −0.367% 3,080,983 days |
−0.287% 2,312,208 days |
−0.417% 3,427,254 days |
| 0.25% | −0.295% 3,080,983 days |
−0.217% 2,312,208 days |
−0.312% 3,427,254 days |
| 0.50% | −0.214% 3,080,983 days |
−0.168% 2,312,208 days |
−0.220% 3,427,254 days |
| 1.00% | −0.145% 3,080,983 days |
−0.134% 2,312,208 days |
−0.144% 3,427,254 days |
| Wide (opening range or high of the day) | −0.143% 3,080,983 days |
−0.111% 2,312,208 days |
−0.145% 3,427,254 days |
| No stop at all | −0.097% 3,080,983 days |
−0.108% 2,312,208 days |
−0.098% 3,427,254 days |
| One cent, filled one cent worse | −0.522% 3,080,983 days |
−0.460% 2,312,208 days |
−0.613% 3,427,254 days |
| For comparison: random entry minute, one-cent stop | −0.482% 4,407,452 days |
||
The same setup, mirrored: the sale happens on the breakout to the downside, and the stop sits one cent above it. Important caveat: this calculation assumes that every stock can be borrowed at any time — with no borrowing fee and no recall. For exactly the stocks in which such moves happen, that is not true. These columns are a side calculation, not a tradable instruction. Source: price data, own calculations.
The flagship chain E2, as a short sale with a one-cent stop, lost −0.3688% per stock trading day in the backtest, barely different from the long result. Caveat that applies to this entire section: this calculation assumes that every stock can be borrowed at any time – with no borrow fee and no recall. In reality, that is exactly not true for the stocks in which such moves happen. The short mirror is a side calculation, not a tradable instruction.
The Pre-Registered Verdict
The bar was fixed before the first calculation. All three main cells and the full trader's chain in E3 were tested.
Success criterion (pre-registered): a cell "pays" if its trimmed average per stock trading day is greater than zero, the 95% bootstrap interval does not contain zero, and at least three of four time periods are positive. In addition, it must be better than the same entry with a wide stop and better than the same entry with no stop at all.
The pre-registered success criterion of this study, fixed before the first result figure.
| Family | Trimmed average |
95% range excludes zero? |
3 of 4 time periods positive? |
Better than a wide stop? |
Better than no stop? |
Verdict |
|---|---|---|---|---|---|---|
| E1 opening breakout | −0.416% | no | no (0 of 4) | no | no | does not pay |
| E2 high-of-day breakout | −0.368% | no | no (0 of 4) | no | no | does not pay |
| E3 pullback | −0.493% | no | no (0 of 4) | no | no | does not pay |
| E3 with a stop below the signal minute and a 2:1 target | −0.570% | no | no (0 of 4) | no | no | does not pay |
The bar was set before the first calculation: the recipe only “pays” if the trimmed average per trading day is above zero, the 95% range excludes zero and at least three of four time periods are positive — and if it is additionally better than the same entry with a wide stop and better than the same entry with no stop. None of the four candidates met even one of the five conditions. Source: price data, own calculations.
None of the four candidates met even a single one of the five conditions in this study: not E1, not E2, not E3, and not the full trader's chain in E3. The verdict was the same for all four: does not pay.
How the Calculation Was Done
The universe comprised 4,361 US stocks with a market capitalisation of at least USD 300 million at any month-end in 2020, including stocks that later disappeared from the ticker; 3,766 of them had at least one filtered trading day. Three filters applied per stock-day: an opening price of at least USD 5, a prior-day dollar volume of at least USD 5 million, and at least 300 one-minute candles per day. The calculation ran from 5 April 2010 to 5 August 2026, across 4,789,247 stock trading days and 944,744,286 individual trading attempts – commission USD 0.005 per share and side, capped at 0.5% of the trade value.
The calculation passed seven of eight pre-registered checks, none was failed – one was deliberately skipped.
| # | Check | Result | Evidence |
|---|---|---|---|
| 1 | Candle count 390/210 in regular trading hours | passed | One large US stock on 11 June 2024: 390 candles, slots 0 to 389; shortened day 24 November 2023: 210 candles. Across the run, 1,064,572 stock trading days had exactly 390 candles and 31,395 exactly 210. |
| 2 | Calendar of shortened days matches | passed | 34 shortened days stored, 34 in the series; none missing, none extra. Two independent methods both arrived at 34. |
| 3 | Hand calculation against the raw candles | passed | 210 attempts in one stock recalculated by hand one by one, 0 deviations. |
| 4 | Determinism (two runs bit-identical) | skipped | Deliberately skipped. The only one of the eight checks without evidence. |
| 5 | Cost monotonicity | passed | 20 rule chains checked across all four cost levels, 0 violations. |
| 6 | Stop monotonicity (tighter stop, stopped out more often) | passed | Six family/direction pairs checked across the whole stop ladder, 0 violations. |
| 7 | Cap on attempts per day respected | passed | Largest number of attempts per stock trading day across all chains: 30 (cap 30). 987,906 of 240,172,910 cases touched it (0.41%). |
| 8 | Fills only in minutes that actually have a candle | passed | 11,846 fills checked against the raw candles, 0 without a matching minute candle. |
7 of 8 checks passed, 1 deliberately skipped, none failed. The skipped check is named explicitly in the text. Source: price data, own calculations.
One internal inconsistency belongs in this report: a different internal file states "8 of 8 checks passed." That is not consistent with the underlying data – check 4, the determinism test with two independent runs, was deliberately not run and carries no evidence. For this study: 7 passed, 1 skipped, 0 failed.
Further honest caveats: on 160 of 4,789,247 stock trading days (0.0033%), an earlier one-minute candle substituted for the missing 15:59 close – at this small a share, that could not carry any result. 66,180,775 signals were discarded because their execution minute had no candle, and did not count as an attempt. The stock universe was assembled by 2020 market capitalisation; anyone trading in 2012 could not have known at the time which stocks would be large in 2020 – a known, deliberately accepted look-back that affects all three families equally. Not included are taxes, financing costs, and the market impact of a trader's own orders. And: one-minute candles do not know the order of events within the minute; for a fixed stop that made no difference, while the trailing variants used the more cautious rule of checking against the level of the previous minute first and only then adopting the new high.
What Remains
Across 162 pre-registered net variants, not a single one held up in the backtest: not the opening breakout, not the high-of-day breakout, not the pullback, not the full trader's chain, not the short mirror. The ultra-tight one-cent stop made the result worse in the backtest compared with a wide stop and compared with no stop at all, in every one of the 16 years in this study. Only gross, calculated with no trading costs at all, was the underlying entry slightly positive in the backtest – a real but tiny advantage that a single round trip of buying and selling already exceeded by roughly six times: 0.1255% in costs against +0.0214% in advantage. No scanner and no automated system follows from this study. Further pre-registered backtests in the same series – on the parabolic death cross and the parabolic reversal, both on 5-minute candles – are available in the study archive.
Note: This article is an analysis of historical prices, not investment advice and not a trading recommendation. Past results say nothing about the future. Trading costs, borrow fees, taxes, and the market impact of a trader's own orders can make real-world results substantially worse.
Frequently Asked Questions
No. Of 162 tested net variants, not a single one cleared the pre-registered success bar in the backtest – 0 of 162. The least bad variant, the high-of-day breakout E2 with a stop one cent below the entry, lost a trimmed average of −0.3675% per stock trading day in the backtest, with only 8.54% winning days. In none of the 16 years in this study was the result positive.
Dr. David Paul was a South African engineer who traded full-time from 1988 and taught banks and financial institutions; he died in 2023 at the age of 68. What is documented is his teaching of entering at the "danger point" — where the masses place their stops — with a stop outside the price traffic and a reward-to-risk ratio of at least 1:2. The one-cent stop is a widely repeated recipe attributed to him – not his documented own teaching.
Because the one-cent stop distance allowed only 0.0255% of price room at the typical entry price of USD 39.28 in the stocks in this study, while a full round trip of buying and selling cost 0.1255% in the backtest – 4.9 times as much. This cost gap decided the arithmetic before the price even moved.
The tighter, the worse: the stop ladder across all three entries was almost entirely monotonic in the backtest. For the E2 entry, the trimmed average came to −0.3675% per stock trading day with the one-cent stop, only −0.1366% with a 1.00% stop, and −0.1158% with no stop at all. The tightest stop in this study was also the most expensive.
That is exactly the core of the repeated recipe – and it made the result worse in the backtest with every additional attempt allowed. With at most one attempt allowed per day, the flagship chain E2 lost −0.1356% per stock trading day in the backtest; with the pre-registered cap of 5 attempts, already −0.3675%; unlimited up to 30 attempts, −0.4416%. Every further re-entry cost another full round trip.
Yes, barely. Calculated without any costs, 21 of 45 tested variants cleared the pre-registered success bar in the backtest, positive in all three entry families and in 16 of 16 years. The gross advantage of the flagship chain E2 came to +0.0214% per stock trading day – but a single round trip cost 0.1255% in reality, roughly six times as much. The theoretical advantage therefore vanished entirely into fees and spread.
Every rule – filters, entries, exits and the success bar – was fixed before the first calculation, documented with a timestamp. The calculation passed 7 of 8 pre-registered checks, including one stock recomputed by hand with no deviation; the determinism check with two independent runs was deliberately skipped. It rested on 944,744,286 individual trading attempts across 4,789,247 stock trading days, with the year 2020 excluded throughout.


