Insider Buying Backtest: 13.42% Against 14.01% — Almost No Lead Survives Costs
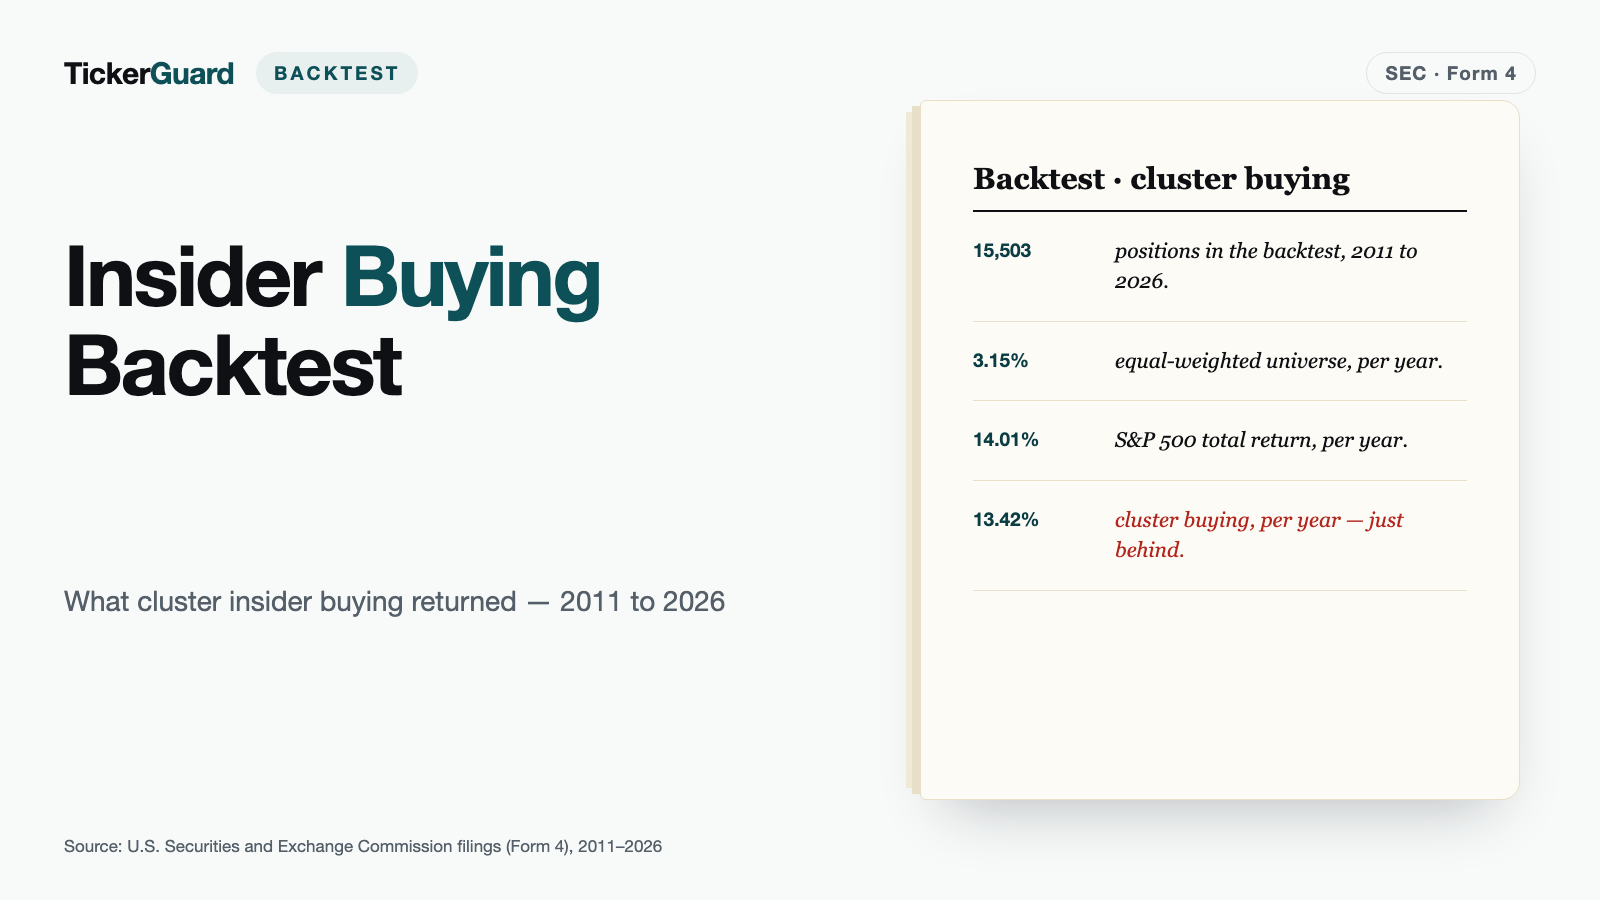
Insider cluster buying does not beat the S&P 500: 13.42% against 14.01% per year across 186 months. Before costs four of fifteen buy rows come out ahead, after costs two.
 Thomas Mücke
Founder & Publisher
Thomas Mücke
Founder & Publisher
The result in four numbers
- 13.42% per year is what the main recipe returned on a twelve-month hold, before costs.
- 14.01% is what the S&P 500 with dividends returned over exactly those months — so the recipe trails it.
- 3.15% is what the equal-weighted stock universe returned. Against blind spreading in the same pool, the signal wins clearly.
- 15.48% is what the same recipe returned in the smaller half of the companies insiders buy into — against 13.92% for the index over the same months. That lead survives even the strict cost assumption (14.33%); the main recipe's does not.
The question: do insiders act on what they know — and can anyone follow them?
Board members, chief financial officers and major shareholders know their company better than any outside analyst. When several of them independently buy their own stock within a short window, that has counted as an information-carrying signal since Lakonishok and Lee (2001) and Cohen, Malloy and Pomorski (2012) — with one important caveat from the same literature: buys carry information, sales barely do. A sale has many innocent reasons (diversification, buying a house, tax planning); a purchase with one's own money almost always expresses conviction.
This study tests that thesis against public filings mandated by the U.S. Securities and Exchange Commission (Form 4, which every insider must file after trading in their own company's stock). The rules were fixed before the first look at any result — that is the difference between a backtest and a search for the prettiest number.
- Signal (main arm "cluster"). At least two DIFFERENT filers at the same company buy at least $100,000 of their own stock on the open market within a rolling 30-day window. The company is then locked out of that arm for 30 days.
- Purchase. Equal-weighted — every position gets the same amount regardless of company size — on the first tradable day AFTER the signal date. Never on the signal date itself: filings arrive into the evening, and that day's close would not yet have seen the filing.
- Hold. Three, six or twelve months, fixed. No exit signal, no averaging in.
- Track. "Track" here means: the same signals, booked differently. The headline figure is the conservative track — excluding positions whose monthly jump is suspected of carrying an unrecorded capital restructuring (a share split or reverse split missing from the price series). The full track sits alongside, and it demonstrates why the filter is needed: on it broken price series lift the main arm's six-month return from 13.70% to 52.67%.
- Benchmarks. The S&P 500 Total Return (dividends included) and an equal-weighted universe of all tradable US names — both always computed over EXACTLY the months of the row they sit beside.
- Return per year. Compounded geometrically from the portfolio's monthly returns — months are multiplied, not added, or a month of −50% and one of +50% would appear to cancel out — and annualised — not the average of the individual positions. Both benchmarks are computed identically, from the same months.
How it was measured: the data, the six arms, the counter-checks
The starting point is every insider buy and sale reported to the SEC from 2006 to 2026: 4,344,670 filing rows (1,242,498 buys, 3,102,172 sales) across all 82 of 82 quarters, matched through 20,869 ticker assignments and 12,391 issuers — the companies whose stock was traded. Out of those come 238,552 signals across six pre-registered arms.
One quirk of the filing format had to be settled before anything was computed: the same transaction can be reported by several filers at once — by a fund, its management company and the manager personally. The raw data then carries the same share count several times over. Measured, 46.4% of all buy rows are affected, so the signal sum counts each combination of filing, trade date, share count and price exactly ONCE. The buyer count, by contrast, counts filers — that is how it was pre-registered, and the consequence is stated openly in the limits below.
Why a second benchmark sits beside the index: insiders buy mostly in small companies. An equal-weighted portfolio of every tradable US name beats the S&P 500 all by itself in some decades — measuring only against the index confuses "the signal carries" with "small names did well". The universe holds every name whose two month-end prices come from days with actual turnover; months with an obviously broken price drop out. That it returns only 3.15% per year over this window is the equal weighting at work: the mass of thousands of small names counts as much here as the few large ones that carry the index.
The six arms — the name used here for the rule variants computed side by side — all run on the same 30-day window and the same 30-day lockout. The short codes in brackets are the internal run identifiers of the data set and are German; they appear in the tables so every figure can be traced back to its source row:
- cluster — the main recipe: at least two filers, at least $100,000 combined.
- chef — the same cluster rule, but only purchases by CEOs and CFOs count.
- chef1 — a SINGLE purchase by a CEO or CFO of at least $100,000. Two chiefs of the same company buying within 30 days is rare — across the whole 2006-onward data set the cluster arm "chef" therefore reaches only 4,621 signals, this one 12,707.
- einzel250 — a single transaction of at least $250,000, by anyone.
- cluster_opp — the cluster rule without routine buyers: anyone buying in a calendar month in which they already bought in an earlier year no longer counts. That is the line between a savings plan and a decision, as proposed by Cohen, Malloy and Pomorski.
- s_cluster — the same cluster rule on SALES. Not a footnote, but the control the whole study hangs on.
Three counter-checks ran across the finished data, each expecting a zero rather than a "few":
- No look into the future. Across 297,838 positions — every one in the data, spanning the six arms and the five sensitivity variants — not one entry falls on or before its signal date: 0 violations.
- Independent rebuild. 1,000 randomly drawn signals were recomputed purely from their member filing rows — window rule, sum rule, buyer count, signal date — and matched the stored value in 1,000 of 1,000 cases. Deviations: 0.
- Lockout. Across 325,878 consecutive signal pairs — each pair two neighbouring signals of the same issuer in the same arm, over the whole data set: 0 violations.
On top of that, 6 positions were checked by hand end-to-end against the original filings on sec.gov (BSRR, NRF, NVRO, NEOS, FLNC, TRN) — trade date, share count and per-share price of every member filing, the entry date against the trading calendar, the return recomputed from entry and exit price. All 6 matched.
The headline result: clearly ahead of chance, narrowly short of the index
The table below shows all six arms across three holding periods on the conservative track. "Median held" is the number of positions open at once in the median month — it sits beside every return on purpose, because a month with three open positions produces a monthly return no human could have collected.
Why the position count shrinks with the holding period: a position needs its full holding period inside the data. An entry in the final year of the window still has three months, but no longer twelve — hence 16,347 positions at three months, 16,057 at six and 15,503 at twelve.
Two reading notes for this table. *Median held counts ALL positions of the arm, including those the conservative filter removes from the return; on the conservative subset of the main arm it is 1,081 rather than 1,116. And the month count: the portfolio runs over 187 monthly steps from January 2011, while the benchmarks run over the 186 months from February 2011 for which both series exist. The first portfolio month has no benchmark yet and stays out of the comparison.
| Arm | Hold | p.a. conservative | Positions | Median held* | S&P 500 TR | Universe |
|---|---|---|---|---|---|---|
| main recipe (cluster) | 3 months | 14.10% | 16,347 | 342 | 14.01% | 3.15% |
| main recipe (cluster) | 6 months | 13.70% | 16,057 | 607 | 14.01% | 3.15% |
| main recipe (cluster) | 12 months | 13.42% | 15,503 | 1,116 | 14.01% | 3.15% |
| cluster among CEO/CFO (chef) | 3 months | 16.07% | 2,394 | 49 | 14.01% | 3.15% |
| cluster among CEO/CFO (chef) | 6 months | 13.88% | 2,345 | 86 | 14.01% | 3.15% |
| cluster among CEO/CFO (chef) | 12 months | 14.35% | 2,242 | 153 | 14.01% | 3.15% |
| single CEO/CFO buy from $100,000 (chef1) | 3 months | 12.26% | 6,940 | 151 | 14.01% | 3.15% |
| single CEO/CFO buy from $100,000 (chef1) | 6 months | 11.21% | 6,786 | 263 | 14.01% | 3.15% |
| single CEO/CFO buy from $100,000 (chef1) | 12 months | 11.41% | 6,494 | 486 | 14.01% | 3.15% |
| single buy from $250,000 (einzel250) | 3 months | 11.83% | 13,854 | 305 | 14.01% | 3.15% |
| single buy from $250,000 (einzel250) | 6 months | 11.53% | 13,515 | 550 | 14.01% | 3.15% |
| single buy from $250,000 (einzel250) | 12 months | 11.65% | 12,965 | 996 | 14.01% | 3.15% |
| cluster without routine buyers (cluster_opp) | 3 months | 14.82% | 12,352 | 257 | 14.01% | 3.15% |
| cluster without routine buyers (cluster_opp) | 6 months | 13.99% | 12,131 | 458 | 14.01% | 3.15% |
| cluster without routine buyers (cluster_opp) | 12 months | 13.91% | 11,716 | 849 | 14.01% | 3.15% |
| control: the same rule on sales (s_cluster) | 3 months | 8.75% | 85,117 | 1,857 | 14.01% | 3.15% |
| control: the same rule on sales (s_cluster) | 6 months | 10.21% | 83,622 | 3,189 | 14.01% | 3.15% |
| control: the same rule on sales (s_cluster) | 12 months | 11.31% | 80,812 | 5,832 | 14.01% | 3.15% |
The ordering is clear once read correctly. Every single buy arm beats the equal-weighted stock universe decisively — by 8.06 to 12.92 percentage points. Percentage points, abbreviated "pp" in the tables, are the gap between two percentages. Against the S&P 500 with dividends, though, only four of the fifteen buy rows come out ahead: the CEO/CFO cluster at three months (16.07%) and at twelve months (14.35%), the arm without routine buyers at three months (14.82%), and the main recipe itself at three months (14.10% against 14.01%) — by a hair. At six and twelve months it trails at 13.70% and 13.42%.
All four leads are BEFORE costs. Count the trading fee and two survive, both at the CEO/CFO cluster (15.14% at three months, 14.12% at twelve). The arm without routine buyers falls from 14.82% to 13.91% and thus below the index; the main recipe falls from 14.10% to 13.19% at three months, because turning the book over four times a year costs 0.91 percentage points there. At twelve months the deduction is a small 0.23 points — the return still stays below the index.
That is the honest headline of this study: insider cluster buying is a robust signal against spreading bets blindly across the same stock pool — as a recipe that beats the broad market, the main recipe alone falls short.
What the comparison with the index leaves out: risk
Two series with the same annual return hurt differently. So beside every return this study now states how much it swung and how far it fell — on the conservative track, against the index from the same months. The swing is the spread of the monthly returns, annualised; the largest drawdown measures from the highest point of the portfolio curve to the lowest point after it.
| Arm | Hold | Swing p.a. | Swing S&P 500 | Largest drawdown | Largest drawdown S&P 500 |
|---|---|---|---|---|---|
| main recipe (cluster) | 3 months | 16.24% | 14.14% | −27.97% | −23.93% |
| main recipe (cluster) | 6 months | 17.57% | 14.14% | −31.01% | −23.93% |
| main recipe (cluster) | 12 months | 19.02% | 14.14% | −31.71% | −23.93% |
| cluster among CEO/CFO (chef) | 3 months | 18.23% | 14.14% | −27.10% | −23.93% |
| cluster among CEO/CFO (chef) | 6 months | 19.32% | 14.14% | −29.72% | −23.93% |
| cluster among CEO/CFO (chef) | 12 months | 20.81% | 14.14% | −31.46% | −23.93% |
| single CEO/CFO buy from $100,000 (chef1) | 3 months | 16.92% | 14.14% | −26.72% | −23.93% |
| single CEO/CFO buy from $100,000 (chef1) | 6 months | 18.37% | 14.14% | −31.96% | −23.93% |
| single CEO/CFO buy from $100,000 (chef1) | 12 months | 20.19% | 14.14% | −33.80% | −23.93% |
| single buy from $250,000 (einzel250) | 3 months | 16.42% | 14.14% | −28.53% | −23.93% |
| single buy from $250,000 (einzel250) | 6 months | 17.94% | 14.14% | −32.89% | −23.93% |
| single buy from $250,000 (einzel250) | 12 months | 19.26% | 14.14% | −33.18% | −23.93% |
| cluster without routine buyers (cluster_opp) | 3 months | 16.73% | 14.14% | −29.75% | −23.93% |
| cluster without routine buyers (cluster_opp) | 6 months | 18.11% | 14.14% | −33.74% | −23.93% |
| cluster without routine buyers (cluster_opp) | 12 months | 19.47% | 14.14% | −34.13% | −23.93% |
| control: the same rule on sales (s_cluster) | 3 months | 13.60% | 14.14% | −26.60% | −23.93% |
| control: the same rule on sales (s_cluster) | 6 months | 15.66% | 14.14% | −29.84% | −23.93% |
| control: the same rule on sales (s_cluster) | 12 months | 16.77% | 14.14% | −30.17% | −23.93% |
The picture is unambiguous and it runs against the signal: every buy arm swings harder than the index at every holding period, and every one of them fell further at some point. The main recipe at twelve months shows a swing of 19.02% against 14.14% for the index, and a largest drawdown of −31.71% against −23.93%. Reading 13.42% against 14.01% therefore means not just a lower return, but a lower return with markedly more movement. No confidence interval — the range the true value probably falls in, given this many months — is given for these gaps; at roughly one percentage point of difference over 186 months, how much of it is chance remains open.
The control check: buys carry information, sales barely do
The "s_cluster" arm applies exactly the same rule — two filers, 30 days, $100,000 — to insider SALES. If the sell arm carried a return similar to the buy arm, this study would be measuring attention rather than conviction: every insider filing moves the price a little, whichever way it points. Without this counter-check the buy-side finding could not be interpreted at all.
| Hold | cluster (buys) | Positions | s_cluster (sales) | Positions | Gap |
|---|---|---|---|---|---|
| 3 months | 14.10% | 16,347 | 8.75% | 85,117 | 5.35 pp |
| 6 months | 13.70% | 16,057 | 10.21% | 83,622 | 3.49 pp |
| 12 months | 13.42% | 15,503 | 11.31% | 80,812 | 2.11 pp |
The gap is positive at every hold and widest at the shortest one — exactly the pattern that arises when buys carry fresh information and that information has its strongest effect in the first months. It confirms the finding of Lakonishok/Lee (2001) and Cohen/Malloy/Pomorski (2012) on an independently computed data set. Note the size of the control arm: it carries 80,812 positions, more than five times the buy arm, because insiders sell far more often than they buy (3,102,172 reported sale rows against 1,242,498 buy rows).
Who beats the market: small companies and large purchases
For 14,646 of 17,217 cluster positions with an entry (85.07%), market capitalization on the purchase date could be determined — from the share count already filed on that day, not retroactively from today's figure. Measured against all 26,200 signals of the arm, that is 55.90%. The median market cap is $719 million, the median purchase share 0.053% of market cap — a cluster buy is therefore typically half a per mille of the company.
Both splits — at the median market cap and at the median purchase share — are in the pre-registered plan; they are not a cut invented afterwards. "Pre-registered" here means: the rule book was fixed as a dated document before the first figure was computed, and was not touched afterwards. One caveat belongs in front of them: the subset with a known market cap alone already returns 14.03% against 13.42% for the whole arm. Part of the small half's lead is therefore selection rather than size — the fair comparison is against those 14.03%, not against the 13.42%.
Every row carries the benchmark from its own months. Within a row it is the same for all three holding periods, because a subset spans the same months across all of them:
| Half | 3 months | 6 months | 12 months | S&P 500 TR | Universe | Median held | Portfolio months |
|---|---|---|---|---|---|---|---|
| companies below the median market cap | 16.86% | 17.07% | 15.48% | 13.92% | 2.86% | 467 | 184 |
| companies above the median market cap | 11.83% | 11.63% | 11.75% | 14.01% | 3.15% | 444 | 187 |
| purchase small relative to the company | 12.28% | 12.57% | 12.42% | 14.01% | 3.15% | 436 | 187 |
| purchase large relative to the company | 17.15% | 17.05% | 15.88% | 14.01% | 3.15% | 475 | 187 |
| all with a known market cap (base) | 14.61% | 14.84% | 14.03% | 14.01% | 3.15% | 904 | 187 |
Those rows survive the strict yardstick too: applying to the small half the 0.5% per side this study proposes for such names, 15.48% becomes 14.33% — against 13.92% for the index. It is bought with more movement: a swing of 20.77% and a largest drawdown of −30.99%.
The edge sits in two places at once: at smaller companies, where an insider purchase reveals more about the inside view, and at purchases that are — relative to company size — large enough to be more than a symbolic gesture. Both of those halves beat their index; the opposite half in each split trails it. Anyone who wants to use the signal therefore has to look more closely than "insiders bought."
Sensitivities: no threshold rescues the finding
Three dials were turned one at a time — the width of the time window, the minimum sum, and the number of different filers required. Each variant is its own run with its own signals; the main run is never overwritten, because otherwise a sensitivity would stop being a counter-check and become a threshold quietly tuned after the fact.
| Variant | Window | Minimum sum | Filers | Signals 2006–2026 | Positions | p.a. | S&P 500 TR |
|---|---|---|---|---|---|---|---|
| main recipe (cluster) | 30 days | $100,000 | 2 | 36,921 | 15,503 | 13.42% | 14.01% |
| tighter window, 14 days (cluster_f14) | 14 days | $100,000 | 2 | 33,373 | 14,219 | 13.45% | 14.01% |
| wider window, 60 days (cluster_f60) | 60 days | $100,000 | 2 | 43,025 | 17,662 | 13.53% | 14.01% |
| lower minimum sum (cluster_s50) | 30 days | $50,000 | 2 | 44,452 | 17,546 | 13.72% | 14.01% |
| higher minimum sum (cluster_s250) | 30 days | $250,000 | 2 | 26,137 | 11,626 | 12.72% | 14.01% |
| third filer required (cluster_i3) | 30 days | $100,000 | 3 | 23,704 | 9,665 | 13.55% | 14.01% |
The range across all five variants runs from 12.72% to 13.72% — tightly clustered around the main recipe, and none of the thresholds closes the gap to the S&P 500 (14.01%). The direction is worth noting: the TIGHTER minimum of $250,000 produces the worst result at 12.72%, the LOOSER one of $50,000 the best at 13.72%. More money in the cluster does not mean more information. The signal is thus robust to its own definition — and unfortunately so is its shortfall against the index.
Subsets: Covid, price errors, lucky trades
Six further control runs test what the twelve-month finding depends on. They run without a new calculation on the same positions, only cut differently — and again with the benchmark from their own months:
| Subset | 3 months | 6 months | 12 months | S&P 500 TR | Universe | Median held | Portfolio months |
|---|---|---|---|---|---|---|---|
| main run (base) | 14.10% | 13.70% | 13.42% | 14.01% | 3.15% | 1,081 | 187 |
| directly held shares only | 14.50% | 14.08% | 13.55% | 14.01% | 3.15% | 588 | 187 |
| excluding entries 2020–2022 | 12.21% | 14.17% | 16.78% | 16.34% | 7.24% | 999 | 167 |
| excluding signals with a suspect price field | 14.19% | 13.77% | 13.50% | 14.01% | 3.15% | 1,074 | 187 |
| excluding the best position | 14.06% | 13.66% | 13.39% | 14.01% | 3.15% | 1,081 | 187 |
| excluding the three best positions | 13.98% | 13.59% | 13.33% | 14.01% | 3.15% | 1,081 | 187 |
| excluding the five best positions | 13.94% | 13.54% | 13.30% | 14.01% | 3.15% | 1,081 | 187 |
Three findings matter most here.
First: the Covid years pull in different directions depending on the holding period — and over the short ones they CARRIED the finding. Dropping the entries from March 2020 to December 2022 lifts the twelve-month return from 13.42% to 16.78%. That looks like a clear win and is not one: over exactly those 167 months the S&P 500 also rose more than over the full window (16.34% instead of 14.01%), so the adjusted lead is 0.44 percentage points rather than the 2.77 pp a comparison against the full window would suggest.
At three and six months the sign flips. Without the Covid entries, 12.21% (three months) and 14.17% (six months) are left — against the same benchmark of 16.34% that is −4.13 pp and −2.17 pp versus the index. Over the full window the same rows stand at +0.09 pp and −0.31 pp. The narrow three-month lead of the main recipe (14.10% against 14.01%) therefore exists ONLY because of the Covid entries — anyone deriving a rule from this study should not count it.
Second: the finding does not hang on a handful of lucky trades. Without the single best position the return falls to 13.39%, without the best three to 13.33%, without the best five to 13.30% — 0.12 percentage points in total. A result that hung on five positions out of 15,503 would be no result at all; this one is broadly carried.
Third: the known data error in the price field changes nothing. In some filings the per-share price field carries the total amount instead — the reported value is then off by orders of magnitude. 254 of the 26,200 cluster signals inside the calculated window are affected. They are still not filtered out, because a plausibility limit introduced after the fact would be exactly the kind of degree of freedom a backtest must not have; the median is used instead of the mean, which a single outlier cannot move. The subset without those signals shows it does not matter: 13.50% instead of 13.42%.
What happened to positions that vanished
Any position whose price series ends during the holding period is force-sold at the last quoted price on the conservative track, and booked at minus 100% on the total-loss track. Which of the two readings is closer to reality cannot be read off the price data — it only knows that the series ends. So 30 randomly drawn forced sales from the main arm were checked by hand against the filing history at the U.S. Securities and Exchange Commission: delisting, deregistration, merger, tender offer — plus the ticker that company identifier trades under today.
| What actually happened | Cases | Share |
|---|---|---|
| Acquisition (merger or tender offer completed) | 12 | 40.00% |
| Fund wind-down at net asset value | 3 | 10.00% |
| Artifact: company kept trading under a different ticker | 14 | 46.67% |
| Artifact: price series ends without a corporate event | 1 | 3.33% |
| Bankruptcy | 0 | 0.00% |
Not one of the 30 forced sales checked was a bankruptcy. Half of them are artifacts: the company kept trading under a different ticker (14 cases) or the price series ended technically without any corporate event (1 case). The ticker-change detection only finds a successor when it is linked in the price data under the same company identifier — in those 14 cases it was not. 12 of the 30 cases were completed acquisitions, settled in cash or in stock, and 3 were closed-end fund wind-downs at net asset value.
From that follows a classification that holds for the studies in this series built on the same price data: the total-loss track is not a cautious reading but an artificial floor — it books a loss in half its cases that provably never happened. That is why it is nowhere a headline figure here.
How many signals were tradable at all
A number backtests like to leave out: how many of the signals found could be turned into a position at all? A signal is discarded when no price series exists for the ticker, when the name was not tradable on the entry day, when the series carries an obvious data error, or when an unrecorded capital restructuring is involved.
| Arm | Signals in window | no price series | not tradable | data error | capital restructuring | usable | Share |
|---|---|---|---|---|---|---|---|
| main recipe (cluster) | 26,200 | 5,515 | 3,468 | 500 | 114 | 16,603 | 63.37% |
| cluster among CEO/CFO (chef) | 3,468 | 606 | 336 | 77 | 7 | 2,442 | 70.42% |
| single CEO/CFO buy from $100,000 (chef1) | 9,843 | 1,832 | 732 | 154 | 41 | 7,084 | 71.97% |
| single buy from $250,000 (einzel250) | 21,045 | 4,650 | 1,717 | 429 | 110 | 14,139 | 67.18% |
| cluster without routine buyers (cluster_opp) | 19,762 | 4,298 | 2,389 | 433 | 88 | 12,554 | 63.53% |
| control: the same rule on sales (s_cluster) | 96,915 | 6,672 | 2,520 | 876 | 468 | 86,379 | 89.13% |
For the main arm that leaves 16,603 of 26,200 signals, or 63.37%. The largest single item is signals without a price series in the data; which names those are in detail is not something this study establishes. That is not a calculation error but a limit on the claim: the finding holds for the tradable part of the insider universe, not for every reported cluster. The figures read like this: 26,200 signals inside the window, 16,603 of them usable. The 17,217 positions in the market-cap chapter are a different count — they also include the cases with a data error or a capital restructuring, which had a price series and therefore carry a market cap, but drop out of the return.
Costs
The measurement itself runs without costs: there is no cash account, no order and no position size. Applied is the convention used across this series' sister studies — 0.1% per side, or 0.2% per full round trip, multiplicatively on capital. At a fixed holding period the number of round trips is exact: three months is four round trips a year, twelve months one.
| Hold | Round trips p.a. | Factor | Deduction cluster | Deduction s_cluster |
|---|---|---|---|---|
| 3 months | 4.0 | 0.992028 | 0.91 pp | 0.87 pp |
| 6 months | 2.0 | 0.996006 | 0.45 pp | 0.44 pp |
| 12 months | 1.0 | 0.998001 | 0.23 pp | 0.22 pp |
Not included are taxes, the bid-ask spread — the gap between the price you can buy at and the price you can sell at, lost on every entry and exit — and the market impact of one's own purchases. The spread in particular would be noticeable on the small names insiders mostly buy — the jump-price study in this series applies 0.5% per side to comparable names and itself describes that as deliberately set too high. Anyone reading this study strictly should multiply the deduction by five.
Honest limits of this calculation
- Period: 2011 instead of 2006. Filing data is fully loaded from 2006 (4,344,670 rows across all 82 of 82 quarters), but the calculation starts on January 1, 2011. The reason is the price data: it begins on April 1, 2010, and the nine months after that are a warm-up so no position is measured against a series that begins at the edge of the data. 111,405 signals — counted across all arms and sensitivity variants — fall before the calculated window and feed into no return; they are loaded anyway so window and lockout rules apply correctly from the start.
- The buyer count counts filers, not economic buyers. When a fund, its management company and the manager personally all report the same purchase, that is three filers and therefore formally a cluster, even though economically one party bought. Part of the cluster signals are therefore clusters of filing form rather than of conviction. That is how it was pre-registered, and it stays that way — changing the count afterwards would mean fitting the rule to its result.
- No portfolio anyone could replicate. The main arm holds 1,116 positions at once in the median month (twelve-month hold), and 23 in the thinnest. That is a signal measurement — a statement about whether the rule works on average — not a portfolio a single investor could build.
- The total-loss track is an artificial floor, not a second, equally weighted answer (see above).
- Faulty price fields are measured, not filtered. Because a plausibility limit was not pre-registered, the study works with the robust median rather than the error-sensitive mean. The subset without the affected signals shows the choice does not matter.
- No live tool. The filing data behind this backtest arrives as quarterly data sets — good enough for a retrospective, too slow for a signal that wants to buy the day after the filing. This study therefore deliberately produces no scanner. Once a continuously updated filing stream exists, that can be revisited.
- No confidence intervals, no correction for multiple comparisons. The study shows fifteen buy rows, five threshold variants and twelve cuts. With that many views, one of them almost always comes out ahead. Gaps of roughly one percentage point over 186 months cannot be told apart from chance without a confidence interval — none is given, and the thinnest arm shows why that matters: the CEO/CFO cluster jumps from 16.07% to 13.88% and back to 14.35% across the holding periods, on only 2,242 positions.
- The small half's lead may be a size premium. It is measured against the S&P 500, an index of large companies. Part of the 15.48% may not be the insider signal at all, but simply the return of small companies over this period. The comparison with the equal-weighted universe argues against that, but proves nothing.
- The two splits are not independent. A purchase is usually large relative to the company precisely when the company is small. The study does not compute the intersection — "in two places" here means two views, not two pieces of evidence.
- A backtest is not a forecast. This study is market research, not investment advice, and not a buy recommendation for any individual stock.
Conclusion
Insider cluster buying is no miracle signal, but it is not a failure either. Buying companies where at least two insiders acquired at least $100,000 of their own stock combined within 30 days beat spreading bets blindly across the same stock pool clearly across 186 months — at every tested holding period and under every tested definition. Against the S&P 500 the unsplit main recipe falls short: 13.42% against 14.01% at twelve months, and the narrow three-month lead disappears once costs are counted.
The real finding lies in the differentiation — and it stands before costs. At smaller companies and at purchases that are large relative to company size, the same signal sits above its index at every holding period; at CEO and CFO buying it does so at three and at twelve months. After the trading fee two of the fifteen buy rows remain above the index, and under the stricter deduction none of them. The smaller half of the cluster companies survives even that deduction (14.33% against 13.92%). And the control check on insider sales confirms what this is really about: buys carry information, sales barely do — exactly the finding academic literature has described for over two decades. As a simple, unmodified market-beating recipe, the signal still falls short.
Sources. Insider filings from the mandatory public disclosures of the U.S. Securities and Exchange Commission (Form 4, quarterly data sets). Price series, share counts and the S&P 500 Total Return benchmark from our own data, carried over unchanged from the sister studies in this series — for instance the down-day strength backtest.
Frequently Asked Questions
A signal fires when at least two different filers at the same company buy at least $100,000 of their own stock combined on the open market within a rolling 30-day window. Purchases are equal-weighted on the first tradable day AFTER the signal date, never on the signal date itself. After a signal the company is locked out of the same arm for 30 days so one wave of buying is never counted twice. Holds are three, six or twelve months; costs are set at 0.1% per side.
Only in places. Against the equal-weighted stock universe (3.15% per year) every one of the five buy arms wins clearly, by 8.06 to 12.92 percentage points. Against the S&P 500 with dividends (14.01%) four of the fifteen buy rows come out ahead BEFORE COSTS: the CEO/CFO cluster at three months (16.07%) and at twelve months (14.35%), the arm without routine buyers at three months (14.82%), and the main recipe itself at three months (14.10%) — by a hair. After the trading fee two are left: 15.14% and 14.12% at the CEO/CFO cluster. The arm without routine buyers drops to 13.91% and the main recipe to 13.19%, both below the index. Under the stricter deduction this study itself proposes for small names (0.5% per side), none of those fifteen rows beats the index. The smaller half of the cluster companies does survive it: 15.48% becomes 14.33% against 13.92% for the index.
In the smaller half of the companies insiders buy into, and among the larger purchases — both before costs. Splitting positions at the median market cap of $719 million, the small half returns 15.48% per year; the S&P 500 returned 13.92% over exactly those months, the large half 11.75%. Splitting at the median purchase share of 0.053% of market cap, the half with the relatively larger purchases returns 15.88% and the half with the smaller ones 12.42%; the index sits at 14.01% here. The two splits are not independent, though: a purchase is usually large relative to the company precisely when the company is small. The study does not compute the intersection — these are two views of one finding, not two pieces of evidence.
Because a sale has many innocent reasons — diversification, buying a house, tax planning — while a purchase with one's own money almost always expresses conviction. The control check confirms this numerically: the same cluster rule applied to sales returns 8.75% (three months), 10.21% (six months) and 11.31% (twelve months), leaving it 5.35, 3.49 and 2.11 percentage points below the matching buy arm. The gap is widest at the shortest hold — exactly what fresh information produces.
On the main track they are force-sold at the last quoted price. To find out what was behind them, 30 randomly drawn cases were checked by hand against the filing history at the U.S. Securities and Exchange Commission: 12 were completed acquisitions, 3 were closed-end funds wound down and paid out at the value of their holdings, 15 were technical artifacts (14 times the company kept trading under a different ticker, once the price series simply ended without any corporate event) — and not a single case was a bankruptcy. The alternative total-loss calculation is therefore not a cautious reading but an artificial floor.
Because the price history used begins on April 1, 2010. The nine months after that are a warm-up so no position is measured against a series that has only just begun at the edge of the data. Filing data from 2006 onward is still loaded in full so lockout and window rules apply correctly from the start. 111,405 signals fall before the calculated window and feed into no return.
Because the platform has no continuously updated stream of new insider filings. The filing data behind this backtest comes as quarterly data sets from the U.S. Securities and Exchange Commission — good enough for a retrospective, too slow for a signal that wants to buy the day after the filing. This study is therefore a pure retrospective with no accompanying tool.
The median number of positions held at once in the main arm is 1,116 — a signal measurement, not a portfolio anyone could replicate. Of 26,200 cluster signals inside the window only 16,603 (63.37%) were tradable at all. The buyer count counts FILERS, not economic buyers: when three affiliated entities report the same purchase, the cluster condition is met on form. Taxes and the bid-ask spread are not modeled, even though the spread in particular would be noticeable on the small, insider-heavy names in this study. And the study reports no confidence intervals: gaps of roughly one percentage point over 186 months cannot be told apart from noise.


