Down-Day Strength Backtest: Best Portfolio Returns 9.80% Against the Index's 14.27%
Stocks that stay green on trading days when both the broad market and their own industry close sharply lower — is that a reliable buy signal? The idea comes from US investor Ben Bennett; we built it into our own metric, Down-Day Strength, and tested it across 181 month-end dates (June 2011 through June 2026, 897,326 rating rows). The result is honestly negative: the mean and the median contradict each other, the typical stock in the top decile lags behind, and the edge turns negative exactly during downturns. The best portfolio returns 9.80% a year against 14.27% for the S&P 500 — no single variant beats the index.
 Thomas Mücke
Founder & Publisher
Thomas Mücke
Founder & Publisher
The question: is strength on bad days a buy signal?
Some stocks barely flinch on bad market days — while the rest of the board turns red, they stay green. The idea of measuring that systematically comes from US investor Ben Bennett. We built our own metric on top of it: Down-Day Strength (Stress-RS). A down day is a trading day on which both the broad market and a stock's own industry closed down at least 0.5% on a median basis. Over roughly the trailing six months (126 trading days) we count how many of those down days a stock still closed green, and convert that into a percentile rating from 1 to 99 within the universe. Our live scanner, listed as "Strength on Stress Days", shows the strongest roughly 10% — stocks with a rating of 90 or above, a price above $3, and sufficient dollar volume.
Does that strength actually hold up, or is it just a rear-view mirror effect? We tested it across 181 month-end dates — June 2011 through June 2026, on US stocks including delisted ones. Every headline figure in the tables below comes in four readings: the mean (arithmetic, sensitive to individual outliers), the median (the typical, middle case), a trimmed mean (outliers clipped on both sides), and a conservative figure (a position whose price series ends before the horizon counts as a total loss). As the next section shows, the median is the more honest number for this metric — because the top decile contains a handful of extreme winners that pull the mean far above what the typical stock actually delivers.
The result in four numbers
In hindsight, was a high Down-Day Strength rating a reliable buy signal? We tested it across 181 month-end dates (June 2011 through June 2026) on US stocks. Four numbers carry the result:
- 9.80% a year is what the best portfolio in the whole study returned — top decile with an exit as soon as the rating drops below 50, after costs. The S&P 500 Total Return returned 14.27% over those same 181 months; none of the sixteen tested portfolio variants came close.
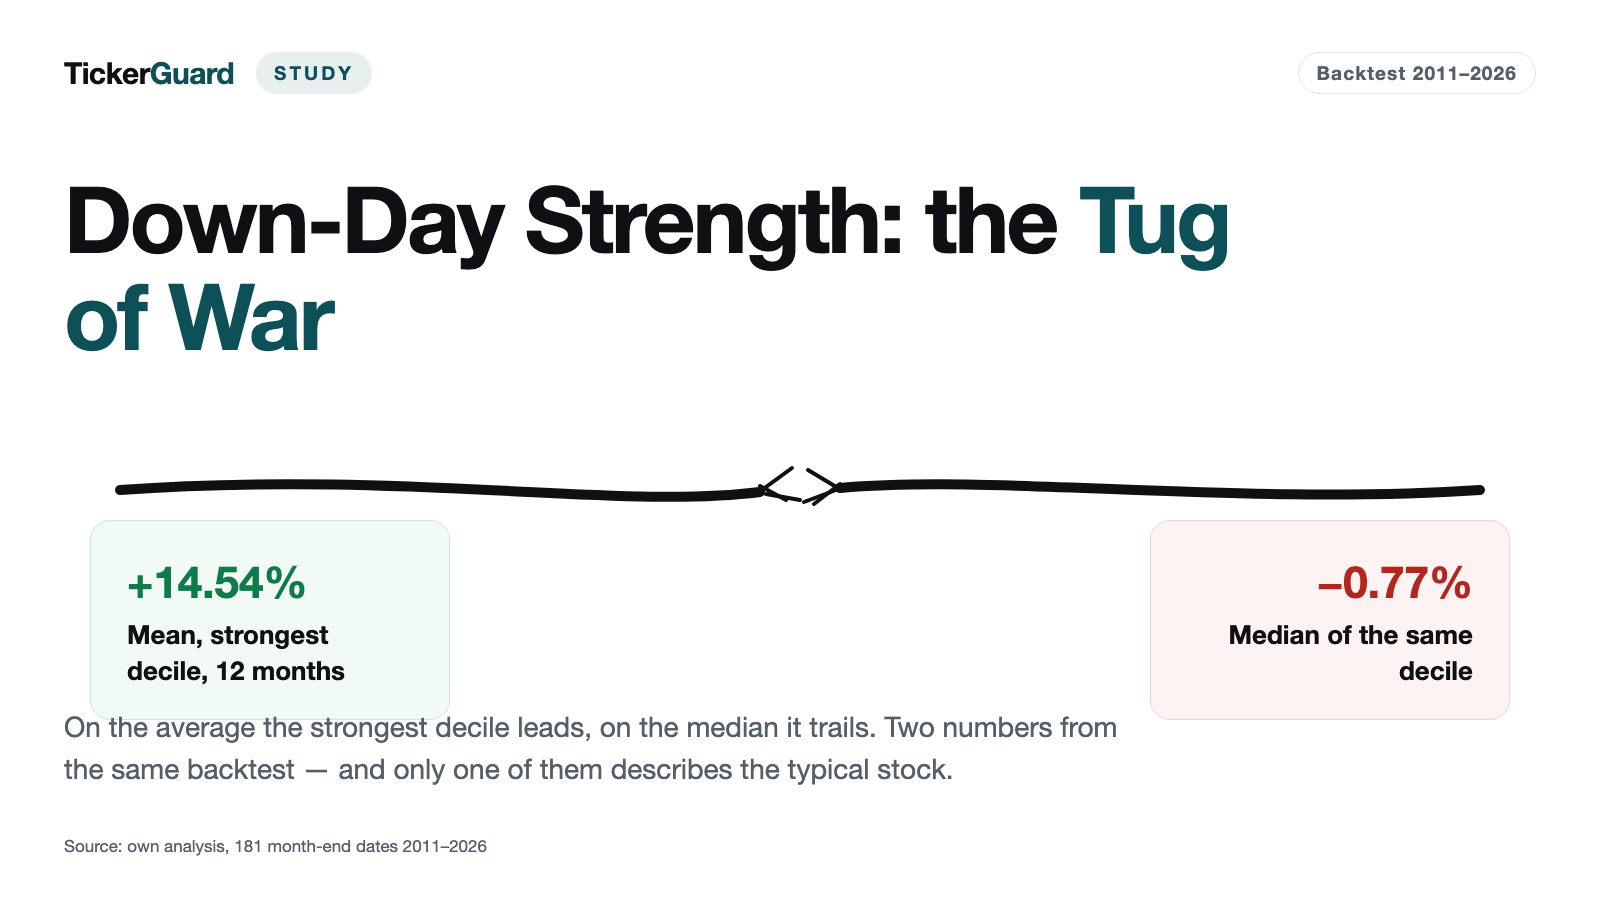
- −0.77% is what the typical stock in the top rating decile returned after 12 months — against 8.32% for the bottom decile. Only the mean of 14.54% looks strong, thanks to a handful of multi-baggers.
- 8.63% is what the top decile returned across the 21 bear-market dates — less than the 15.13% for the bottom decile, a shortfall of −6.50 percentage points. In bull markets it was still ahead by +3.40 percentage points.
- −2.23 to −3.90 percentage points is where the trimmed 12-month gap landed across all seven sweep variants — negative in every one, so the finding doesn't hinge on one particular setting.
In the tested window, no portfolio with a high Down-Day Strength rating held an edge over the S&P 500, and exactly during bear markets the top decile's lead turned into a shortfall.
| Holding period | weakest decile | middle decile | strongest decile | gap strongest − weakest | scanner cell | all rated stocks | S&P 500 TR |
|---|---|---|---|---|---|---|---|
| 1 month | 0.92% | 0.83% | 1.03% | +0.11 pp | 0.55% | 0.99% | 1.20% |
| 3 months | 2.72% | 2.88% | 3.36% | +0.64 pp | 1.79% | 2.97% | 3.66% |
| 6 months | 5.57% | 6.08% | 6.82% | +1.26 pp | 4.69% | 6.09% | 7.38% |
| 12 months | 12.41% | 13.42% | 14.54% | +2.14 pp | 9.26% | 13.59% | 15.29% |
On the "scanner cell" column: it shows exactly the slice the live scanner lists — rating from 90 plus the liquidity filter. It contains the strongest decile and rank 90 from the ninth, so it must not be equated with the top decile. On twelve months there are 45,801 observations in the strongest decile, 11,432 in the scanner cell and 596,654 across the entire rated universe. The benchmark in the last column runs over the same month-end dates as the row beside it.
The contradiction: strong mean, weak median
A glance at the mean-value table above makes the top decile look good: on a 12-month horizon it returns 14.54% on average — ahead of the bottom decile's 12.41% and nearly matching the S&P 500's 15.29%. Reading only the mean, you'd conclude this is a workable signal.
The median table tells a different story. The median is the middle value of the distribution — half of all stocks sit above it, half below. It is therefore robust against individual outliers, while the mean is dominated by them. That's exactly what happens in the top decile: it has the wider right tail — a few multi-baggers lift the mean sharply — while the typical stock inside it lags behind. In other words, the top decile buys lottery tickets rather than broad-based strength: a minority of positions deliver extreme gains, the majority trail the market.
| Holding period | weakest decile | middle decile | strongest decile | gap strongest − weakest | scanner cell | all rated stocks |
|---|---|---|---|---|---|---|
| 1 month | 0.71% | 0.07% | 0.00% | −0.71 pp | 0.11% | 0.00% |
| 3 months | 2.18% | 0.88% | −0.04% | −2.22 pp | 0.20% | 0.57% |
| 6 months | 4.14% | 1.53% | −0.01% | −4.15 pp | 0.85% | 1.25% |
| 12 months | 8.32% | 3.66% | −0.77% | −9.10 pp | 0.86% | 3.00% |
Over twelve months the strongest decile averages 14.54 percent and thus leads the weakest at 12.41 percent. On the median the picture flips: −0.77 percent in the strongest decile against 8.32 percent in the weakest — a gap of −9.10 percentage points. The scanner cell averages 9.26 percent against 12.86 percent for the S&P 500 Total Return over exactly the same month-end dates, and 0.86 percent on the median. Both readings rest on the same observations; they simply measure different things.
The contradiction shows up most clearly at 12 months: the top decile returns −0.77% at the median — the typical stock with the highest Down-Day Strength rating actually loses a bit of money over a year. The bottom decile, by contrast, returns +8.32% at the median. The spread between top and bottom decile flips from +2.14 percentage points on the mean to −9.10 percentage points on the median — a near-ten-point sign reversal. The scanner cell, the exact stocks the live scanner would surface, stays weak at the median too: 0.86% against 12.86% for the S&P 500 Total Return over those exact same dates.
"At 12 months, the top decile returns −0.77% at the median, while the bottom decile returns +8.32% — the metric buys lottery tickets, not broad strength."
Source: TickerGuard backtest "Down-Day Strength," run H-adj, August 9, 2026
Does the strength hold up during a downturn at least?
A strength signal should prove itself exactly when it matters most: during a downturn, when most stocks are falling. We therefore classified every entry date by the market regime it fell into — bull or bear, where a bear phase is a month-end at which the S&P 500 Total Return sits at least 10% below its running high (severe: at least 20%). Only the regime at the entry date counts, not what happens afterward.
| Regime | month-end dates | weakest decile (mean) | strongest decile (mean) | gap (mean) | gap (median) | scanner cell (mean) |
|---|---|---|---|---|---|---|
| bull phase | 160 | 11.98% | 15.37% | +3.40 pp | −8.63 pp | 9.17% |
| bear phase from −10% | 19 | 14.09% | 9.22% | −4.87 pp | −12.05 pp | 10.41% |
| severe bear phase from −20% | 2 | 24.85% | 2.71% | −22.14 pp | −24.38 pp | 7.63% |
| bear phase, combined | 21 | 15.13% | 8.63% | −6.50 pp | −13.20 pp | 10.23% |
The last row combines both bear steps. It rests on 21 month-end dates, 2 of them severe — a thin base on which we build no rule. We show it because the direction is unambiguous, and because a strength signal ought to work precisely here.
In bull markets (160 dates) the picture still looks reasonable: the top decile returns 15.37% on average against 11.98% for the bottom decile, a 3.40 percentage-point edge. In bear markets that picture flips completely: across all 21 bear-market dates the top decile returns just 8.63% against 15.13% for the bottom decile — a 6.50 percentage-point shortfall (−13.20 points at the median, −11.58 trimmed). In the two severe bear dates (at least 20% below the high) the shortfall is even more extreme, at −22.14 percentage points. Exactly where strength should count most, the metric fails hardest.
Important caveat: only 21 bear-market dates are available, just two of them severe. That's a thin base. We present the finding explicitly as a lead, not a robust rule — but it fits the rest of this study's picture: a high rating does not favor broad, robust strength.
What's left in a real portfolio after costs?
An event study shows what followed a rating — a portfolio shows what an investor would actually have earned trading on the metric. We simulated 181 months with 0.1% costs per side (buy and sell) to see what various holding and exit rules would have delivered. Two readings sit side by side: realized sells a position at the last available price, even when the price series ends early; conservative counts exactly that case as a total loss. The benchmark throughout is the S&P 500 Total Return at 14.27% a year across the 181 months — plus, as a second yardstick, the equal-weighted universe at 4.77% a year.
| Selection | Rule | Positions | p.a. measured | p.a. conservative | largest drawdown | S&P 500 TR | equal-weight universe |
|---|---|---|---|---|---|---|---|
| strongest decile | hold for 1 month | 13,510 | 0.07% | 0.07% | −63.44% | 14.48% | 4.88% |
| strongest decile | hold for 3 months | 12,020 | 3.04% | −1.57% | −50.31% | 14.27% | 4.77% |
| strongest decile | hold for 6 months | 11,022 | 6.72% | 1.94% | −42.70% | 14.27% | 4.77% |
| strongest decile | hold for 12 months | 9,280 | 8.06% | 3.29% | −41.59% | 14.27% | 4.77% |
| strongest decile | 12 months, stop at −20% | 10,235 | 7.92% | 2.35% | −33.66% | 14.27% | 4.77% |
| strongest decile | 12 months, stop at −30% | 9,864 | 8.20% | 2.86% | −35.06% | 14.27% | 4.77% |
| strongest decile | hold while the rating stays at 90 or above | 13,510 | 5.56% | 0.63% | −39.92% | 14.27% | 4.77% |
| strongest decile | hold while the rating stays at 50 or above | 8,131 | 9.80% | 4.33% | −37.96% | 14.27% | 4.77% |
| scanner cell | hold for 1 month | 5,291 | 6.26% | 6.26% | −52.45% | 14.27% | 4.77% |
| scanner cell | hold for 3 months | 4,801 | 4.76% | −3.17% | −44.40% | 14.27% | 4.77% |
| scanner cell | hold for 6 months | 4,470 | 7.32% | 0.55% | −41.13% | 14.27% | 4.77% |
| scanner cell | hold for 12 months | 4,077 | 7.56% | 2.28% | −40.17% | 14.27% | 4.77% |
| scanner cell | 12 months, stop at −20% | 4,250 | 7.93% | 1.11% | −29.01% | 14.27% | 4.77% |
| scanner cell | 12 months, stop at −30% | 4,175 | 7.62% | 1.41% | −30.81% | 14.27% | 4.77% |
| scanner cell | hold while the rating stays at 90 or above | 5,100 | 7.31% | −0.10% | −33.41% | 14.27% | 4.77% |
| scanner cell | hold while the rating stays at 50 or above | 3,948 | 7.28% | 1.26% | −38.46% | 14.27% | 4.77% |
The best of all sixteen variants is the "strongest decile" selection under the rule "hold while the rating stays at 50 or above": 9.80 percent a year measured, 4.33 percent conservative — against 14.27 percent for the S&P 500 Total Return over the same period. Not a single variant beats the benchmark.
No single variant beats the index. The scanner cell returns between 4.76% (three-month hold) and 7.93% (with a 20% stop) on the realized basis, and noticeably less on the conservative basis — at a three-month hold, even −3.17%. The top decile fares somewhat better: its best portfolio in the entire study comes from a signal exit below rating 50 (selling as soon as the rating drops under 50), returning 9.80% realized or 4.33% conservative. That's the highest figure this study finds anywhere — and it still trails the S&P 500's 14.27% by 4.47 percentage points. Neither fixed holding periods, nor signal exits, nor stop-losses close that gap.
Does the finding depend on our settings?
Our house variant of the metric makes several choices: a 126-trading-day window, a 0.5% market-and-industry decline threshold, at least four down days within that window. To make sure the negative finding doesn't hinge on one arbitrarily chosen setting, we ran six additional variants and evaluated the 12-month gap between the top and bottom decile for each.
| Variant | counting window | threshold | minimum stress days | reference | gap (mean) | gap (trimmed) | scanner cell (mean) |
|---|---|---|---|---|---|---|---|
| house variant | 126 days | 0.50% | 4 | market and sector | +2.14 pp | −2.23 pp | 9.26% |
| longer counting window | 252 days | 0.50% | 4 | market and sector | +2.25 pp | −2.89 pp | 8.84% |
| shorter counting window | 63 days | 0.50% | 4 | market and sector | −0.18 pp | −3.28 pp | 9.98% |
| more stress days required | 126 days | 0.50% | 8 | market and sector | +1.94 pp | −2.34 pp | 10.57% |
| without the sector condition | 126 days | 0.50% | 4 | market only | +0.50 pp | −2.57 pp | 7.91% |
| milder threshold | 126 days | 0.30% | 4 | market and sector | +0.22 pp | −2.44 pp | 8.18% |
| stricter threshold | 126 days | 1.00% | 4 | market and sector | +0.80 pp | −3.90 pp | 12.18% |
The trimmed gap is negative in all seven variants — from −2.23 percentage points to −3.90 percentage points. The finding therefore does not hang on the setting we happened to compute with.
On the mean, the gap swings widely across the seven variants — from −0.18 percentage points (63-day window) to +2.25 percentage points (252-day window). What matters is the trimmed gap, which strips out individual outliers: it is negative in all seven variants, ranging from −2.23 (house variant) to −3.90 percentage points (1.0% threshold). The finding doesn't hinge on a particular window length, threshold, or minimum down-day count — it's robust to the calculation method, just robustly negative.
A second check tests whether the study's calculation (on adjusted prices) diverges from the scanner's live operation (on unadjusted prices with a jump guard). The rating correlation between the two methods is 0.9873, and top-decile coverage is 93.2% on the latest date — practically identical. Even calculated live-style, the trimmed 12-month gap stays negative (−2.04 percentage points). The calculation method changes nothing about the finding.
What Ben Bennett actually proposed
The idea behind this metric comes from Ben Bennett, who introduced it as "Down Day RS" in a TraderLion interview on January 23, 2022. Important context: Bennett's original is a one-day watchlist scan on red market days, not a buy signal and not a counting window. His rule checks, on a single bad market day, whether a stock stays green down to about −1%, closes in the top quarter of its daily range, carries a high relative-strength rating, trades above its 50- and 200-day lines, and is liquid enough. His approach has no industry condition and no multi-day quota. Its explicit purpose is building a watchlist for corrections — not triggering a purchase.
Our metric translates that observation into a concept that can be backtested: a 126-day counting window, a minimum quota of down days, an added industry condition, and a percentile rating. That's our own build on Bennett's idea, not a replica of his rule — and the numbers that follow are a test of our translation, not of his watchlist. Readers curious about related growth and strength signals we've already backtested can find more in our studies overview — including the Revenue Inflection Backtest Study, where a signal did beat the index in hindsight.
| Holding period | candidates | mean | median | trimmed mean | conservative | S&P 500 TR |
|---|---|---|---|---|---|---|
| 1 month | 7,951 | 0.76% | −0.13% | 0.05% | 0.58% | 0.89% |
| 3 months | 7,707 | 3.89% | 0.39% | 2.58% | 1.09% | 3.64% |
| 6 months | 7,469 | 7.99% | 0.61% | 5.50% | 2.54% | 6.87% |
| 12 months | 7,174 | 15.54% | 1.60% | 10.86% | 6.51% | 15.10% |
Why these numbers are biased upwards: a day's high and low exist only in the raw price files, and those exist for just 9,071 of the 22,872 tickers in the universe; of the 13,801 missing ones, 10,993 have since been delisted. 49,456 of 131,516 pre-selected cases therefore drop out for no reason other than a missing file — and what dropped out is disproportionately the stocks that later disappeared.
To see how close a mechanical buy rule gets to Bennett's original, we ran an additional comparison: the most recent red market day within the last ten trading days before month-end, a daily return of at least −1%, a close at 75% of the daily range or higher (that is, in the top quarter), a six-month percentile of at least 85, price above the 50-day line, bought at month-end. At first glance this run looks better than our house variant — 15.54% on average after 12 months, close to the S&P 500's 15.10%.
These figures are heavily survivorship-biased, though, and must never be read as "Bennett beats the index." The reason lies in the data: intraday highs and lows, needed to check the closing position within the daily range, exist only in the raw price files — and those exist for just 9,071 of the universe's 22,872 tickers. Of the 13,801 missing tickers, 10,993 are delisted. Simply because the file is missing, 49,456 of 131,516 preselection cases drop out — disproportionately affecting the stocks that later disappeared, typically the weaker ones. Here too the median (just 1.60% at 12 months) contradicts the mean sharply. This run is therefore not directly comparable with our house variant.
How we calculated this
- Down day. A trading day on which both the broad market and a stock's own industry closed down at least 0.5% on a median basis — measured as the median daily return of all universe stocks, respectively all industry stocks.
- Rating. A 126-trading-day counting window (roughly six months), at least four down days within the window; we count how many of those a stock closed green, converted into a percentile rating from 1 to 99 within the universe.
- Date grid. 181 month-end dates, from June 2011 through June 2026.
- Universe. US stocks including delisted ones; 897,326 rating rows, of which 877,333 carry a rating.
- Adjusted calculation with a live-style check. The study runs on split-adjusted prices; the live scanner runs on unadjusted prices with a jump guard. A live-style check confirms the finding (0.9873 rating correlation).
- Costs. The event study runs without costs; the portfolio section uses 0.1% costs per side (buy and sell).
- Delisted stocks. Stay in the portfolio; if a price series ends before the horizon, the position is force-sold at the last available price (realized) or counted as a total loss (conservative).
- Benchmarks. The S&P 500 Total Return and, as a second yardstick, the equal-weighted universe.
- Data filters. A day only counts as a trading day once at least 500 stocks have prices; volume-less daily bars carry no price; a single-day move in the adjusted series above +100% or below −50% without a documented split counts as a data error.
What this study doesn't say
- Only 6,186 of the 8,766 rated tickers have month-end prices in our retained history; the rest receive a rating but no forward return.
- The industry classification is current, not historical — the study has no record of past industry reclassifications. Of 22,872 tickers, 9,649 carry an industry; two sources agree on 82.05% of the overlap. Tickers without an industry still count toward the market median but receive no rating — exactly as in live operation. Because knowing a company's industry correlates with survival, the rated set skews toward survivors, which lifts every decile, not just the top ones.
- 4,107 trading days fall within the period, of which 849 are market-wide down days. A day only counts as a trading day once at least 500 tickers have prices; without that filter, 20 spurious down days would have entered the data, including December 25, 2018. 140 such pseudo trading days were discarded.
- 52,339,215 daily returns were computed. Monthly rows below $0.01 in raw price, and monthly moves by a factor of 10 (an instrument swap under one ticker), are dropped — the second filter also removes genuine crashes of more than 90% in a month, which flatters the study slightly. That's why a median and a trimmed mean sit next to every mean.
- Forward returns of neighboring dates overlap: 181 dates yield only 15 independent 12-month windows. The observation count is therefore not a measure of statistical confidence.
- Only 21 bear-market dates are available for the regime section — a thin base.
- Taxes and spreads are not modeled; only 0.1% costs per side are included in the portfolio section.
- The scanner cell (rating 90 or above plus a liquidity filter) is not the same as the top decile — it includes the top decile plus rank 90.
- A backtest is not a forecast. This study is market research, not investment advice, and not a buy recommendation.
Bottom line: what does this mean for investors?
In hindsight, Down-Day Strength is neither a buy signal nor a warning sign. The mean looks good because of a handful of multi-baggers; the median — the more honest number for the typical stock — actually shows a slight loss in the top decile after 12 months. Exactly during downturns, where a strength signal should matter most, the edge turns clearly negative. And even the best portfolio in the entire study, at 9.80% a year, falls short of the S&P 500's 14.27%.
None of that changes the live scanner's value as a watchlist tool — it still surfaces stocks that hold up unusually well on bad market days, very much in the spirit of Bennett's original watchlist idea. We're not calling it a buy list, though: it doesn't appear on our list of vetted scanners. Readers looking for a growth signal that actually beat the market in hindsight will find one in our studies overview.
Frequently Asked Questions
No. At the median, the top decile returns −0.77% after 12 months, against +8.32% for the bottom decile — the typical stock with a high rating actually lags, not leads. Only the mean (14.54%) looks strong, because a handful of multi-baggers pull it up. After costs, no high-rating portfolio variant beats the S&P 500 Total Return's 14.27% a year either; the best portfolio in the study manages 9.80%.
Because the top decile has a wide right tail: a few stocks multiply in value and pull the mean up, while the typical, middle-of-the-pack stock lags behind. After 12 months the top decile shows a 14.54% mean against a −0.77% median — in the bottom decile, mean (12.41%) and median (8.32%) sit much closer together. That's why the median is the more honest number here.
Worse than in a bull market, not better. Across the 21 bear-market dates the edge reverses: the top decile returns 8.63% a year against 15.13% for the bottom decile, a 6.50 percentage-point shortfall (−13.20 points at the median). Exactly where a strength signal should protect investors most, it fails hardest. With only 21 dates, though, the base is thin — a lead, not a robust rule.
Bennett's original (TraderLion interview, January 23, 2022) is a one-day watchlist scan on red market days: a stock that stays green down to about −1%, closes in the top quarter of its daily range, carries a high relative-strength rating, trades above its 50- and 200-day lines, and is liquid. No counting window, no quota, no industry condition — and explicitly no buy or sell signal, only a watchlist for corrections. Our metric is our own build on that idea, not a replica of his rule.
The scanner (the strongest roughly 10% of the universe, rating 90 or above, price above $3, sufficient dollar volume) stays live — but as a watchlist tool, not a buy list. The backtest shows a high rating beats the index neither at the median nor after costs, so it does not appear on our list of vetted scanners.
No. We ran seven variants of the window, threshold, and conditions — a 252- instead of 126-day window, at least 8 instead of 4 down days, market only instead of market and industry, a 0.3% or 1.0% threshold instead of 0.5%. The trimmed gap between the top and bottom decile stays negative in all seven variants (−2.23 to −3.90 percentage points). A check on unadjusted, live-style prices (0.9873 correlation with the main run) doesn't change the finding either.


