The Flag Carries Information, the Recipe Doesn't: The Gajjala Day-Trading Backtest
We mechanically rebuilt the bull-flag setup used by US Investing Championship winner Goverdhan Gajjala and ran it across 22 years and 1,459 trades. Result: the pattern clearly beats chance, but the tradable recipe earns almost nothing after costs.
 Thomas Mücke
Founder & Publisher
Thomas Mücke
Founder & Publisher
Goverdhan Gajjala, a Dallas-based software consultant, won the 2023 US Investing Championship in the stocks division for accounts under $1 million with an annual return of +805.1% — according to the organizer, the second-best performance ever recorded in the competition's long history. His approach is pure intraday momentum trading: low-priced stocks with strong intraday breakouts, traded on short time frames along the 9- and 21-period EMA, with a bull-flag pattern as the central entry signal. He has described his method publicly in interviews and course material. We wanted to find out what remains of this setup once it is rebuilt as mechanically and objectively as possible and run across two decades — not as a judgment of the trader, but as a test of the rule set.
The result in four numbers
Does Goverdhan Gajjala's bull-flag pattern carry real information — and can it be turned into a recipe that still earns something after costs? We tested both questions across 22 years and 1,459 trades. Four numbers carry the result:
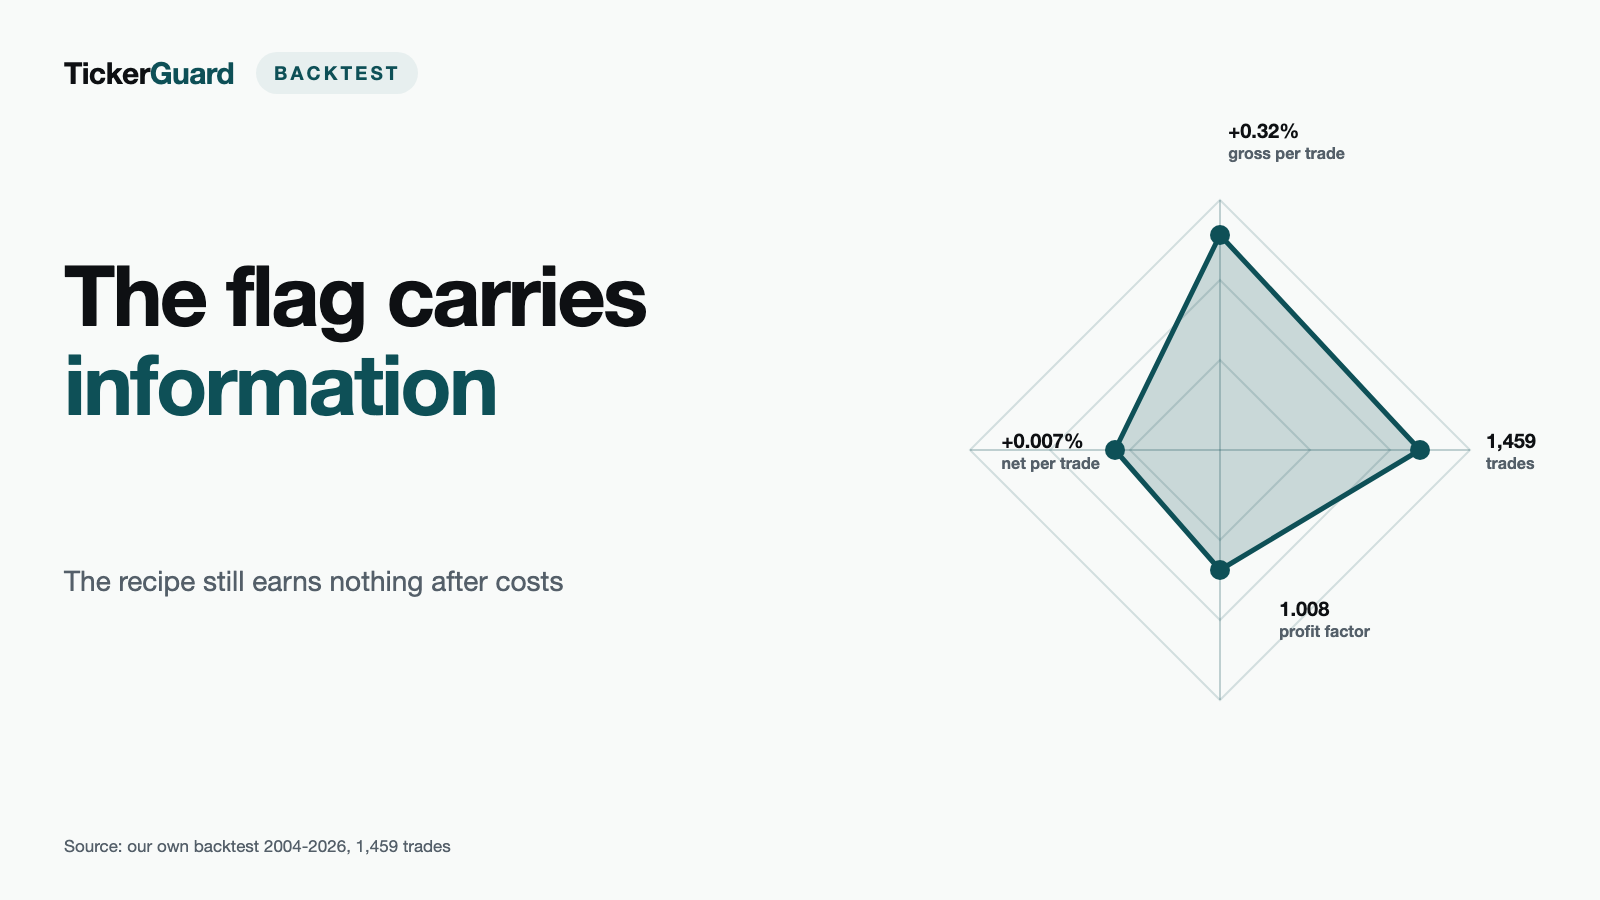
- +0.007% was the average net result per trade — the gross figure was +0.32%, and the assumed 0.2% cost per leg ate up almost all of that edge across 1,459 trades from 2004 to 2026.
- -0.378% per trade is what a random entry returned on the same trading days (the pure +25% crossing without flag confirmation returned -0.829%) — both baselines are clearly negative, while the flag itself landed just above zero.
- -0.20% CAGR is what the simulated “Progressive Exposure” portfolio returned over 22.5 years (2004 to 2026) — a simple buy-and-hold of the S&P 500 (SPY) returned +10.64% CAGR over the same window.
- -0.15% per trade is what the recipe earned over the trailing twelve months (239 trades) — the net result turned clearly negative here, while the gross edge stayed positive at +0.15% but shrank to about half its +0.32% long-run size.
In the tested window, the flag carried more information than both baselines on the same trading days, yet the gross edge was too small to survive the assumed trading costs.
The recipe: bull flag on 5-minute candles
A trading day first has to qualify at all. We call a day a signal day when a stock closed the prior day between $0.50 and $100, traded at least 1 million shares, and moved at least 25% above the prior close intraday. That is exactly the hunting ground Gajjala describes: small, volatile, strongly running stocks.
Within such a day, we look for a clearly defined pattern on 5-minute candles:
- Impulse: at least two consecutive green candles spanning a price range.
- Consolidation: 3 to 10 candles whose lows stay at least half the impulse range above the impulse low (the “flag” holds in the upper part of the prior move) and whose high never exceeds the impulse peak.
- Volume pullback: the average volume of the consolidation candles is at most half the average volume of the impulse candles — a sign of fading selling pressure.
- Qualification at the moment of breakout: only when price breaks above the consolidation does the model check whether the cumulative day's high is still at least 25% above the prior close, whether day volume has reached the 1-million mark, and whether price remains inside the $0.50-$100 window — all without any lookahead.
Entry is the first candle whose high exceeds the consolidation high (the “pivot”), filled at the higher of the open or the pivot plus slippage. The earliest entry is 9:35 a.m. New York time, the latest 3:30 p.m. (12:30 p.m. on shortened trading days).
The exit follows a fixed order: the initial stop sits at the consolidation low but never more than 4% below entry. Once a candle has traded 1.5% above entry, the stop moves to breakeven. Half the position is taken off at +8%. The remainder runs until a 5-minute candle closes below the 9-EMA, or until the forced close at 3:55 p.m. (12:55 p.m. on shortened days) at the latest — day trading means nothing carries overnight. Trading halts are treated as real price gaps, filled at the first price after the gap. Costs are set at 0.2% per leg, applied even to limit orders — a deliberately conservative assumption bracketed by sensitivities at 0.1% and 0.5%.
Two things we deliberately do not simulate: a float filter (historical free-float data is not reliably available for most of these micro-cap names) and Gajjala's own rule of sizing up disproportionately on “A+” setups — neither is objectively reproducible. We are testing the mechanical recipe, not the trader's selection skill.
How we tested it
The base data covers 22,445 US tickers including delisted names from January 2, 2004 to July 24, 2026. Of 36,843 identified signal days, we could verify 22,397 (60.8%) with reliable 1-minute data — the rest either had no usable intraday history or failed a consistency check comparing the minute-level high against the official daily high.
This coverage gap is not a minor detail. In early years it is large: only 91 of 856 signal days in 2004 (10.6%), only 82 of 681 in 2010 (12.0%). Coverage only rises to 70% and beyond from around 2019 onward. This matters for interpreting the result: the gap likely biases in the strategy's favor. Stocks that got delisted quickly after an extreme pump are the ones most likely to be underrepresented in historical minute-level databases — precisely the cases that would often punish a bull-flag setup hardest afterward. The measured result is therefore more likely flattering than pessimistic.
Coverage by year (selection):
| Year | Signal days | Verified | Coverage |
|---|---|---|---|
| 2004 | 856 | 91 | 10.6% |
| 2010 | 681 | 82 | 12.0% |
| 2016 | 1,266 | 476 | 37.6% |
| 2019 | 1,307 | 948 | 72.5% |
| 2022 | 2,308 | 1,770 | 76.7% |
| 2025 | 3,596 | 3,181 | 88.5% |
| 2026 | 1,940 | 1,817 | 93.7% |
Of the 7,190 cases where the bull-flag pattern was recognized at all, 1,459 led to an actual trade. In another 2,079 cases the qualification conditions no longer held at the moment of breakout — mostly on the cumulative day's advance (1,609 cases) or on volume (1,379 cases); multiple reasons can apply to the same setup, so the counts overlap.
The benchmark is two baselines with identical exit rules: a random entry on the same ticker-day, and an entry that simply buys the +25% crossing with no flag confirmation at all. Because both baselines enter on every verified day while the main rule only trades where a flag actually forms, we compare the baselines exclusively on the subset of days the main rule itself traded. Only that restriction compares recipe against recipe on the same material. The baselines count 1,412 trades rather than 1,459 because they enter exactly once per ticker-day — on 45 days the main rule found more than one flag.
“Only the gap to both baselines on the exact same trading days shows whether the flag carries information — or whether we are merely measuring the candidate day.”
— from our own decision and methodology protocol for this backtest.
The results
Full run, 2004 to 2026
| Metric | Value |
|---|---|
| Total trades | 1,459 |
| Hit rate (net > 0) | 19.0% (277 wins) |
| Profit factor | 1.008 |
| Average per trade, net | +0.007% |
| Median, net | −0.20% |
| Average per trade, gross | +0.32% |
| Sum, net | +9.9 percentage points |
| Max drawdown of the trade sequence (largest decline of the cumulated trade results) | 212.8 percentage points |
A profit factor of 1.008 and an average of +0.007% per trade are statistically almost indistinguishable from zero. The gross figure (+0.32% per trade), however, shows that before costs there is a real, if small, edge in the pattern. It is the assumed 0.4% cost per round trip (0.2% per leg) that eats almost all of it.
Yearly breakdown
| Year | Trades | Hit rate | Profit factor | Average net |
|---|---|---|---|---|
| 2004 | 6 | 50.0% | 8.66 | +2.058% |
| 2005 | 9 | 11.1% | 0.24 | −0.418% |
| 2006 | 12 | 33.3% | 2.76 | +0.590% |
| 2007 | 4 | 25.0% | 0.90 | −0.130% |
| 2008 | 20 | 20.0% | 1.74 | +0.427% |
| 2009 | 22 | 18.2% | 0.87 | −0.165% |
| 2010 | 5 | 40.0% | 8.09 | +3.483% |
| 2011 | 7 | 42.9% | 3.16 | +1.106% |
| 2012 | 12 | 16.7% | 1.09 | +0.094% |
| 2013 | 18 | 38.9% | 1.65 | +0.375% |
| 2014 | 11 | 18.2% | 0.54 | −0.366% |
| 2015 | 16 | 31.2% | 0.88 | −0.073% |
| 2016 | 40 | 17.5% | 0.30 | −0.779% |
| 2017 | 52 | 23.1% | 0.81 | −0.191% |
| 2018 | 49 | 18.4% | 1.26 | +0.218% |
| 2019 | 63 | 19.0% | 1.76 | +0.575% |
| 2020 | 228 | 21.1% | 1.78 | +0.623% |
| 2021 | 103 | 21.4% | 1.03 | +0.030% |
| 2022 | 118 | 16.1% | 0.58 | −0.450% |
| 2023 | 117 | 14.5% | 0.59 | −0.402% |
| 2024 | 179 | 13.4% | 0.56 | −0.383% |
| 2025 | 235 | 21.3% | 1.02 | +0.017% |
| 2026 (through Jul 24) | 133 | 14.3% | 0.82 | −0.184% |
Early years have only a handful of trades combined with thin data coverage (see above) — strong single years like 2004 or 2010 rest on a small number of trades and are not statistically robust. From 2016 on, with substantially more trades and better coverage, the real picture emerges: a pattern oscillating around zero with no clear trend, with 2022 through 2024 negative throughout.
Baselines, head-to-head (days with a main-rule trade only)
| Rule | Trades | Hit rate | Profit factor | Average net |
|---|---|---|---|---|
| Bull flag (main rule) | 1,459 | 19.0% | 1.008 | +0.007% |
| Random entry | 1,412 | 20.0% | 0.572 | −0.378% |
| +25% crossing, no flag | 1,412 | 17.6% | 0.530 | −0.829% |
On the exact same trading days, the flag clearly beats both baselines — both alternatives are clearly negative here. Flag confirmation genuinely picks better entry moments than a random pick or a pure breakout buy on the same day. The pattern carries information, independent of whether that turns into a profitable recipe.
Trailing 12 months
| Metric | Value |
|---|---|
| Trades | 239 |
| Hit rate | 17.2% (41 wins) |
| Profit factor | 0.852 |
| Average per trade, net | −0.15% |
| Sum, net | −35.3 percentage points |
Over the most recent year, the recipe slides from around zero into a clear loss — a sign that even the thin gross edge does not hold stable over time.
Sensitivities
Each row changes exactly one parameter relative to the main rule; rows are not meant to be combined.
| Variant | Change | Trades | Hit rate | Profit factor | Average net |
|---|---|---|---|---|---|
| Main rule | Defaults | 1,459 | 19.0% | 1.008 | +0.007% |
| Earlier breakeven | at +1% | 1,460 | 16.5% | 1.025 | +0.020% |
| Later breakeven | at +2% | 1,459 | 20.2% | 0.941 | −0.060% |
| Earlier partial | at +5% | 1,459 | 23.1% | 1.003 | +0.003% |
| Later partial | at +12% | 1,459 | 17.7% | 1.026 | +0.023% |
| Tighter stop | max 3% | 1,459 | 18.4% | 0.945 | −0.051% |
| Wider stop | max 5% | 1,459 | 19.2% | 1.026 | +0.023% |
| Longer consolidation | max 15 candles | 1,543 | 19.6% | 1.043 | +0.039% |
| Shorter consolidation | min 2 candles | 2,805 | 17.9% | 0.824 | −0.159% |
| Stricter volume pullback | ≤ 30% | 397 | 22.2% | 1.312 | +0.256% |
| Looser volume pullback | ≤ 70% | 2,635 | 19.2% | 0.910 | −0.087% |
| Looser hold zone | 30% | 3,285 | 17.3% | 0.777 | −0.231% |
| Stricter hold zone | 70% | 260 | 20.0% | 1.144 | +0.120% |
| Lower costs | 0.1% per leg | 1,460 | 19.7% | 1.219 | +0.168% |
| Higher costs | 0.5% per leg | 1,460 | 15.0% | 0.533 | −0.652% |
| Round-number exit | Variant | 1,459 | 19.7% | 0.998 | −0.002% |
Two patterns stand out. First, stricter flag quality helps the per-trade edge but costs volume. A volume pullback of at most 30% during consolidation (instead of 50% in the main rule) lifts the average to +0.256% per trade — on just 397 trades instead of 1,459. A tighter hold zone (70% instead of 50% of the impulse) works similarly: +0.120% on 260 trades. Second, the cost assumption decides between profit and loss almost by itself. At 0.1% per leg the result turns to +0.168% per trade; at 0.5% per leg it collapses to -0.652%. The recipe lives and dies on the cost assumption, not on a robust edge of its own.
Portfolio simulation: “Progressive Exposure”
Position size starts at 10% of the account, rises to 25% after two winners, then to 50%, and drops back to 10% after every loss. Only one position at a time, starting capital $100,000.
| Variant | Ending capital | CAGR | Max drawdown |
|---|---|---|---|
| Progressive Exposure | $95,590 | −0.20% | 20.0% |
| Fixed 10% per trade | $99,365 | −0.03% | 18.0% |
| SPY buy-and-hold (same window) | $972,211 | +10.64% | – |
Over the full 22.5-year window (January 22, 2004 to July 24, 2026), the Progressive Exposure portfolio loses real capital, while a simple index buy over the same period would have grown capital nearly tenfold. The yearly returns show no single outlier, but a series of small up and down years scattered around zero over 22 years — 2020 was the best year at +9.3%, 2024 the weakest at -6.9%.
What this means for investors
Two statements belong together. First: the bull-flag pattern carries real information. Against two baselines on identical material — a random entry and a pure +25% breakout buy — the flag comes out clearly ahead. This is not a coincidence; it holds across 22 years and more than a thousand trades. Second: this pattern does not turn into a reliably profitable, mechanical trading recipe. Before costs, +0.32% per trade remains; after realistic costs, essentially nothing — and over the trailing 12 months, a noticeable loss.
So where might a championship winner like Gajjala's real success come from, if not from this rule set? Most plausibly from exactly the places a mechanical backtest cannot capture: discretionary selection of the best setups among many recognized flags, variable rather than fixed position sizing on particularly convincing days, and execution speed that our model only approximates through a flat slippage assumption. On top of that, a single championship winner among many participants is itself a selection effect — even a strategy with zero edge would produce someone with the best random run in any given year.
The same pattern — a signal that carries real information without turning into a profitable system — also shows up in our backtest of the Velez open trade and in our backtest of the Qullamaggie setups. All of our own backtests are collected in the Studies section.
Related scanner: To see which stocks are currently forming a bull-flag setup under this rule set, check the ongoing scan at Gajjala Day-Trading Setup. The scanner surfaces the pattern — it does not replace your own judgment, since this very backtest shows that the pattern alone does not add up to a reliable trading recipe.
Method and measurement limits
Several assumptions shape this result and belong openly in the write-up:
- Coverage gap in the minute data. Only 60.8% of signal days are verified, far fewer in early years. The gap likely biases in the strategy's favor, because extreme cases delisted early are the ones most likely to be missing from minute-level databases.
- Thin early years. Up to 2015 there are only four to 22 trades per year in the statistics. Individual yearly figures there are noise, not results.
- Costs as a flat assumption. 0.2% per leg is a realistic but flat assumption for illiquid small caps — not a measurement of actual spreads, which can be wider in hectic breakout minutes. The sensitivities at 0.1% and 0.5% per leg bracket the range.
- No float filter, no variable position sizing. Two components of Gajjala's own description are not objectively reproducible and are therefore missing from the recipe.
- 15 sensitivities alongside the main rule, all on the same data. With that many comparisons, one variant is almost always ahead statistically, even without a real advantage. What matters is the spread and the sign, not the single best row.
- One position at a time. The portfolio simulation lets 90 of 1,459 trades expire because another position was still open.
Figures as of 9 August 2026.
This article is a historical analysis, not investment advice. It contains no buy or sell recommendation, no price target, and no forecast for any individual, currently listed company. Anyone making investment decisions should assess their own situation and risks, and seek professional advice where in doubt.
Frequently Asked Questions
Goverdhan Gajjala is a Dallas-based software consultant who won the 2023 US Investing Championship in the stocks division for accounts under $1 million with an annual return of +805.1% — according to the organizer, the second-best performance ever recorded in the competition's history. He trades purely technically on short time frames of one to 15 minutes, most often on 5-minute candles, focuses on low-priced momentum stocks with strong intraday moves, and orients himself around the 9- and 21-period EMA together with bull-flag consolidations. He has described his approach publicly in interviews and course material; we distilled a mechanical, objectively testable rule set from it.
A signal day is a ticker-day with a prior close between $0.50 and $100, at least 1 million shares traded, and an intraday high at least 25% above the prior close. On 5-minute candles we look for a price impulse of at least two green candles, followed by a 3-to-10-candle consolidation that stays in the upper half of the impulse range on falling volume. Entry triggers on a breakout above the consolidation high, the stop sits no more than 4% below entry, half the position is taken off at +8%, and the rest runs until a 5-minute close falls below the 9-EMA or the trading day ends.
Yes, clearly. Against two baselines — a random entry on the same ticker-day and a buy on the +25% crossing alone without flag confirmation, both with identical exits — the flag comes out clearly ahead on the exact same trading days: +0.007% per trade versus -0.378% for the random entry and -0.829% for the pure crossing. Both baselines land clearly negative. Flag confirmation genuinely selects better moments than a random pick on the same day.
Because the gross edge of +0.32% per trade is small, and the assumed realistic trading cost of 0.2% per leg (0.4% per round trip) eats almost all of it. What is left is +0.007% per trade net — statistically indistinguishable from zero. Over 22.5 years the portfolio test even shows a small net loss, while a simple SPY buy-and-hold over the same window would have grown capital nearly tenfold.
Only 60.8% of all 36,843 identified signal days could be verified with usable 1-minute data; the rest had no reliable intraday history. The gap is large in early years — for example only 91 of 856 signal days in 2004 (10.6%) — and only closes to 70% and beyond from around 2019 onward. This matters for how to read the result: the gap likely biases in the strategy's favor. Stocks that were delisted quickly after an extreme pump are the ones most likely to be missing from historical minute-level databases — precisely the cases that would often punish a bull-flag setup hardest afterward. The measured result is therefore more likely flattering than pessimistic.
No. We rebuilt a publicly described, mechanizable setup and tested it against chance and realistic costs — that evaluates a rule set, not the trader. A championship winner with a +805% annual return almost certainly makes thousands of discretionary judgment calls that no mechanical backtest can capture: which of many recognized setups on a given day are truly “A+”, when a larger position is justified, when to skip a flag despite it technically qualifying. That selection and execution skill is exactly what our recipe does not include — and that is likely where the real edge lives.


