Earnings Streak Backtest: Six Rising Quarters Don't Beat the Market — 13.29% Against 15.02% per Year
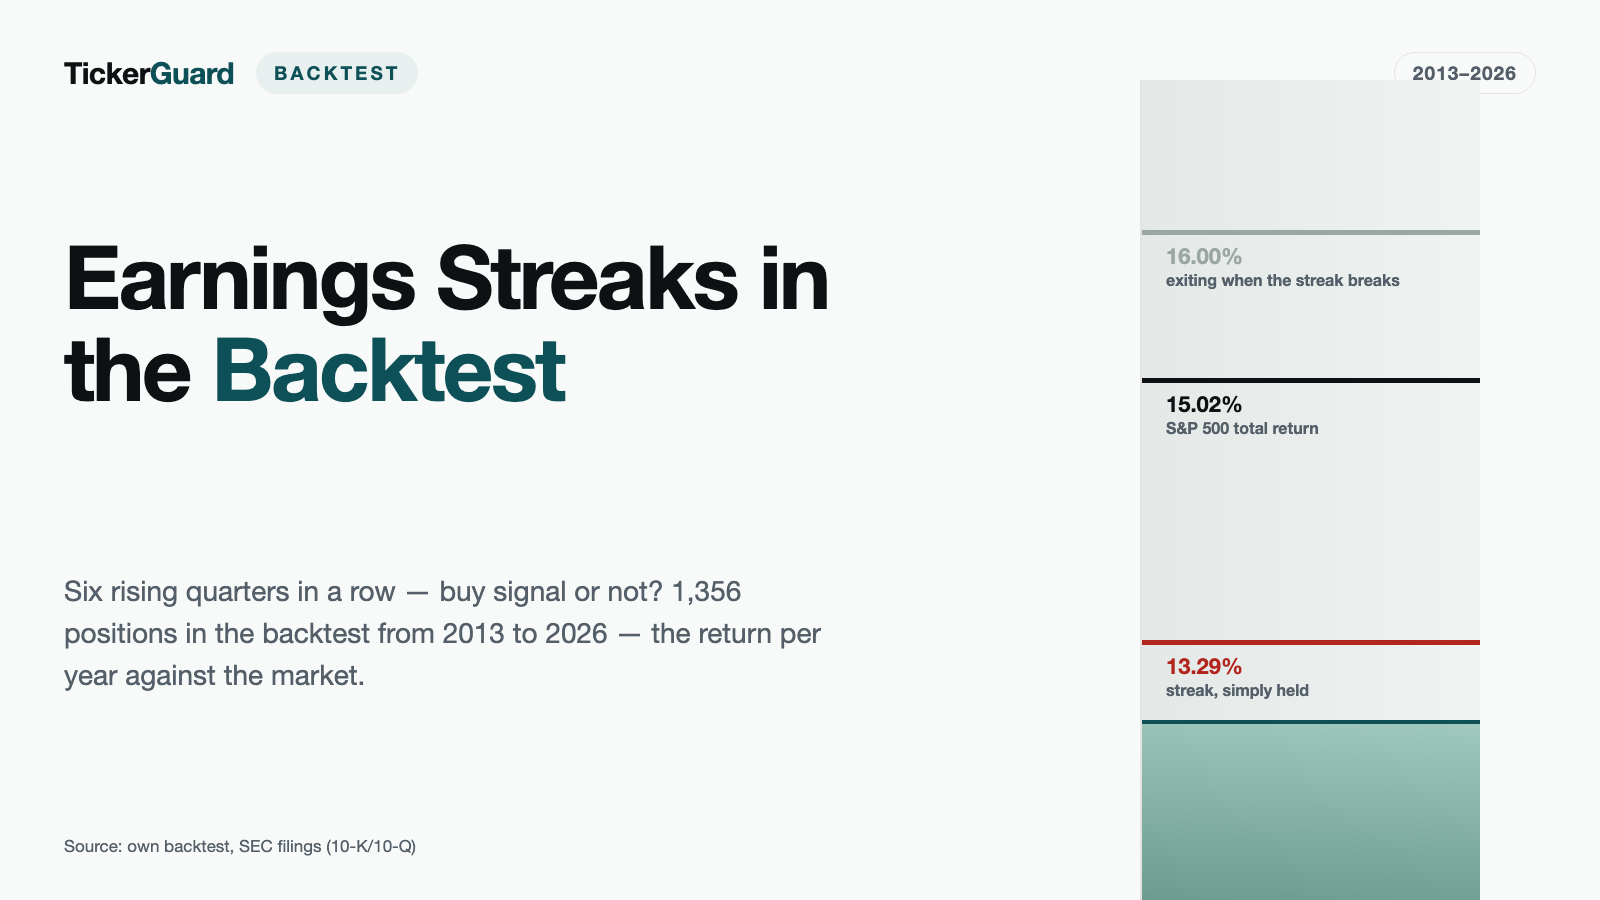
A company whose earnings per share sit above the year-ago quarter for six consecutive quarters — is that a buy signal? And is the end of that streak, the break, a sell signal in reverse? We tested both questions across thirteen and a half years, with delisted stocks left in the portfolio, with the filing date rather than the quarter end as the cut-off, and with a dedicated event study built around the break month. The result cuts both ways: as a buy signal, the streak stays narrowly but clearly behind the S&P 500 at 13.29% per year against 15.02% — while beating the equal-weighted universe (4.77%) by a wide margin. The real finding lies elsewhere: selling the moment the streak breaks, instead of holding a fixed twelve months, turns the same entries into 16.00% instead of 13.29% — the streak pays off as a HOLD rule, not as an entry edge. The break itself, though, is worthless as a sell signal: the price is already down in the filing month, and what follows afterward is only a coin flip.
 Thomas Mücke
Founder & Publisher
Thomas Mücke
Founder & Publisher
The question: is a streak of rising quarterly earnings a buy signal — and its end a sell signal?
The Revenue Inflection and Earnings Inflection backtests looked at the INFLECTION — a sudden jump after four quiet quarters. This study asks about CONSISTENCY instead: what if a company doesn't suddenly accelerate, but simply earns more than the year before, quarter after quarter, for many quarters running? A streak of six, eight, or twelve consecutive rising quarters is one of the oldest growth stories there is — and the obvious second question follows immediately: is the end of that story, the moment the streak breaks, an equally usable sell signal?
- Streak. A run of consecutive quarters in which diluted earnings per share from continuing operations sits above the YEAR-AGO quarter. Streak length counts these quarters.
- Edge cases. A year-over-year comparison only counts when both the base quarter AND the signal quarter show positive earnings and the signal quarter's net margin is at least 2 percent — otherwise that quarter counts as neither a rise nor a base for one. Without this rule, any recovery from a one-cent profit would register as a "doubling".
- Variants. s4 / s6 / s8 / s12 — the number is the required streak length in quarters. The main variant is s6. The four variants ARE the length question; a separate length arm within one variant would count almost the same thing twice.
- fresh = the streak reached the threshold under observation · edge = it was already above the threshold at the first look in 2013 (data edge, IPO proximity).
- Sold after a fixed hold (3, 6, 12 months) or "as long as the streak lives" — for as long as the latest reported quarter still sits above its year-ago quarter, capped at 120 months.
And, separately, in its own event study: what happens to the price when a streak BREAKS — when a quarter first falls below its year-ago value again? Is the break a signal you can sell on, or has the damage already happened by then?
The result in four numbers
Is a streak of rising quarterly earnings a buy signal — and is its end, the break, a sell signal in reverse? We tested both questions against the US stock market from 2013 to 2026. Four numbers carry the result:
- 13.29% per year is what the streak portfolio returned (main variant s6, six consecutive rising quarters, 1,356 positions, twelve-month hold), before taxes and trading spreads.
- 15.02% is what the S&P 500 Total Return returned over the same window — the streak trailed it as a buy signal. Against the equal-weighted universe (4.77%), though, it leads clearly.
- 16.00% per year is what the same entries returned when sold the moment the streak ends, instead of after a fixed twelve-month term — at a shorter average hold (10.3 instead of 11.6 months). The streak pays off as a hold rule, not as an entry edge.
- −1.32% average excess return in the twelve months after the break, tradeable from month-end after the filing — with 50.65% negative cases out of 1,161 events, barely more than a coin flip. The break was not a tradeable sell signal.
In the tested window, the streak was not a buy signal, but it carried as an exit rule — the break itself came too late as a sell signal.
The result: the streak does NOT beat the market — but clearly beats the universe
Every headline figure in this study is the conservative one — computed excluding positions with a monthly jump above 200 percent suspected of being unrecorded reverse splits (more on this in the robustness section). For the main variant s6, though, this filter has no effect in the portfolio at all: not one of the 1,356 positions is affected, conservative and full counts are identical here.
| Arm | Positions | Return p.a. | Max drawdown |
|---|---|---|---|
| Streak, all stocks (ALLE) | 1,356 | 13.29% | −29.11% |
| Streak, fresh (formed under observation) | 1,256 | 13.30% | −29.12% |
| Streak, edge (2013 data edge, n small) | 100 | 4.83% | −66.85% |
| Streak, revenue base above $100M (o100) | 1,307 | 13.15% | −29.16% |
| Streak, revenue base $10–100M (u10_100) | 44 | 11.43% | −46.99% |
| Streak, revenue base below $10M (u10) | 5 | −3.78% | −52.60% |
| S&P 500 Total Return | — | 15.02% | −23.87% |
| Universe, equal-weighted (trimmed mean) | — | 4.77% | −53.23% |
| Universe, median stock | — | −5.45% | −60.68% |
The "edge" arm, with just 100 positions and at most two held stocks in 87 of 163 months, speaks for itself — it is a statement about a hundred individual cases, not a strategy. The "u10" arm with 5 positions only shows the streak doesn't work at tiny-revenue companies. The load-bearing comparison stays ALLE against fresh: both sit almost identically near 13.3 percent — the data edge doesn't distort the headline result.
Across every holding period: the same ranking — with one exception
| Hold | Positions | Stocks/month (median) | Months with ≤ 2 stocks | Return p.a. |
|---|---|---|---|---|
| 3 months | 1,356 | 22 | 0 | 13.87% |
| 6 months | 1,356 | 44.5 | 0 | 14.63% |
| 12 months | 1,356 | 90 | 0 | 13.29% |
| as long as the streak lives | 1,356 | 86 | 0 | 16.00% |
The ALLE arm never dips below a median of 22 stocks at any holding period — unlike the narrower inflection signals of the sibling studies, this portfolio is never thin. At fixed holds the result ranges between 13.29% and 14.63%, all three below the index. Only the open-ended "as long as" hold breaks out of that range on the upside — more on that in the next section.
The control arm: does the streak carry, or does only the holding period carry?
This is the decisive check of this study. All four holding periods run on the SAME entries — only the exit timing differs. If "as long as the streak lives" does not beat the fixed terms, the streak's ending carries no value of its own as a sell rule, and this backtest would just be an ordinary hold test with an elaborate justification.
| Variant | Hold | Positions | Average hold (months) | Return p.a. |
|---|---|---|---|---|
| s4 | m3 | 3,209 | 3.0 | 9.25% |
| s4 | m6 | 3,209 | 5.9 | 10.64% |
| s4 | m12 | 3,208 | 11.6 | 11.66% |
| s4 | as long as | 3,208 | 8.9 | 12.89% |
| s6 (main) | m3 | 1,356 | 3.0 | 13.87% |
| s6 (main) | m6 | 1,356 | 5.9 | 14.63% |
| s6 (main) | m12 | 1,356 | 11.6 | 13.29% |
| s6 (main) | as long as | 1,356 | 10.3 | 16.00% |
| s8 | m3 | 693 | 3.0 | 7.60% |
| s8 | m6 | 693 | 5.9 | 12.31% |
| s8 | m12 | 693 | 11.5 | 14.28% |
| s8 | as long as | 693 | 10.9 | 16.28% |
| s12 | m3 | 189 | 3.0 | 15.09% |
| s12 | m6 | 189 | 5.8 | 17.33% |
| s12 | m12 | 189 | 11.2 | 17.38% |
| s12 | as long as | 189 | 13.1 | 15.45% |
In three of four variants, "as long as" beats the fixed twelve-month term: s4 at 12.89% against 11.66%, s6 at 16.00% against 13.29% (2.72 percentage points more — the "roughly equal" convention sits at a 1-percentage-point gap), s8 at 16.28% against 14.28%. Only s12 flips the picture (15.45% against 17.38%) — at just 189 positions and the strictest definition, that is the smallest, least robust cell in the study. In the main variant and in two of three neighboring variants: exiting when the streak ends carries more than a fixed term — and does so with less average capital tied up (10.3 instead of 11.6 months for s6).
Is the break a tradeable sell signal? No — the price is already down
The control-arm section shows: selling the moment a streak ends beats a fixed term. Does that mean you can also actively trade the break as a standalone sell signal — selling a position you would otherwise have held, specifically because of the break? A separate event study, independent of the portfolio, addresses this: what happens to the price around the month in which a streak of at least six quarters first breaks?
The basis is 1,265 breaks with a price series (headline figure excluding jump-suspected cases; cross-check across all events: 1,266). All values are excess returns against the S&P 500 Total Return, computed from month-end AFTER the filing month (rel +1) as the conservative, tradeable reading.
| Window | Events | Mean | Median | Share negative |
|---|---|---|---|---|
| tradeable, +1 to +3 months | 1,246 | −0.61% | −0.48% | 52.33% |
| tradeable, +1 to +6 months | 1,206 | −1.06% | −0.69% | 51.24% |
| tradeable, +1 to +12 months | 1,161 | −1.32% | −0.60% | 50.65% |
| not tradeable: filing month (rel 0) | 1,263 | −0.95% | −0.65% | 53.44% |
| not tradeable: month before (rel −1) | 1,265 | −0.69% | −0.82% | 54.23% |
Rel 0 is the month IN WHICH the filing lands — its return includes the days before and is therefore not tradeable. The finding is clear: the drop has already happened in the filing month itself (−0.95%) and partly in the month before (−0.69%). Anyone selling only after the filing sells into a valley that has already occurred — what follows is only a light, steady drift downward of 1.32% on average over twelve months, and with 50.65% negative cases across 1,161 events that is barely more than a coin flip. The break is no longer a tradeable sell signal — but it is not a dip to buy, either.
Does a long streak get safer? Break risk stays constant at roughly one in four
An obvious expectation would be: the longer a streak has already carried, the less often it should break next quarter — an established company should grow more stably than a young one. The base (hazard) rates disprove that:
| reached length (quarters) | Episodes | extended | break | stall |
|---|---|---|---|---|
| 6 | 1,521 | 69.95% | 25.58% | 2.30% |
| 7 | 1,064 | 72.09% | 23.68% | 1.79% |
| 8 | 767 | 69.36% | 25.29% | 2.87% |
| 9 | 532 | 75.56% | 21.24% | 0.56% |
| 10 | 402 | 69.15% | 25.12% | 2.49% |
| 11 | 278 | 70.14% | 25.54% | 1.44% |
| 12 | 195 | 75.38% | 21.03% | 1.54% |
Across all seven lengths from 6 to 12 quarters, the break rate swings only between 21.03% and 25.58%, with no discernible downward trend — it stays constant at roughly one in four. A streak that has already carried ten or twelve quarters is no safer against a break next quarter than one that has just reached six. From length 13 on, the measured break rate swings between 12 and 25 percent — but at only 32 to 147 episodes per length, that is too small a sample to read as a genuine trend.
The Covid special case: more breaks, but a recovery rally instead of a drop
The break rate of active streaks jumps to 52.3% and 50.0% in the first and second quarter of 2020 — against 34.8% to 43.0% the year before, in 2019. Of 1,272 streak breaks overall, 71 fall into this Covid wave. But anyone assuming these breaks pulled the event study's otherwise negative overall picture further down would be wrong — it is exactly the reverse.
| Segment | Events | Mean | Median | Share negative |
|---|---|---|---|---|
| Covid breaks (Q1/Q2 2020) | 69 | +7.19% | +7.84% | 40.58% |
| without Covid breaks | 1,092 | −1.86% | −0.83% | 51.28% |
The 2020 breaks were the recovery cohort — they pull the overall picture UP, not down. As a special case, they show that a break driven by a market-wide shock rather than company-specific weakness can behave differently from the normal case. For the buy signal itself the finding stays robust: excluding every entry between April 2020 and December 2022 (308 of 1,356 positions dropped), the main variant's return dips only slightly from 13.29% to 12.85% per year, and the open-ended hold from 16.00% to 15.32% — the result does not hinge on this one cohort.
Streak versus inflection: arrives earlier, but pays off no better
All sides: twelve-month hold, return per year, period January 2013 to July 2026, conservative count. The prior studies are read in their K|org arm (the fresh inflection cohort with a documented quiet run, grown organically) — the arms are not directly comparable, because this study carries no organic classification (that is a revenue question). The comparison therefore runs the ALLE arm of this study against the K|org arm of both prior studies.
| Backtest | Variant/arm | Positions | Return p.a. conservative | Return p.a. full |
|---|---|---|---|---|
| Earnings Streak (this study) | s6 / ALLE | 1,356 | 13.29% | 13.29% |
| Earnings Streak (this study) | s6 / fresh | 1,256 | 13.30% | 13.30% |
| Revenue Inflection (prior study) | k2_30_70_r15 / K|org | 277 | 16.56% | 26.28% |
| Earnings Inflection (prior study) | g2_30_r15_m2 / K|org | 258 | 6.76% | 6.76% |
| S&P 500 Total Return | — | — | 15.02% | |
The ranking is clear: revenue inflection ahead of the S&P 500 ahead of the streak ahead of the earnings inflection. Yet the streak often signals earliest. Of 912 companies with a streak signal, 136 (14.91%) also carry a revenue inflection; the streak arrives, in the median, 16 months EARLIER (quartiles −56.3 to +18.5 months; 78 companies led with the streak, 56 led with the revenue inflection, 2 on the same month). Of the same 912 companies, 249 (27.30%) also carry an earnings inflection, with a 21-month median lead (142 companies led with the streak, 103 led with the earnings inflection, 4 on the same month).
Excluding the 2013 data edge (only companies of the "fresh" class, 871 instead of 912), the lead survives but shrinks: 133 companies overlap with the revenue inflection (15.27%, 14-month median lead), 244 with the earnings inflection (28.01%, 17.5 months). The finding "the streak signals earlier" survives the counter-check — only the exact number moves a little.
Robustness: the data error, Covid, and the total-loss case
Excluding jump-suspected cases — the headline figure, but no effect in s6
The price history contains reverse splits that were never carried into the adjusted price. Documented case: Vectren (VVC) sits in the record with 5 cents instead of roughly $35 from 2013-09 through 2013-11 and books +70,941% in December. In the event study, that single event raised the mean twelve-month excess return of ALL 1,162 breaks with a complete twelve-month curve from −1.3% to +59.7% — the median stayed almost unchanged at −0.6%. That is why the conservative count (excluding events with a monthly jump above 200 percent) leads everywhere, with the full count shown alongside it.
In the main variant s6's portfolio, the filter affects none of the 1,356 positions — conservative and full counts are identical. Only the smaller s4 variant loses 1 to 2 of roughly 3,209 positions in three of its four holding periods (0.03 to 0.06 percent). The convention still runs the same way everywhere, because it does change something elsewhere (the event study).
Excluding Covid entries (April 2020 through December 2022 dropped)
| Hold | Positions | Return p.a. | positions dropped |
|---|---|---|---|
| 3 months | 1,048 | 10.87% | 308 of 1,356 |
| 6 months | 1,048 | 12.99% | 308 of 1,356 |
| 12 months | 1,048 | 12.85% | 308 of 1,356 |
| as long as the streak lives | 1,048 | 15.32% | 308 of 1,356 |
A streak requires four to twelve consecutive year-over-year comparisons — the 2020 collapse therefore carries it well into 2022. The finding does not flip regardless: at twelve months the return dips only slightly from 13.29% to 12.85%, and at "as long as" from 16.00% to 15.32%. The open-ended hold's edge survives.
The total-loss trace
The price history knows when a series ends, but not why — a takeover premium and a bankruptcy look identical to it. In the main calculation, a delisting is force-sold at the last known price; in the total-loss calculation, that same forced sale costs −100 percent.
| Hold | p.a. with last price | p.a. with total loss | Gap |
|---|---|---|---|
| 3 months | 13.87% | 11.77% | 2.10 pp |
| 6 months | 14.63% | 13.29% | 1.35 pp |
| 12 months | 13.29% | 12.11% | 1.18 pp |
| as long as the streak lives | 16.00% | 14.83% | 1.17 pp |
At a twelve-month hold, 14 of 1,356 positions (1.03 percent) involve a forced sale; 87 positions remain open at the end of the study. The roughly 1.2-percentage-point gap is the honest range of how much rides on the "force-sold at last price" assumption.
How we calculated this
- Base metric. Diluted earnings per share from continuing operations — carried over unchanged from the "Earnings Inflection" backtest: the same tag cascade (IncomeLossFromContinuingOperationsPerDilutedShare, EarningsPerShareDiluted, EarningsPerShareBasicAndDiluted, falling back to quarterly net income divided by the weighted diluted share count), the same point-in-time rule.
- Source. SEC EDGAR XBRL, the public mandatory filings of the US securities regulator. Point-in-time via the filing date (the "filed" field); on restatements, the first reported value counts.
- The cut-off date is the whole point. Calculations use only quarters that were filed with the SEC as of the given month end — never from the quarter end.
- Q4 rule. The fourth quarter is derived at the net-income level from the annual difference, and only then divided by the share count. 13.59% of quarters are derived this way, because the SEC does not require the fourth quarter to be filed separately.
- Small-base guard. A year-over-year comparison only counts with positive earnings in both the base and signal quarter and a net margin of at least 2 percent in the signal quarter. 20.11% of quarters have no revenue and therefore no margin — they never silently count as "margin high enough".
- Portfolio. Equal-weighted, monthly rebalancing, 0.1 percent cost per side, minimum price $1 on the entry date (measured on the raw price, computed on the adjusted one). Purchases happen on an episode's first signal; a running position is not topped up.
- Delisted stocks are included and stay in the portfolio. If a price series ends mid-period, the position is force-sold at the last price — for the main variant s6/m12, that affects 1.03% of the 1,356 positions (14 forced sales). That is why this backtest says anything at all.
- Event study. Runs independent of the portfolio around the break's filing month (rel 0). Rel 0 is the month IN WHICH the filing lands and includes the days before it; the split between rel 0 and rel +1 is therefore blurred, and the tradeable figure from rel +1 is the conservative reading. Only breaks count as events; stall-endings and streaks that end at the data edge sit in the base rates instead.
- Period. January 2013 to July 2026, 163 months.
- Data base. 6,671 CIKs with a quarterly series, 98.37% coverage of the underlying universe's revenue CIKs.
- Cross-check. The monthly series re-aggregated in the report deviate from the ones stored in the portfolio run by 0 percentage points, across all 4 variants × 4 holding periods × 12 arms × 163 months.
Sources. Quarterly earnings and filing dates come from the public mandatory filings of the US securities regulator (10-K/10-Q, machine-readable via EDGAR). Price series and the S&P 500 Total Return benchmark come from our own holdings, carried over unchanged from the revenue and earnings inflection backtests.
What this study does not say
- A streak already running in 2013 had its beginning outside observation. 98 of 912 companies with a streak signal (10.7 percent) carry their first signal in January 2013, the very first month this study looks at. That is not an error, but it is also not a signal that could have been traded in real time — the "edge" class is therefore kept separate from "fresh".
- 13.59% of quarters are derived arithmetically (see methodology) and 20.11% have no margin and drop out of every year-over-year comparison.
- Trades happen on month-end dates, not days. A filing on the 2nd and one on the 30th of the same month lead to the same entry price — and the same blur applies to the event study's filing month.
- The price history contains reverse splits that were never carried into the adjusted price (documented case VVC). Only monthly jumps above 200 percent UPWARD are checked — smaller, unrecorded reverse splits may still sit inside the conservative figure. A 95-percent crash stays in deliberately, because the same threshold applied downward would discard real collapses and flatter the result.
- Taxes and trading spreads are absent. Only 0.1 percent cost per side is modelled, nothing else.
- The event study shows an average, not a single-case forecast. The spread is wide (the "length 8–9" segment averages −2.21%, the "length ≥10" segment only −0.68% — no monotone order by streak length).
- A backtest is not a forecast. This study is market research, not investment advice and not a buy recommendation.
What we did (not) build from this
No live scanner for entries comes out of this backtest. As a buy signal, the streak stays behind the S&P 500 throughout — with or without the Covid cohort, in almost every revenue class. The real finding lies not in the entry but in the exit: holding a position for as long as the underlying streak lives, instead of selling after a fixed term, meaningfully improves the result — in three of the four tested variants, at a shorter average capital commitment. The break itself, by contrast, is worthless as a standalone timing signal: the price is already down in the filing month, and what follows is barely more than a coin flip.
Readers looking for a growth signal that beat the market in the backtest will find it in the Revenue Inflection Backtest Study and in the live scanner of the same name.
Frequently Asked Questions
Two questions in one rule. First: is a streak of rising quarterly earnings a buy signal? A streak is a run of consecutive quarters in which diluted earnings per share from continuing operations sits above the year-ago quarter; a year-over-year comparison only counts with positive earnings in both the base AND the signal quarter and a net margin of at least 2 percent in the signal quarter. Purchases happen at month end, the moment the streak first reaches the variant's threshold (4, 6, 8, or 12 quarters), and are held for 3, 6, or 12 months, or "as long as the streak lives". Second: is the end of that streak, the break, a sell signal? A separate event study around the break's filing month answers that, independent of the portfolio.
No, but narrowly. On the conservative count, the main variant (a streak of at least six quarters) returns 13.29% per year at a twelve-month hold (1,356 positions) against 15.02% for the S&P 500 Total Return — a 1.74 percentage-point gap. Against the equal-weighted universe at 4.77% per year, the streak leads clearly, and its maximum drawdown (−29.11%) stays within the range expected of a single-stock portfolio.
That is the real finding of this study. All four holding periods (3, 6, 12 months, "as long as") run on the SAME entries — only the exit timing differs. At a fixed twelve-month term the return is 13.29%; at "as long as the streak lives" it rises to 16.00% (2.72 percentage points more) — with a shorter average hold of 10.3 instead of 11.6 months. So the streak does not carry as an entry edge, it carries as an EXIT RULE: selling the moment it ends beats holding a stubborn twelve months.
No. Of 1,161 breaks with a complete twelve-month curve, a position sold only at month-end AFTER the filing leaves just 1.32% of average excess return (median 0.60%) against the S&P 500 — and only 50.65% of cases even trail the market, barely more than a coin flip. The actual drop has already happened in the filing month itself (mean −0.95%) and partly the month before that (−0.69%). Selling after the filing means selling into a valley that has already occurred, not ahead of it.
No. The probability that a streak breaks next quarter, instead of extending or stalling, sits at roughly one in four at every reached length between 6 and 12 quarters — from 25.58% at length 6 to 21.03% at length 12, with no discernible downward trend. A streak that has already carried eight or ten quarters is no safer against a break next quarter than one that has just reached six.
Under an identical convention (twelve-month hold, return per year, conservative count), the streak at 13.29% (1,356 positions) sits between the two sibling backtests: the revenue inflection beats it at 16.56% (277 positions), the earnings inflection trails clearly at 6.76% (258 positions). Of 912 companies with a streak signal, 136 (14.91%) also carry a revenue inflection — the streak arrives, in the median, 16 months earlier; 249 (27.30%) also carry an earnings inflection, with a 21-month lead. The streak is thus the earliest of the three signals, but not the most profitable.
Yes, in the breaks. Of 1,272 streak breaks, 71 fell into the 2020 Covid wave — markedly more streaks broke in the first and second quarter of 2020 than in the year before. Their price reaction, though, is the opposite of the overall finding: the 69 Covid breaks with a complete curve return, on average, +7.19% of excess return over the following twelve months (a recovery rally), while the remaining 1,092 breaks return −1.86% on average. As a buy signal the finding stays robust: excluding every entry between April 2020 and December 2022 (308 of 1,356 positions dropped), the main variant's return dips only slightly to 12.85% per year.


