Dilution Brake Backtest: The Heaviest Diluters Fall Well Behind the Market — Minus 7.44% Against 15.02% per Year
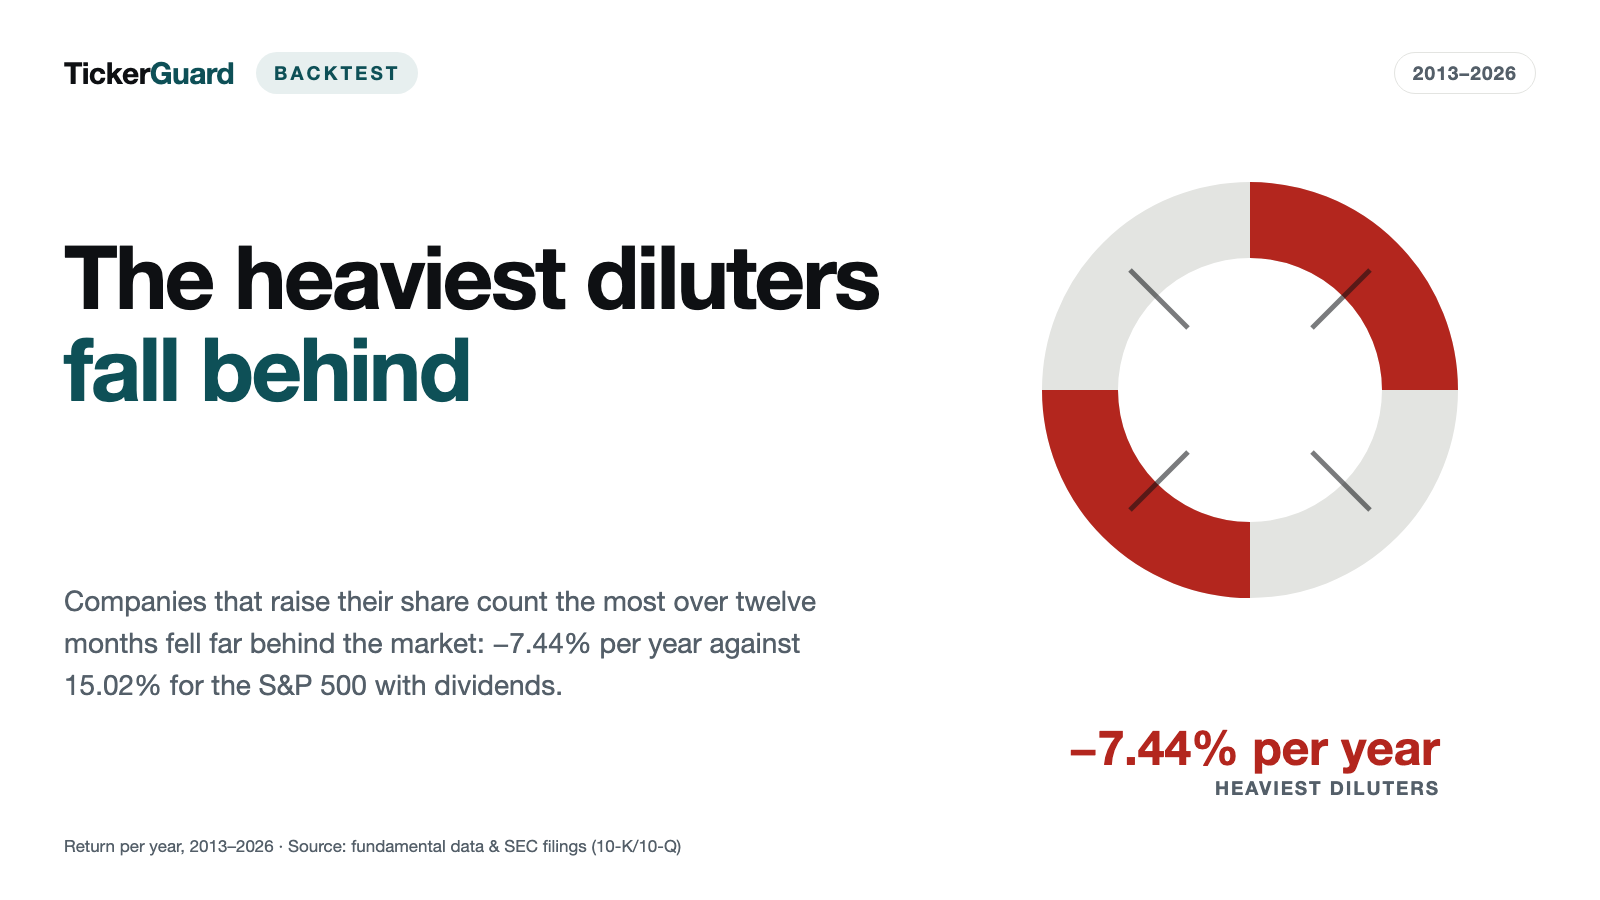
Not every share issuance is a warning sign — but the companies that inflate their own share count the most over twelve months fell clearly behind both the market and their own peer universe in our backtest. We ran this across 13.5 years and 6,684 companies with a usable share-count grid, using both decile ranks AND fixed thresholds, a cohort entry four months after quarter-end, and a guard against stock splits and consolidations. The conservative headline number — excluding suspicious price-jump positions — puts the heaviest-dilution decile at −7.44% per year against 15.02% for the S&P 500 Total Return. Read this study as a SCREEN-OUT filter: it tells you which stocks to be wary of, not what to buy.
 Thomas Mücke
Founder & Publisher
Thomas Mücke
Founder & Publisher
The Question: Do Heavy Diluters Trail the Market?
Companies issue new stock continuously — through option programs, convertible notes, capital raises — diluting every existing share along the way. Academic research has argued for decades that the heaviest diluters underperform afterward. This study is deliberately built as a screen-out filter: the point is which stocks to avoid when a company's own share count is rising sharply, not to manufacture a new buy signal. The net-buyback arm runs alongside purely for documentation, as a bridge to the already-published cannibal turn study.
We tested this across 13.5 years. The expanded universe covers 6,684 companies with 234,986 company-quarters; inside the January 2013 to July 2026 measurement window it is 6,422 companies with 205,720 company-quarters. The expansion therefore clears the pre-registered minimum threshold of 1,000 additional companies by a wide margin.
The result in four numbers
Do companies that inflate their own share count the most within twelve months fall behind both the market and their own peer universe? We tested that across 13.5 years (January 2013 to July 2026) of US stocks. Four numbers carry the result:
- −7.44% per year is what the heaviest-dilution decile (D10) returned in the backtest, on the conservative count — excluding the price-jump suspects it contains.
- 15.02% is what the S&P 500 Total Return returned over the same months — 22.46 points more than the heaviest-dilution decile.
- 11.49% per year is what the mirror arm returned: companies with documented net buybacks (rueck_cash) — 5.53 points above the study's own peer universe (5.96%), yet still below the S&P 500.
- 2.30% is what the heaviest-dilution decile returned among companies above $100 million in revenue — not negative, but 7.08 points behind its own universe in the same size band (9.38%).
Across the test window from January 2013 to July 2026, the heaviest-dilution decile trailed both the market and its own peer universe, while the buyback mirror arm reached its own universe but not the market.
The Signal: How We Measured Dilution
- Metric. The twelve-month change in shares outstanding: the share count in a given calendar-quarter label against the one four labels earlier, in percent.
- Point-in-time. Dated to the latest filing date across the entire five-quarter stretch, not just its two endpoints — the split guard's verdict is only final once the quarters in between were on file too.
- Entry. The whole cohort buys on the SAME day: at the closing price four months after quarter-end. Letting each company buy in its own filing month would be a look into the future for a rank-based metric — the decile forms relative to the whole cohort, and an early buyer only knows a fraction of it. Four months, because only then is roughly 96 percent of the metric public in EVERY calendar quarter (the year-end quarter's figure sits in the annual report, with its 90-day deadline). The buy date doubles as the visibility cutoff: 8,364 company-quarters (4.8%) file late and drop out of their cohort.
- Deciles. Ten equal-sized baskets by rank, per quarterly cohort — D1 the sharpest shrinkage, D10 the heaviest dilution. Per cohort, not across the whole period, or the calendar year would decide the decile.
- Fixed thresholds. A decile is a relative rank and says nothing about the SIZE of dilution. The literature reports the effect as explicitly nonlinear in magnitude (Fama/French 2008: only the top issuance quintile, averaging 20–26% issuance, carries the effect reliably). Fixed thresholds above 3%, 10%, and 25% make that comparable.
- Mirror arm. Net buybacks (share count fell), plus a cash-proof variant requiring an actual buyback payout in the cash-flow statement within the twelve-month window — the bridge to the cannibal turn backtest.
The Result: Heavy Diluters Fall Clearly Behind
This study's HEADLINE NUMBER is the conservative count — excluding suspicious price-jump positions. An unadjusted stock consolidation produces both a price jump AND an apparent share-count shrinkage at once; both errors point the same way and favor the bottom decile. Around 1.0% of the universe's positions (330 of 31,898) carry such a jump — and they lift the universe's full annual return from 5.96% to 124.35%. That "full" universe figure never appears as a result in this study and is shown here only to illustrate the gap to the conservative number.
| Run | Positions | of which price-jump suspect | p.a. conservative | p.a. full | p.a. total-loss (full) | Δ vs. S&P TR | Δ vs. own universe | Median per position (full) | Hit rate (full) | Max drawdown (conservative) |
|---|---|---|---|---|---|---|---|---|---|---|
| d1 (sharpest shrinkage) | 4,736 | 24 | 11.18% | 32.11% | 28.12% | −3.84 pp | 5.22 pp | 6.76% | 59.7% | −36.45% |
| d10 (heaviest dilution) | 4,195 | 96 | −7.44% | 32.64% | 11.49% | −22.46 pp | −13.40 pp | −15.96% | 38.6% | −76.84% |
| v3 (dilution > 3%) | 11,432 | 192 | 0.79% | 36.81% | 20.96% | −14.23 pp | −5.17 pp | −5.34% | 44.6% | −57.60% |
| v10 (dilution > 10%) | 6,861 | 139 | −4.06% | 46.12% | 25.80% | −19.08 pp | −10.02 pp | −12.64% | 40.5% | −71.09% |
| v25 (dilution > 25%) | 3,450 | 82 | −8.39% | 38.49% | 13.85% | −23.41 pp | −14.35 pp | −18.76% | 36.5% | −77.53% |
| rueck (net buybacks) | 11,276 | 47 | 10.68% | 83.90% | 78.40% | −4.34 pp | 4.72 pp | 7.53% | 60.2% | −34.09% |
| rueck_cash (with cash proof) | 9,401 | 19 | 11.49% | 75.51% | 70.75% | −3.53 pp | 5.53 pp | 8.41% | 61.8% | −33.05% |
| univ (own universe) | 31,898 | 330 | 5.96% | 124.35%* | 108.17% | −9.06 pp | 0.00 pp | 1.77% | 52.3% | −36.02% |
| S&P 500 Total Return | — | — | 15.02% | — | — | — | — | — | −23.87% | |
* The full universe figure is a data-error artifact (explained above) and is never used as a result in this study — it is shown only to put the conservative number in context.
The heaviest-dilution decile (D10) therefore sits 22.46 percentage points behind the S&P 500 Total Return and 13.40 points behind the study's own peer universe. At a fixed threshold above 25% dilution (v25) the result is a similarly deep −8.39%. The mirror side confirms the direction: companies with the sharpest share-count shrinkage (D1), and even more so documented buybacks (rueck_cash), sit clearly above the study's own peer universe. No arm of this study reaches the S&P 500 Total Return, however — that is the gap between a broad, equal-weighted US universe and a cap-weighted large-cap index, not a finding about dilution.
The Deciles in Sequence
The ten deciles do not fall in a smooth line — they trace a shape that matches the nonlinearity Fama/French 2008 report: the return only turns clearly negative in the top decile.
| Decile | Avg. lower bound | Avg. upper bound | Positions | of which counted conservatively | p.a. conservative |
|---|---|---|---|---|---|
| D1 | −30.24% | −3.17% | 4,736 | 4,712 | 11.18% |
| D2 | −3.16% | −0.91% | 6,076 | 6,064 | 11.04% |
| D3 | −0.91% | −0.01% | 6,130 | 6,088 | 10.34% |
| D4 | −0.01% | 0.29% | 5,762 | 5,693 | 7.08% |
| D5 | 0.29% | 0.75% | 6,548 | 6,505 | 7.72% |
| D6 | 0.75% | 1.52% | 6,537 | 6,492 | 8.50% |
| D7 | 1.53% | 3.20% | 6,177 | 6,127 | 8.56% |
| D8 | 3.21% | 8.07% | 5,648 | 5,584 | 6.56% |
| D9 | 8.10% | 21.01% | 5,089 | 5,002 | 0.65% |
| D10 | 21.06% | 188.23% | 4,195 | 4,099 | −7.44% |
The Spearman rank correlation between decile and annual return sits at −0.879 on the conservative count (at a six-month hold: −0.891) — a clearly declining relationship. On the full, data-error-laden count it drops to −0.321: there, the price-jump artifact eats the signal, another reason the full figure never counts as a result.
"a more serious stain on the net stock issues anomaly"
— that is how Fama and French (2008, Journal of Finance) describe the complete absence of predictive power for share issuance in periods before the 1960s, a finding that calls the anomaly itself into question. Our measurement window, 2013–2026, sits entirely within the period the authors consider the effect robust.
Benchmarks: Why the Own Universe Is the Right Yardstick
| Benchmark | p.a. | Max drawdown |
|---|---|---|
| S&P 500 Total Return | 15.02% | −23.87% |
| Price universe, equal-weighted | 4.77% | −53.23% |
| Own universe, equal-weighted (run univ, 12-month hold, conservative) | 5.96% | −36.02% |
For a decile study, the own universe is the real yardstick: it contains exactly the companies the deciles are drawn from. The other two benchmarks contain companies that never had a usable share count at all — measured against them, every decile difference would be conflated with a universe difference.
Size Cut: At Large Companies, D10 Is Not Negative, Just Weaker
Above $100 million in revenue is the class where a rule would actually be tradable. There, the picture shifts noticeably:
| Run | Positions | of which price-jump suspect | p.a. conservative | p.a. full | Median per position (full) | Hit rate (full) |
|---|---|---|---|---|---|---|
| d1 (sharpest shrinkage) | 3,976 | 9 | 11.84% | 13.18% | 8.05% | 61.4% |
| d10 (heaviest dilution) | 1,203 | 9 | 2.30% | 4.32% | −0.71% | 49.3% |
| v3 (dilution > 3%) | 5,404 | 30 | 8.06% | 27.35% | 1.75% | 52.3% |
| v10 (dilution > 10%) | 2,459 | 13 | 3.40% | 29.63% | −0.55% | 49.2% |
| v25 (dilution > 25%) | 912 | 8 | −0.24% | 2.21% | −3.09% | 46.5% |
| rueck (net buybacks) | 9,437 | 18 | 11.42% | 71.89% | 8.27% | 61.5% |
| rueck_cash (with cash proof) | 8,172 | 13 | 11.72% | 76.09% | 8.88% | 62.3% |
| univ (own universe) | 21,022 | 70 | 9.38% | 53.72% | 5.07% | 56.9% |
Among large companies, D10 is NOT negative at 2.30% — but trailing its own universe in the same size band (9.38%) by 7.08 points, it is clearly weaker, and at a fixed threshold above 25% dilution (v25) it does tip slightly negative even among the large names (−0.24% from 912 positions). The overall shortfall thus concentrates disproportionately in small, often barely tradable names: in the overall run (arm ALL, not in this size cut) the $1 minimum price discards 3,750 episodes in D10, against just 319 in the opposite decile, D1. The reported D10 figure is therefore the return of TRADABLE diluters — this caveat belongs alongside every citation of the number.
Bridge to the Cannibal Finding: The Buyback Arm Confirms the Mirror Thesis
Net buybacks with a cash proof (rueck_cash, 9,401 positions) return 11.49% per year — 5.53 points above the study's own peer universe, but 3.53 points below the S&P 500 Total Return, at the highest hit rate of any run (61.8%). That is this study's mirror side: companies that bought back stock and backed it with real cash payouts outperformed those that diluted, in this backtest.
That confirms the core finding of the already-published cannibal turn study: there, the BEGINNING of a buyback program after years of dilution beats the market (17.90% against 15.02% per year), while plain buyback habit without that transition falls short. This study measures something different — ongoing twelve-month direction rather than a turning-point event — but both backtests point the same way: returning capital beats raising it.
Robustness: Covid, Merger Artifacts, Gap Rows
Excluding entries from 2020 to 2022 shifts the level — down for most runs, slightly up for the two middle dilution thresholds v3 and v10. The finding itself holds either way: even without those entry vintages, the heaviest-dilution decile is clearly negative and sits far behind its own universe.
| Run | Positions | p.a. conservative | p.a. main run | Excluded |
|---|---|---|---|---|
| d1 (sharpest shrinkage) | 3,644 | 6.72% | 11.18% | 1,092 of 4,736 |
| d10 (heaviest dilution) | 3,201 | −5.38% | −7.44% | 994 of 4,195 |
| v3 (dilution > 3%) | 8,587 | 1.89% | 0.79% | 2,845 of 11,432 |
| v10 (dilution > 10%) | 5,067 | −1.89% | −4.06% | 1,794 of 6,861 |
| v25 (dilution > 25%) | 2,536 | −6.39% | −8.39% | 914 of 3,450 |
| rueck (net buybacks) | 8,936 | 6.62% | 10.68% | 2,340 of 11,276 |
| rueck_cash (with cash proof) | 7,453 | 7.37% | 11.49% | 1,948 of 9,401 |
| univ (own universe) | 25,136 | 3.72% | 5.96% | 6,762 of 31,898 |
Excluding merger artifacts (tickers that end after a merger even though the company keeps operating under a new name) changes almost nothing — d10 stays at −7.44% (0 of 4,195 positions excluded), univ moves by only 3 of 31,898 positions. The robustness cut including gap rows (company-quarters whose five-quarter stretch has a gap, excluded from the main run) also confirms the picture, using its own decile boundaries: d1 11.14% (−0.04 pp), d10 −7.51% (−0.07 pp), univ 5.79% (−0.17 pp) — the finding does not hinge on the excluded gap rows.
Simulation Hook: What a Dilution Exclusion Does to Two Existing Buy Rules
To test the metric not only in isolation but also as a filter layered over an existing buy signal, we added a simple exclusion to two running rules (E7 and SB15): a purchase is skipped when the stock's dilution exceeds the chosen threshold. Stocks without a usable metric are let through and counted separately — otherwise the comparison would measure the fundamental data's coverage gap instead of the signal itself. This chapter runs on a DIFFERENT period than the rest of the study: January 2000 to July 2026.
| Run | Threshold | p.a. | Δ vs. unfiltered | Max drawdown | Buys | Avg. positions per month | No metric (name-months) | Hit rate |
|---|---|---|---|---|---|---|---|---|
| E7 (unfiltered) | — | 14.38% | — | 53.08% | 7,942 | 282.2 | — | 56.6% |
| E7-V3 | > 3% | 14.64% | +0.25 pp | 50.31% | 5,744 | 206.0 | 1.28% | 58.0% |
| E7-V10 | > 10% | 14.98% | +0.59 pp | 51.89% | 6,773 | 243.3 | 2.01% | 57.2% |
| SB15 (unfiltered) | — | 15.58% | — | 51.50% | 9,579 | 225.7 | — | 47.5% |
| SB15-V10 | > 10% | 16.53% | +0.96 pp | 50.72% | 8,116 | 195.6 | 2.39% | 48.4% |
The filter carries in both rules, most clearly at SB15-V10 with nearly a full percentage point of edge. Metric coverage at the actual buys is 95.2% (E7: 7,557 of 7,942 buys) and 94.8% (SB15: 9,084 of 9,579 buys), leaving 4.85% and 5.17% of buys without a metric. The percentage column in the table counts a different unit — name-months, because a blocked name is re-checked every month; it is therefore lower and cannot be converted into buys. The key caveat: the average number of positions per month drops by 30.2 to 76.2 names versus the unfiltered run — part of the edge is concentration, not signal alone. This is a simulation hook, not a buy recommendation — it shows what the exclusion would have done inside two existing rules, not that a standalone tool should follow from it.
Post-Hoc Split: How Did Heavy Diluters Fare in the Revenue Accelerator Portfolio?
Would the already-published revenue accelerator backtest have performed better if the heaviest diluters had been left out? This is a POST-HOC SPLIT of positions already bought, and therefore a WEAKER claim than an actual buy filter — it only shows how the already-purchased portfolio breaks down, not what a filter would have bought instead. Freed-up capital, a changed portfolio size, and the concentration effect all stay unmeasured.
| Arm | Subset | Positions | Months holding | p.a. over 163 months |
|---|---|---|---|---|
| ALL | Dilution > 10% | 628 | 162 of 163 | 16.15% |
| ALL | Dilution ≤ 10% | 1,789 | 162 of 163 | 16.96% |
| ALL | no usable metric | 267 | 162 of 163 | 13.89% |
| K|org | Dilution > 10% | 52 | 158 of 163 | 1.85% |
| K|org | Dilution ≤ 10% | 218 | 162 of 163 | 33.95% |
| K|org | no usable metric | 7 | 60 of 163 | −10.91% |
The gap is widest in the K|org (organic growth) arm: 1.85% against 33.95% per year. In the broader ALL arm the difference is far smaller (16.15% against 16.96%). All four figures rest on the same basis, the full 163 months, with months holding no position counting flat. That matters because the subsets were invested for different lengths of time: in the K|org arm the heavily diluting subset held a position in only 158 months, the lightly diluting one in 162, and the names without a usable metric in just 60. Comparing a subset against the full series would be misleading, which is why only subset-against-subset within the same row is shown here.
Source Split: Does the Type of Dilution Explain the Shortfall?
Did the top deciles' dilution come from a capital raise or from share-based compensation? 24,243 of 33,071 D9/D10 company-quarters can be classified (73.3%, above the 50% cutoff rule). The share column of the table below refers to all 33,071 company-quarters; the positions and median columns count portfolio positions instead — two different units that must not be converted into one another.
| Class | Share of the 33,071 company-quarters | Company-quarters | Positions in the portfolio (full) | Median return (full) |
|---|---|---|---|---|
| capital raise (also mixed) | 11.6% | 3,821 | 1,041 | −7.04% |
| capital raise only | 6.0% | 1,982 | 393 | −0.20% |
| share-based compensation only | 52.7% | 17,442 | 5,413 | −12.16% |
| unclear | 26.7% | 8,828 | 2,151 | −9.93% |
| share-based compensation (also mixed) | 3.0% | 998 | 286 | −7.51% |
Finding: every class sits in negative median territory — the source of dilution does NOT explain the shortfall. Convertible notes remain a documented blind spot (conversion raises the share count without ever appearing in either measured figure), and share-based compensation is an EXPENSE, not a share count — the split classifies, it does not measure with full precision.
What the Literature Says
Methodologically, this study sits closest to Pontiff/Woodgate (2008, Journal of Finance): a short-term log difference in share count, without routing through market capitalization. There, the Fama-MacBeth regression slope is −2.23 (t = −7.08) — issuance reliably predicts negative subsequent returns. Daniel/Titman (2006, Journal of Finance) measure a slope of −0.651 (t = −4.28) with their five-year composite issuance measure. Fama/French (2008) report slopes of −1.94 to −1.49 across all size classes and the decisive nuance: only the top issuance quintile, averaging 20 to 26 percent issuance, carries reliably negative returns — the middle quintiles, with 0.1–1.5% issuance, actually show slightly positive returns. Our own D10 lower boundary averages 21.06% — landing squarely in that same range.
McLean/Pontiff (2016, Journal of Finance) measure an average decay of 58 percent for 97 published return predictors after publication — investors learn from academic papers and partially arbitrage the anomaly away. Our measurement window, 2013–2026, sits ENTIRELY after the publication of all four original papers (2006 to 2016); a weaker result than in the originals would therefore be the expectation. We did not observe that here: the top decile still sits clearly in negative territory at −7.44%, in the same nonlinear shape Fama/French report. Unlike many other published anomalies, the expected decay has not become visible in this window.
How We Calculated This
- Source. Public mandatory filings of the US Securities and Exchange Commission via SEC/EDGAR (10-K/10-Q), compressed into a calendar-quarter grid.
- Cohort entry. The whole cohort buys four months after its shared quarter-end (a convention following Fama/French 2008, who use six) — not each company in its own filing month, which would be a look into the future for a rank-based metric. 8,364 of the 175,471 usable company-quarters inside the measurement window (4.8%) file late and drop out of their cohort.
- The share-count grid is a MIX, not predominantly cover-page data. Measured across 500 random companies with 19,756 quarters: 63.3% come from the balance-sheet-date count (us-gaap:CommonStockSharesOutstanding), 22.1% from the period-average count (WeightedAverageNumberOfDilutedSharesOutstanding), and only 14.6% from the cover page (dei:EntityCommonStockSharesOutstanding). The description "point-in-time cover-page figures" does NOT hold for the majority of grid rows — what remains true is that the filing date consistently decides. Where numerator and denominator come from different sources, the last decimal can shift; in the heaviest-dilution range this study is about, that mixed case affects 7.45% of the metrics (own sample: all 33,071 D9/D10 company-quarters). Direction and magnitude stay demonstrably stable.
- Split guard. A quarter-over-quarter jump below −30% or above 50% excludes that row from decile formation (13.2% of metric rows). The guard also sweeps up genuine, very large capital raises — part of the very top decile this study is about.
- Gap-row robustness. 3.2% of the metric rows across the whole grid — inside the 2013 to 2026 measurement window it is 1.8% — have a gap in their five-quarter stretch and are excluded from the main run — ALL of the dataset's extreme values sit there (up to over 1.7 million percent). The robustness cut with its own decile boundaries confirms the finding, as shown above.
- Covid-free. Excluding entries from 2020 to 2022 shifts the level, and the finding holds (see the robustness chapter).
- D10 penny-stock caveat. The $1 minimum price discards 3,750 episodes in the heaviest-dilution decile, versus just 319 in the lowest. The D10 figure is the return of TRADABLE diluters, not of the full pool before the price filter.
- Delisting and total-loss sensitivity. Delisted stocks stay in the portfolio and are force-sold at the last available price; a total-loss second calculation, setting every forced sale to −100%, runs alongside every table — it is computed on the FULL, not the conservative, dataset and is therefore not directly comparable to the headline number.
- Hand check. 5 cases (Logiq, DuPont, GEE Group, Q2 Holdings, Extreme Networks) checked live against the SEC EDGAR primary source — value, year-ago value, percentage, filing date, and split flag matched exactly in all 5 cases.
- Period. January 2013 to July 2026, 163 months. Portfolio equal-weighted, monthly rebalancing, 0.1% cost per side, minimum price of $1 at entry. The E7/SB15 filter chapter deviates and runs from January 2000 to July 2026.
- Cross-check. The figures re-aggregated for this report deviate from those stored in the portfolio run by no more than 1.0E-9 percentage points.
Price series and the S&P 500 Total Return benchmark come from our own US stock price archive, including delisted names. Share counts and filing dates come exclusively from the US Securities and Exchange Commission's public mandatory filings.
What This Study Does Not Say
- A live tool after all, since 2026-08-10 — in three scanners. On the owner's decision, after a review of which scanners in the category actually supply the measurement base, the dilution screen has run since 2026-08-10 in "Organic Hypergrowth in an Uptrend", "Growth Gems: 7-Point Recipe" and "Revenue Inflection". The other seven scanners in the category are unchanged. A missing share count lets a company through — that is how it was measured here too. Coverage against the live roster on 2026-08-10 was 99.65% (279 of 282 hits had a usable quarterly window, 2 had only one, one had none).
- The source of dilution does not explain the shortfall. Capital raises, share-based compensation, and unclear cases all sit in negative median territory (see "Source Split").
- The sharpest shortfall sits with small, often barely tradable names. Above $100 million in revenue, D10 is not negative, just clearly weaker (+2.30%); the $1 minimum price discards 3,750 episodes in the top decile.
- The filter hook is a simulation, not a running rule. The portfolio shrinks by an average of 30 to 76 positions versus the unfiltered run — part of the edge is concentration, not pure signal. All filter figures are also in-sample: thresholds and the staleness cutoff were not confirmed on a separate period.
- The accelerator split is a POST-HOC cut of positions already purchased, not a statement about what an actual buy filter would have bought instead.
- Split-suspect rows (13.2%) and gap rows (3.2%) are excluded. The guard also sweeps up genuine, very large capital raises — nothing is corrected; computing a split factor from the jump size would mean measuring one's own assumption.
- The share-count grid does not sit predominantly on cover-page figures (only 14.6%) — the majority comes from balance-sheet-date and average counts, with a mixed case affecting 7.45% of checked metrics.
- Publication timing. The measurement window sits entirely after the publication of all four cited original papers; decay of the effect would be the expectation per McLean/Pontiff (2016). We did not observe it here — a favorable condition for this backtest, not a guarantee for the future.
- A backtest is not a forecast. This study is market research, not investment advice, and not a buy recommendation.
The mirror side of this finding — the BEGINNING of a buyback program as a standalone buy signal — is covered in the cannibal turn study. For how a related growth signal performs on the same universe, see the revenue accelerator study, whose positions are measured in the "Post-Hoc Split" chapter above.
Frequently Asked Questions
The twelve-month change in a company's shares outstanding, drawn from SEC filings and compressed into a calendar-quarter grid. The entire buy cohort trades on the same day: at the closing price four months after their shared quarter-end — only by then is roughly 96 percent of the metric public in every calendar quarter. Each quarterly cohort is split into ten equal-sized deciles by rank, plus fixed thresholds at 3%, 10%, and 25% dilution, because the literature describes the effect as nonlinear.
Yes, clearly. On the conservative count — excluding positions with a suspicious price jump — the heaviest-dilution decile (D10) returns −7.44% per year, 22.46 points below the S&P 500 Total Return (15.02%). The decile holds 4,195 positions, 96 of which are dropped from the headline figure as price-jump suspects. At a fixed threshold above 25% dilution the figure is −8.39% (3,450 positions, 82 of them excluded). Companies with the sharpest share-count shrinkage (D1, 4,736 positions) sit at +11.18% by comparison.
A screen-out filter. This study shows which stocks to be wary of buying — not what to actively buy. The buyback arm is documentary only, not a trading recommendation, and there is deliberately no scanner built on this finding. Folding it into a tool is not part of this study.
This study's buyback arm is the mirror side: net buybacks with a documented cash payout (9,401 positions) return 11.49% per year, clearly ahead of the study's own peer universe, though still below the broad market. That confirms the core finding of the cannibal turn study — that the BEGINNING of a buyback program is a more durable signal than dilution alone.
It weakens. Among companies above $100 million in revenue, the heaviest-dilution decile sits at +2.30% (1,203 positions) — not negative, but clearly weaker than its own universe in the same size band (9.38%). The sharpest shortfall concentrates in small, often barely tradable names: the $1 minimum price discards 3,750 episodes in the top decile against 319 in the opposite one.
That can be classified for 73.3% of the D9/D10 company-quarters, but it does NOT explain the shortfall: capital raises (−7.04% median), share-based compensation only (−12.16%), and unclear cases (−9.93%) all sit in negative territory. The source does not separate better-performing diluters from worse ones.


