Cannibal Turn Backtest: Buyback Beginnings Beat the Market, Habit Does Not — 17.90% Against 15.02% per Year
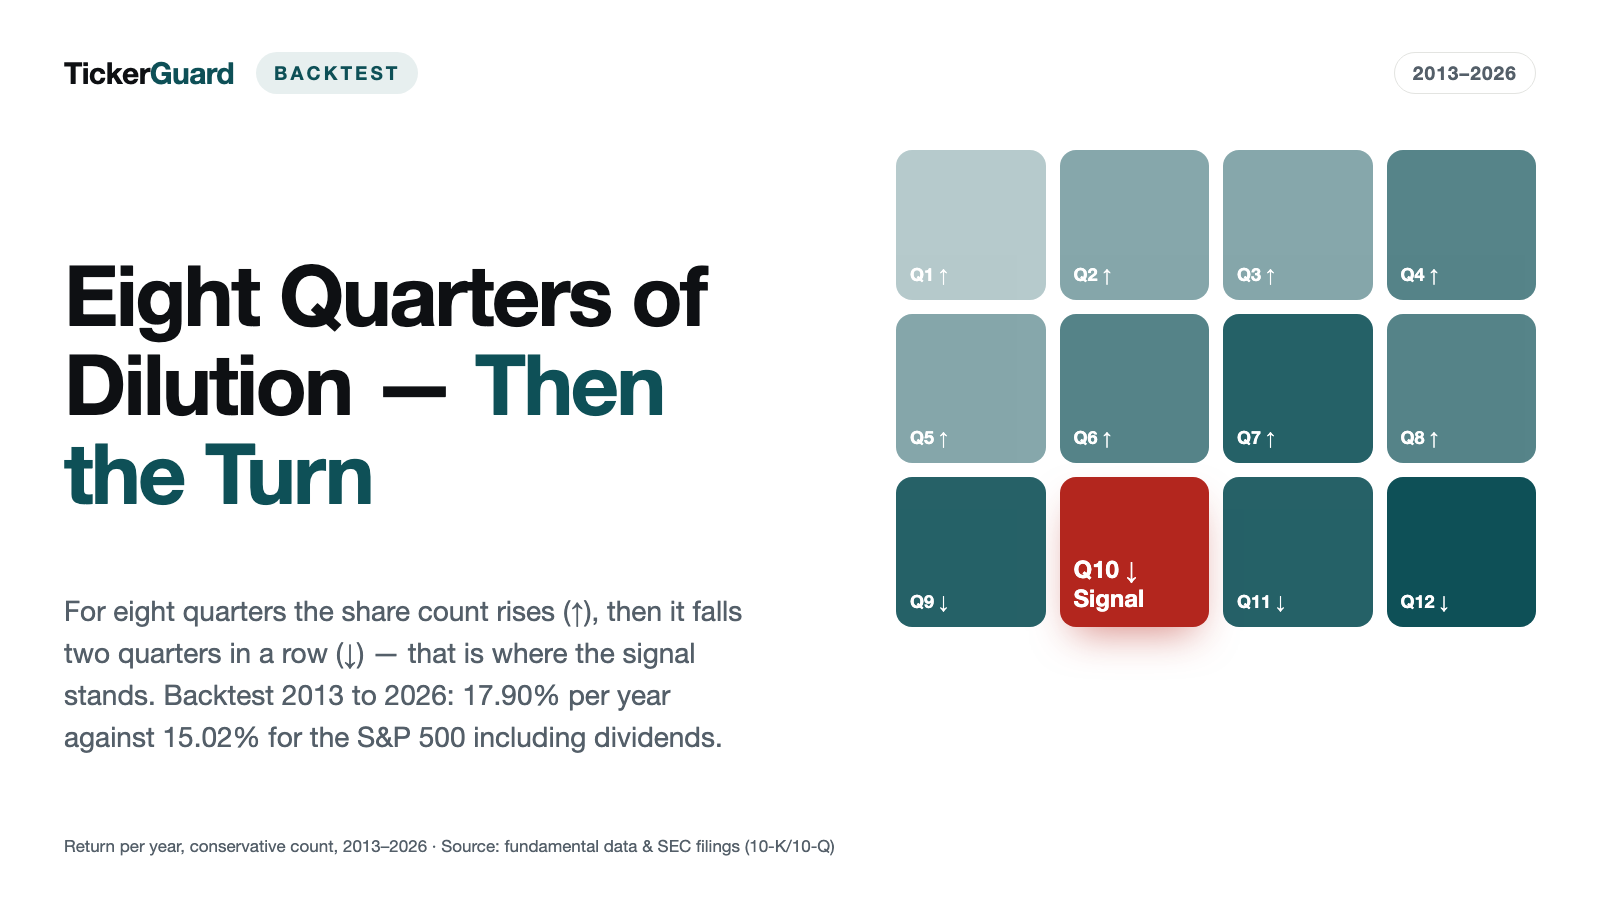
A company that has issued more and more of its own stock for years, then for the first time starts buying it back and sustains it — is that BEGINNING a better signal than mere habit? We tested this "cannibal turn" across 13.5 years and roughly 2,800 companies with a usable share-count grid, with delisted stocks left in the portfolio, a mandatory cash proof from the cash-flow statement, and two guards against reverse and forward stock splits. The conservative count — excluding positions with a suspicious price jump — returns 17.90% per year against 15.02% for the S&P 500 Total Return. The control arm of HABITUAL buyers stays clearly below that at 13.13%: the beginning carries the edge, the habit does not.
 Thomas Mücke
Founder & Publisher
Thomas Mücke
Founder & Publisher
The Question: Is the FIRST Buyback After Years of Dilution a Buy Signal?
Companies issue new stock year after year — through option programs, convertible notes, capital raises — diluting every existing share along the way. When such a company stops for the first time in a sustained way and starts buying its own stock back instead, that is a visible shift in capital management. The natural question: is this BEGINNING a stronger buy signal than a company that has bought back stock habitually for years? We tested this across 13.5 years, using buyback figures from roughly 2,800 companies with a usable share-count grid.
The result in four numbers
Does a company that starts sustainably buying back its own stock for the first time after years of dilution go on to beat the market — or does mere buyback habit carry just as well? We tested both against the S&P 500 across 13.5 years. Four numbers carry the result:
- 17.90% per year is what the buyback BEGINNING returned at a twelve-month hold, on the conservative count excluding suspicious price-jump positions (94 positions) — this study's headline number.
- 15.02% is what the S&P 500 Total Return returned over the same period — the cannibal turn narrowly stayed ahead of it.
- 13.13% is what the HABITUAL-buyer control arm returned (348 positions) — less than the index. The edge comes from the beginning of buying back, not from the habit.
- 14.68% is what remained at twelve months once entries from the Covid years 2020 to 2022 are excluded (77 positions, full count) — a substantial share of the full edge comes from that period.
In the tested window, the beginning of buying back narrowly beat the market, plain habit fell short of it, and a substantial part of the edge came from the Covid years.
The Signal: How We Defined the Cannibal Turn
A cannibal turn needs two phases and a cash proof, plus two guards against data artifacts:
- History. The eight quarters immediately before the first decline quarter never fall by more than 0.25 percent in any single step (a rounding tolerance for cover-page counts) and rise by at least 3 percent over the whole stretch — real, sustained dilution.
- Turn. Afterward, at least two consecutive quarters whose share count sits at least 1 percent below its year-ago quarter, with no gap in the quarterly sequence.
- Cash proof (mandatory). Across the decline quarters, the sum of reported buyback payments must be greater than zero. If the buyback line is missing entirely for a decline quarter, that decline counts as unproven and yields no signal — a reported zero is different from a missing line.
- Reverse-split guard. If the share count falls by more than 30 percent from one quarter to the next inside the turn window, that is a share consolidation, not a buyback — no signal.
- Forward-split guard. If the share count rises by more than 50 percent from one quarter to the next inside the history window, the apparent "dilution" is a stock split — no signal.
- Entry. At month-end, once the required figures were actually visible by their filing date (a monthly grid tied to filing visibility) — never backdated to the quarter end.
As a check, a second, independent arm runs alongside: dauer12, the HABITUAL buyers. Here at least twelve unbroken quarters of year-over-year decline count, with no condition on the years before, and cash proof over the last four decline quarters. If habitual buyers perform just as well as a fresh turn, the turn rule measures nothing of its own — that is exactly what the control arm checks.
The Result: The Buyback Beginning Narrowly Beats the Market
This study's headline number is the conservative count excluding suspicious price-jump positions (reasoning in the robustness chapter): at a twelve-month hold, the cannibal turn returns 17.90% per year from 94 positions against 15.02% for the S&P 500 Total Return — an edge of 2.88 percentage points. The full count (95 positions, including the suspicious ones) stands at 21.29% alongside it, the total-loss count (every forced sale set to −100%) at 13.99%.
| Variant | Holding period | Positions | Return p.a. (full) | Δ vs. S&P TR | Hit rate | Max drawdown | p.a. total-loss count |
|---|---|---|---|---|---|---|---|
| Cannibal turn (w2_r1_h8) | 3 months | 98 | 18.76% | 3.74 pp | 54.1% | −56.97% | 18.76% |
| Cannibal turn (w2_r1_h8) | 6 months | 98 | 27.29% | 12.27 pp | 63.3% | −31.70% | — (micro-portfolio artifact) |
| Cannibal turn (w2_r1_h8) | 12 months | 95 | 21.29% | 6.27 pp | 65.3% | −37.59% | 13.99% |
| Cannibal turn (w2_r1_h8) | as long as held | 94 | 18.16% | 3.14 pp | 72.3% | −40.34% | 15.34% |
| Habitual buyers (dauer12, control) | 3 months | 354 | 7.89% | −7.13 pp | 55.6% | −67.63% | 7.89% |
| Habitual buyers (dauer12, control) | 6 months | 354 | 16.57% | 1.55 pp | 64.4% | −45.37% | 15.45% |
| Habitual buyers (dauer12, control) | 12 months | 348 | 13.13% | −1.90 pp | 66.7% | −43.26% | 11.24% |
| Habitual buyers (dauer12, control) | as long as held | 305 | 13.74% | −1.29 pp | 71.8% | −34.99% | 12.51% |
| S&P 500 Total Return | — | — | 15.02% | — | −23.87% | — | |
| Universe, equal-weighted | — | — | 4.77% | — | −53.23% | — | |
The dash in the "p.a. total-loss count" column at 6 months is not a calculation error but a micro-portfolio artifact: in 64 of 157 invested months, the equal-weighted portfolio of the six-month variant holds at most two positions (median 3 names per month). If a forced sale falls specifically into a month where the portfolio holds only a SINGLE position, the total-loss count sets the ENTIRE month's portfolio return to −100 percent (with two positions held it would be −50 percent), and the compounded series can no longer be meaningfully annualized afterward. The real count alongside it (27.29% full) is unaffected — but it, too, points to a very small portfolio, as the next chapter shows.
The Control Arm: Beginning Beats Habit
This study's core finding sits in the comparison of both arms at a twelve-month hold: the fresh cannibal turn returns 21.29% per year (95 positions), habitual buyers only 13.13% (348 positions) — 1.90 percentage points BELOW the S&P 500. Across all four holding periods, the control arm trails the main variant throughout, and at three months, twelve months, and as long as held, it even trails the index itself — only at six months does it stand slightly above, at 16.57%. Companies that have bought back stock habitually for years are, in this backtest, NOT a reliable buy signal — the effect concentrates on the moment a company first sustains a stop to dilution.
Size Cut: Only the Large Companies Carry It
The main variant's edge stands or falls with company size. At a twelve-month hold:
| Revenue base | Positions | Return p.a. | Δ vs. S&P TR | Hit rate | Forced sales |
|---|---|---|---|---|---|
| All sizes | 95 | 21.29% | 6.27 pp | 65.3% | 6 |
| under $10M | 0 | 0.00% | −15.02 pp | — | 0 |
| $10M to $100M | 8 | −0.01% | −15.03 pp | 62.5% | 0 |
| over $100M | 84 | 21.85% | 6.83 pp | 65.5% | 6 |
| revenue unknown | 3 | 2.49% | −12.53 pp | 66.7% | 0 |
Of the main variant's 95 positions, 84 belong to companies with more than $100 million in revenue — only that segment beats the overall figure (21.85%). In the $10-to-100-million band (8 positions) the return sits at essentially zero, and below $10 million there is not a single position. The measured edge is thus a finding for larger, established companies — not for micro-caps.
Sensitivities: How Robust Is the Rule?
Each variant turns exactly one dial against the main variant, everything else held equal. Twelve-month hold, arm ALL:
| Variant | What was turned | Positions | Return p.a. | Δ vs. S&P TR |
|---|---|---|---|---|
| w2_r1_h8 (main) | Decline depth 1%, history 8 quarters | 95 | 21.29% | 6.27 pp |
| w2_r05_h8 | Decline depth lowered to 0.5% | 128 | 23.13% | 8.11 pp |
| w2_r2_h8 | Decline depth raised to 2% | 55 | 23.74% | 8.72 pp |
| w2_r1_h12 | History extended to 12 quarters | 92 | 19.26% | 4.24 pp |
| w3_r1_h8 | Three decline quarters required instead of two | 85 | 18.07% | 3.05 pp |
| dauer12 (control) | Habitual buyers, no history condition | 348 | 13.13% | −1.90 pp |
All five turn variants beat the S&P 500, spanning 3.05 to 8.72 percentage points — the rule is robust within its own family. A stricter decline depth (w2_r2_h8) improves the result further still, though on only 55 positions. The control arm dauer12 remains, in every variant, the only one below the market.
Robustness Without Covid Entries
A substantial share of the edge comes from the period around the pandemic. In spring 2020, companies across the board suspended their buyback programs and issued stock instead; a year later, any return to normal looked like a turn even where it was not one. We therefore dropped all entries between 2020 and 2022 — the year-over-year comparison and the history before it reach back up to three years, hence the full span. No conservative, price-jump-excluding version of this count exists; shown throughout is the full count, with a reference figure of the full twelve-month return of 21.29%:
| Holding period | Positions | Return p.a. (full) | Δ vs. S&P TR | Excluded |
|---|---|---|---|---|
| 3 months | 80 | 5.95% | −9.07 pp | 18 of 98 |
| 6 months | 80 | 14.67% | −0.35 pp | 18 of 98 |
| 12 months | 77 | 14.68% | −0.34 pp | 18 of 95 |
| as long as held | 76 | 17.08% | 2.06 pp | 18 of 94 |
The finding flips at a twelve-month hold: excluding Covid entries, the full return sits at 14.68% (77 positions) — against the full twelve-month return of 21.29% with Covid entries included — 0.34 points BELOW the S&P 500 instead of above it. Nearly the entire measured edge comes from entries made between 2020 and 2022. Only the "as long as held" variant keeps an edge, at 2.06 points. This meaningfully weakens the headline number and belongs, unvarnished, in any assessment of this rule.
Robustness: Price-Jump Suspects and Merger Artifacts
This study's headline number (17.90%, 94 positions) is deliberately the conservative count, because the signal logic and a known data flaw point in the same direction: an unadjusted stock consolidation in the price-adjusted series halves the share count from one quarter to the next — exactly what the turn signal looks for. At a twelve-month hold, this affects one of the main variant's 95 positions; excluding it, the return drops from 21.29% to 17.90%. We do not silently discard this position, because a month-over-month jump can also be genuine — which is why the conservative figure stands as the headline number, the full count alongside it, never the other way around.
A second, independent adjustment concerns merger artifacts: when a price series ends because a company keeps operating under a different ticker after a merger, that is not a market event but a series ending — the portfolio run still force-sells at the last available price regardless. The most prominent case is MYL (Mylan): the exchange into Viatris on November 16, 2020 was a 1:1 swap into a stock then worth roughly $16 — yet the price series carries a residual placeholder quote and shows −99.8%. That is a data error, not a total loss. Excluding the five identified merger artifacts (ASGN, CBS, COG, HIIQ, MYL), the full twelve-month return of the main variant DROPS from 21.29% to 20.95% (94 positions, 1 excluded) — because HIIQ, an artifact with a positive return (+15.3%), also drops out. For "as long as held" the correction runs the other way and rises from 18.16% to 18.74% (91 positions). The correction thus runs in both directions depending on holding period — it is not a straightforward improvement.
Delisting Classification: What Happened to the Forced Sales
Across all variants of this study, 30 forced-sale cases were researched by hand and classified, each with a source: 22 acquisitions, 2 genuine insolvencies (GPORQ with a documented shareholder wipeout in Chapter 11 proceedings; EBIX with a Chapter 11 filing, followed by penny-stock trading as EBIXQ and an acquisition of the remains by an investor consortium — the −98% loss is real, but no documented shareholder wipeout exists for EBIX), 1 voluntary withdrawal (PDLI, whose liquidation distributions AFTER delisting likely understate the measured return), and 5 merger artifacts, where the company kept operating under a new ticker. The large majority of forced sales were thus plausibly positive or neutral for the strategy — acquisitions clearly dominate over genuine bankruptcies.
Family Comparison: Where Does the Cannibal Turn Stand Against the Revenue Accelerator?
Both backtests run on the same universe, the same period (January 2013 to July 2026), and the same twelve-month hold:
| Backtest | Return p.a. (full) | total-loss count |
|---|---|---|
| Revenue Accelerator (published) | 26.28% | 16.56% |
| Cannibal Turn (this study) | 21.29% | 13.99% |
| Cannibal Turn, control arm dauer12 | 13.13% | 11.24% |
| S&P 500 Total Return | 15.02% | |
| Universe, equal-weighted | 4.77% | |
In this direct comparison, the Revenue Accelerator remains the stronger signal, both in the full count and in the total-loss count. Further backtests in the cannibal and accelerator families are running in parallel — a combined comparison across all family studies will follow in its own article.
How We Calculated This
- Source. Public mandatory filings of the US Securities and Exchange Commission via SEC/EDGAR (10-K/10-Q) from 2013 onward, taking the cover-page share count of each quarterly filing and the buyback payments from the cash-flow statement.
- Point-in-time. Calculated over the filing date, not the quarter end — a figure only counts from the day it was actually published.
- YTD differencing. Buyback payments are reported by some companies as annual or half-year figures and were differenced into individual quarters before evaluation (quarterly value = current year-to-date figure minus the prior quarter's year-to-date figure).
- Portfolio. Equal-weighted, monthly rebalancing, 0.1 percent cost per side, minimum price of $1 at entry.
- Delisted stocks stay in the portfolio and are force-sold at the last available price — the total-loss second calculation, which sets every forced sale to −100 percent, runs alongside throughout.
- Hand check. Five first-signal cases (TREX 2014, HTLD 2016, MU 2019, SLAB 2022, UTHR 2024), spread across years and company sizes, were checked against the original SEC filings — cover-page share counts matched to the share or within 0.35 percent (a filing-date quirk), all checked cash quarters matched exactly to the SEC's year-to-date figures once differenced. All 5 cases passed.
- Period. January 2013 to July 2026, 163 months.
- Cross-check. The monthly series re-aggregated for this report deviate from those stored in the portfolio run by 0 percentage points.
Price series and the S&P 500 Total Return benchmark come from our own US stock price archive, including delisted names. Quarterly figures, share counts, and filing dates come exclusively from the US Securities and Exchange Commission's public mandatory filings.
What This Study Does Not Say
- A substantial share of the edge sits in the Covid period. Excluding entries from 2020 to 2022, the twelve-month return (full count, reference figure 21.29%) drops to 14.68% (77 positions) — 0.34 points below the index instead of above it (see "Robustness Without Covid Entries").
- The portfolio is a micro-portfolio. Across 13.5 years only 94 to 98 positions exist depending on the variant; at fixed holding periods it holds a median of 2 to 6 names simultaneously, 22 in the as-long-as-held mode. At a three-month hold, 90 of 125 invested months hold at most two names — these figures carry little statistical weight. At a six-month hold, the total-loss second calculation degenerates at a single month where only one position is held into an effectively meaningless annualization (see the footnote in the results chapter).
- The edge only carries at larger companies. Only the segment above $100 million in revenue (84 of 95 positions) delivers the 21.85%; below that, returns sit at essentially zero.
- The zero assumption covers 65.63 percent of buyback lines. A company that files a cash-flow statement without reporting a stock buyback is recorded at $0 — without this assumption, the dataset would consist only of reported buyers.
- Guards trigger frequently. 2,521 declines remained unproven, 1,161 had no cash proof, 37,226 signal opportunities are under reverse-split suspicion, and 20,988 under forward-split suspicion.
- The year-ago quarter is missing in 8.6 percent of cases. Only 91.4 percent of grid rows have the required year-ago quarter on file at all — without it, no decline can be measured.
- 994 buyback candidates were discarded because their calculation base did not match (a different fiscal year, a late filing) — they were discarded, not estimated.
- Unrecorded stock consolidations remain a residual risk. Only month-over-month jumps above 200 percent were checked (see "Robustness"); smaller, undetected cases may still sit inside the conservative figure.
- A backtest is not a forecast. This study is market research, not investment advice, and not a buy recommendation.
This backtest has turned into a live scanner: Cannibal Turn. It applies the tested rule to our universe every day — the same eight quarters of measured dilution, the same minimum of two declining quarters, the same cash proof from the cash flow statement. Two findings from this study are built into it: it only lists companies from $100 million in revenue upwards, because that is the only revenue base on which the signal carried — the size cut was measured at a twelve-month hold, and the study did not compute the revenue hurdle and the as-long-as-held mode in combination — and it lists a company for as long as the turn stays intact — the only one of the four holding periods tested that stays ahead of the index even without the 2020 to 2022 entry years (full count: 17.08 versus 15.02 percent). One consequence is worth knowing: when a stock leaves that list because its share count has risen for two quarters in a row, that is the sell trigger under the measured rule — not merely the end of an observation.
For the family's stronger-carrying growth signal, see the Revenue Accelerator study — there, the fresh revenue inflection beats the market by a clearer margin than the cannibal turn does here.
Frequently Asked Questions
A company shows a cannibal turn when its share count does not decline in any step across at least eight quarters and rises by at least 3 percent over that stretch (dilution), and afterward at least two consecutive quarters each fall at least 1 percent below their year-ago quarter — proven by real buyback payments in the cash-flow statement. Two guards sort out reverse splits (over 30 percent quarterly decline) and forward splits (over 50 percent quarterly rise in the history window) as data artifacts before they can count as a signal.
Narrowly, yes. On the conservative count — excluding positions with a suspicious price jump — the cannibal turn returns 17.90% per year at a twelve-month hold from 94 positions, against 15.02% for the S&P 500 Total Return, an edge of 2.88 percentage points. That is this study's headline number. The full count (95 positions) stands at 21.29% alongside it, the total-loss count at 13.99%.
Companies that buy back stock for twelve or more consecutive quarters, with no condition on the years before (arm dauer12), return only 13.13% per year at twelve months from 348 positions — 1.90 percentage points BELOW the S&P 500. That is this study's citable core finding: the BEGINNING of a buyback program carries the edge, the plain habit of buying back does not.
Substantially. Excluding entries from the Covid years 2020 to 2022, the twelve-month return (full count, reference figure 21.29%) drops to 14.68% (77 positions) — only 0.34 points below the index instead of above it. The portfolio is also a micro-portfolio: at fixed holding periods a median of 2 to 6 simultaneous positions (22 in the as-long-as-held mode), and only companies above $100 million in revenue carry the measured edge; below that, returns sit at essentially zero.


