The Pierpont Backtest: A Filter That Screens Out Too Much
Ryan Pierpont isn't just another trader with self-reported numbers: he placed 3rd in the US Investing Championship in both 2020 and 2021, verified externally through brokerage statements. But unlike other momentum traders, he publishes almost no concrete figures about his method — no volume multiplier, no base depth in percent, no moving-average rule used as a filter. We translated his core "tightness" setup from two interview transcripts and a conference talk into a measurable rule and backtested it across the entire US stock market since 1984. The result splits in an unexpected way: the filter demonstrably improves trade quality — but it is so strict that it finds almost nothing in the very years Pierpont's own results come from.
 Thomas Mücke
Founder & Publisher
Thomas Mücke
Founder & Publisher
Ryan Pierpont placed 3rd in the US Investing Championship in both 2020 and 2021 — externally verified through brokerage statements, not merely self-reported. Unlike many momentum traders who at least publish rough numbers for their method, Pierpont sticks almost entirely to qualitative language: "tight price spots," "quiet price action," "character change." No volume multiplier, no base depth in percent, no moving average used as a hard entry filter. That makes him an especially difficult test case — and, as it turns out, an especially instructive one.
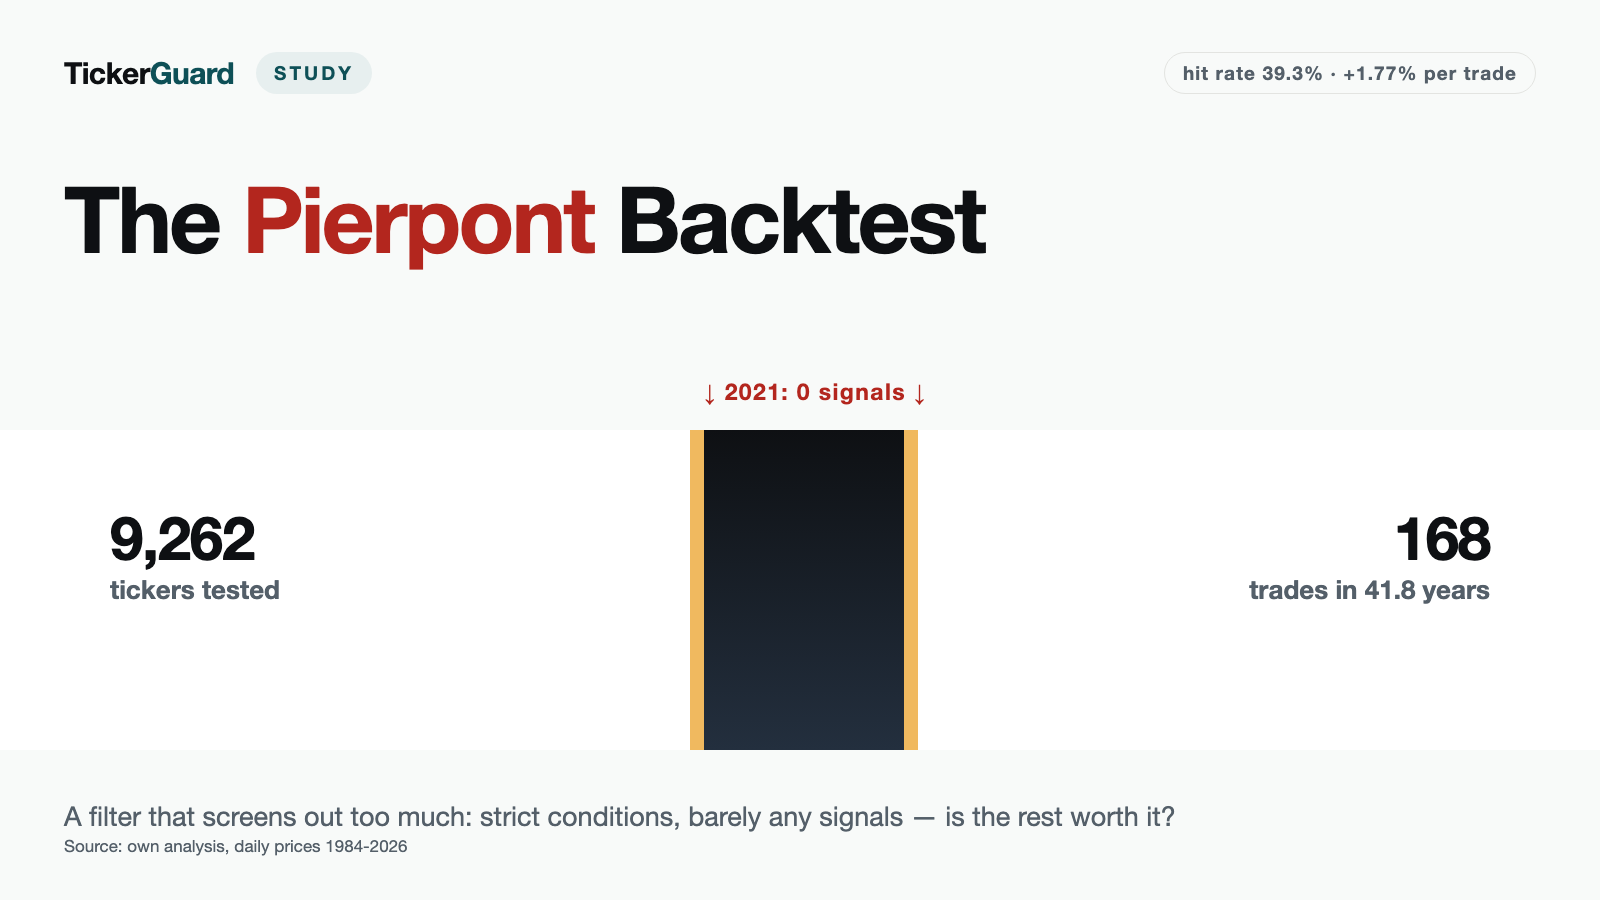
We translated his core "tightness" setup from two fully transcribed interviews (2021, 2022) and a conference presentation (2023) into a measurable rule and backtested it across 9,262 US-listed tickers since 1984 — survivorship-free, including every company later delisted. The result: 168 trades, an average of +1.77% per trade after costs — clearly ahead of the Qullamaggie project's reference breakout. But the filter is strict enough that it finds almost nothing in exactly the years Pierpont's public results come from. Both findings sit side by side in this study, neither one canceling out the other.
The result in four numbers
Does Pierpont's "tightness" filter beat the market — and does it work as a portfolio? We backtested his core setup across 9,262 US-listed tickers since 1984, arriving at 168 completed trades. Four numbers carry the result:
- +1.77% per trade after costs is what the 168 trades (1984-2026, 41.8 years) returned — with an identical exit, clearly ahead of the Qullamaggie project's reference breakout (+0.68%); the hit rate was 39.3% against 28.7%.
- 1.04% a year is what the portfolio simulation returned since 1993 (1% risk per trade) — SPY (total return) returned 10.61% over the same window, a gap of 9.57 percentage points a year.
- +0.06% per trade is what remained without the volume trigger (breakout-day volume at least 1.5x the 50-day average, N 671) — the entire measured edge rests on this single, unsupported number.
- 0 signals is what the formalized rule found across the entire US stock market in 2021 — the very year Pierpont again made the championship podium (3rd, +201.0%); 2020 saw 3.
Per trade, the filter measurably improved the result over the tested window; as a portfolio, the strategy lagged far behind SPY due to too few trading opportunities.
Who is Ryan Pierpont
Pierpont trades part-time — his day job is financial planning at ServiceNow, an enterprise software company. His craft traces back to the O'Neil/CANSLIM school, shaped by William O'Neil's books, Dan Zanger's newsletters, and a personal mentor. He has traded for roughly 11 to 14 years, stocks only, after an early loss trading options ("never again").
| Year | Division | Rank | Return |
|---|---|---|---|
| 2020 | Stock Division ($20,000–$1M accounts) | 3rd of 124 | +448.4% |
| 2021 | Stock Division | 3rd of 338 | +201.0% |
Combined, 2020 and 2021 compound to roughly 16.5 times the starting capital — the figure he cites himself. Both placings are officially confirmed by the US Investing Championship, with the returns evidenced by the brokerage statements it requires; the 2021 interim figure was additionally verified against monthly account statements. He describes his own hit rate as low:
"my batting average last year was horrible it was maybe high 20 percent … i was wrong 75 % of the time"
— Ryan Pierpont, interview with Richard Moglen, January 2022
The profit therefore comes from a handful of large winners against small, tightly capped losses, not from being right often.
What we tested: turning qualitative rules into a measurable version
The single most important finding from our research surfaces before the backtest even begins: unlike, say, Kristjan Kullamagi, Pierpont states almost no numbers at all. His rule set is qualitative and heavily discretionary. Two examples from the original sources, with our translation:
"i don't like wide and loose price action i like when things tighten up and get really tight because that way the cost to find out if you're wrong is really small"
— Ryan Pierpont, interview with Richard Moglen, January 2022
Translated into our rule set as: the consolidation's average daily range must be no more than 60% of the average daily range over the preceding 20 trading days, over a consolidation length of 5 to 42 trading days. Both the percentage and the day counts are translations — Pierpont states neither.
"the float turnover was like probably somewhere around 10x that day so it was a complete character change"
— Ryan Pierpont on the ticker BTBT, interview with Richard Moglen, January 2022
Translated as: breakout-day volume at least 10 times the 50-day median volume. The original, however, refers to float turnover, not a multiple of average trading volume — a defensible but explicitly flagged approximation.
Our binding rule set consists of 17 individual rules. For nine of them the original gives no number at all, so we had to derive one from qualitative phrasing — each flagged individually as a translation: from the trend definition (price above a rising 50-day average, using Pierpont's own 10/21/50 moving-average periods even though he explicitly describes them not as a filter but as "areas of interest") to the time stop (5 days without a new high — a pure backtest convention, unsupported in the original). The full source matrix and every individual judgment call live in our rule documentation.
Setup: 9,262 tickers, 42 years, a very narrow filter
The scan checked 9,262 US-listed tickers (NYSE, Nasdaq, AMEX, no OTC names) from 1984 through 2026. 89,877 candidates passed the base mask. Of those, 79,781 — almost 89% — failed on the tightness condition alone; all other rejection reasons combined (base too deep, pivot already exceeded, stop too wide, data errors) account for only 9,922. That left 174 signals, 170 after removing company duplicates, of which 168 became fully completed trades. For comparison, the Qullamaggie project's reference breakout, run on the same universe filters but without Pierpont's tightness add-on, finds 1,602 trades in the same dataset — nearly ten times as many.
Execution: entry at the higher of the day's opening price and the consolidation high, stop at the low of the consolidation, costs 0.2% per leg, never two positions open on the same ticker at once. Main exit: the first daily close below the 10-day moving average, active from the third trading day after entry onward — the same exit mechanism used for the reference breakout, so the comparison isolates the entry filter alone.
The result: the filter measurably improves trade quality
| Metric | Pierpont Tightness | Reference Breakout (Qullamaggie) |
|---|---|---|
| Trades | 168 | 1,602 |
| Hit rate | 39.3% | 28.7% |
| Avg. return per trade (after costs) | +1.77% | +0.68% |
| Median per trade | −1.94% | −2.42% |
| Payoff ratio | 2.38 | 3.16 |
| Holding period | avg. 7.5 trading days (median 6) | median 4.0 trading days |
With an identical exit — critical, or the comparison would also be measuring the exit rule — Pierpont's tightness filter clearly leads on both hit rate and average return: +10.6 percentage points of hit rate, +1.09 percentage points of expectancy per trade. The lower payoff ratio (2.38 versus 3.16) shows where that advantage comes from: not from rarer but enormous winners, but from a meaningfully higher base hit rate with somewhat smaller individual wins.
The overlap between the two signal sets is small: of 170 Pierpont signals, only 1 (0.6%) falls on the exact same trading day as a reference breakout signal — even with a ±2-day tolerance, it stays at that single match. At the company level the overlap is much larger: 119 of 162 Pierpont tickers also appear in the (broader) reference file combining breakout and episodic-pivot signals. The two recipes trade largely the same stocks, just at different points in the same trend — the difference is timing, not stock selection.
The catch: nearly empty in the years Pierpont's own results come from
The most striking finding of this study only appears once you restrict the scan to the years Pierpont's documented results actually come from:
| Year | Signals | Trades |
|---|---|---|
| 2019 | 5 | 4 |
| 2020 (championship year, 3rd, +448.4%) | 3 | 3 |
| 2021 (championship year, 3rd, +201.0%) | 0 | 0 |
| 2022 | 9 | 9 |
In 2021 — the year Pierpont again made the championship podium at +201.0% — our formalized version of his own core setup finds zero signals across the entire US stock market. That doesn't necessarily mean the translation is wrong. It means either that Pierpont was mostly trading his other setups (tested separately below) in 2021, or that the conservative, standard version of his tightness recipe misses precisely what he actually bought: the "hidden breakout" before the obvious one, which he describes as his real edge (see "What can't be mechanized").
Why: the volume trigger carries the entire edge — and empties those very years
We tracked down which single component of the recipe is responsible for the return advantage. The answer is unambiguous: the breakout-day volume trigger, a number that appears nowhere in the original material.
| Volume condition | Trades | Hit rate | Avg. per trade | 2020/2021 signals |
|---|---|---|---|---|
| No volume condition | 671 | 31.6% | +0.06% | 40 / 19 |
| Volume ≥ 1.0x | 382 | 37.4% | +1.28% | 14 / 5 |
| Volume ≥ 1.5x (recipe) | 168 | 39.3% | +1.77% | 3 / 0 |
| Volume ≥ 2.0x | 84 | 38.1% | +3.67% | 2 / 0 |
Without the volume condition, expectancy is essentially a wash at +0.06% per trade: it does sit above this test's random baseline (−0.64%, standard error ±0.14 percentage points across 15 independent runs), but close enough to zero that nothing usable is left. Only the 1.5x volume trigger — a figure we chose, unsupported in the original — produces the measured edge. And it's exactly that filter that shrinks the 2020 and 2021 signal counts from 40 and 19 down to 3 and 0.
The tightness condition itself, by contrast, is robust: whether set at 0.5, 0.6, 0.7, or 0.8, expectancy stays positive throughout, between +1.21% and +1.94%, and the 2020/2021 signal count grows meaningfully with every loosening — from 1/0 at 0.5 to 28/19 at 0.8. The bottleneck isn't "tight" — it's volume.
Portfolio simulation: a positive expectancy isn't enough
A positive expectancy per trade says nothing about whether a strategy works as an actual portfolio — that requires enough trades to keep capital turning over. We simulated: starting capital $100,000, 1% risk per trade, at most 5 positions at once. Because signals are so scarce, the portfolio never once had to skip a trade for lack of capacity — all 168 offered trades were taken.
| Period | Trades | Ending capital | Return p.a. | Max drawdown |
|---|---|---|---|---|
| Full period (1984-2026, 41.8 years) | 168 of 168 | $142,912 | 0.86% | 15.5% |
| Since 1993 (SPY comparison window) | — | $139,988 | 1.04% | 15.5% |
| SPY buy-and-hold since 1993 (total return) | — | — | 10.61% | — |
In the window directly comparable to SPY since 1993, the portfolio runs at 1.04% a year — SPY (total return, including reinvested dividends) returns 10.61% over the same period. A gap of 9.57 percentage points a year. The portfolio simulation's maximum drawdown is 15.5% in both windows; we did not compute a comparison figure for SPY, so that number describes the strategy alone. The cause isn't bad trades — it's their scarcity: at roughly four trades a year across the entire US stock market, too much capital sits idle for too long to benefit from a positive expectancy per trade. Lowering the risk doesn't fix it either — at 0.5% risk the return drops to 0.44% a year, at 0.25% to 0.22%, because the same handful of trades are simply sized smaller.
The return distribution is also heavily concentrated: the best 5% of the 168 trades — eight of them — account for 136% of the total cumulative return. Strip those eight out and the result turns negative. Anyone replicating this would have to catch exactly that handful across 41.8 years: miss the five largest winners and you end up at break-even; miss all eight and you lost real money.
Character Change, IPO bases, gap lead-in: the remaining setups
Beyond tightness, Pierpont describes three more setups. We ran them in 22 variants — 18 for Character Change, two for IPO bases, and one each for the combination of both core setups and for the gap lead-in — to cover every plausible reading of his vague descriptions. The 18 Character Change variants alone cover 76,958 individually computed trades.
Character Change: loses in all 18 tested variants
Character Change — a sudden sentiment shift after a massive volume surge, marked by a close near the day's high after a run of close-near-lows days — was tested in 18 combinations of volume threshold (5x, 10x, 20x the median), trend filter (with/without), and tightening rules (close position, a "neglected" context, base-break confirmation). The best of all 18 variants, "no trend filter, 5x, next-day open" with 27,359 trades, averages −0.55% per trade. That neither beats the reference breakout (+0.68%) nor is it statistically distinguishable from this test's random baseline (−0.64%, standard error ±0.14 percentage points). All 18 variants land in negative territory, between −0.55% and −3.38% per trade.
IPO bases: makes results worse
Names with less than 504 trading days of price history on the signal day — our translation of Pierpont's "IPO turns," for which he states no age limit himself — underperform the rest of the universe in both tested scan variants: −2.20% per trade (N 33) against +2.74% for names with a longer history (N 135) in the same main run. The IPO subset does not outperform either the reference breakout or chance. To be clear about the small sample: at N 33, no reliable return claim can be made from this alone — the consistent underperformance is the message, not the exact percentage. One caveat about the data itself: the start of a price series in our dataset is not the IPO date. This figure measures "short price history," not "young company."
Combining both core setups: too rare to judge
Tightness signals that also satisfy the Character Change condition number only 5 across the entire test period, of which 4 became completed trades. All four end in a loss, averaging −5.52% — but at four trades, that's anecdote, not measurement. The underlying finding stands: tightness and character change almost never coincide in practice.
Gap lead-in: the one add-on that beats both benchmarks
One exception to the otherwise poor record: tightness signals preceded by a price jump of at least 10% within the prior 20 trading days (N 46) average +1.39% per trade, beating both the reference breakout and the random baseline. It's the only tested add-on that clears both bars — though on an already small subset of an already scarce core signal, without solving the underlying frequency problem.
What can't be mechanized
Pierpont's own, repeatedly emphasized core edge is the "hidden breakout": entering before the breakout is visible to everyone, based on trendlines drawn inside the base itself, the first range expansion, or a shakeout reclaim used as a first buy tranche — concepts his own course marketing sums up as "Identify hidden breakouts. Buy before the obvious breakout." Our backtest instead tests his conservative standard variant: buying the break above the consolidation high, entering at the higher of the day's open and the pivot. That's a methodically necessary simplification, but it demonstrably does not test the edge he advertises.
Other components can't be seriously modeled on daily data at all: his discretionary stacking of several chart signals at once; picking the leading stock in whichever group is strongest, which he reads purely off his own watchlist; his market-feel gauge based on the size of that same watchlist; and intraday execution itself — buying the gap open right at a line, 60-minute undercut logic, pyramiding on intraday confirmation.
For one of those patterns we at least had minute-level prices on hand — from a cache built for a different project. Of 38,296 signal days checked, only 9 had a minute-level picture available. On 8 of those 9 days there was an opening gap of at least 3%, and in all 8 cases that gap was not closed during the first hour of trading — so the direction of his example pattern does hold up. For any return claim that is far too little: the sample isn't randomly drawn, it is simply whatever happened to be in the cache.
Limitations of this study
- Almost no original figures. Unlike many other momentum traders, most thresholds in this recipe had to be translated from qualitative description — nine individually flagged translation decisions within a rule set of 17 individual rules. That's not a research gap: three primary sources totaling more than 5 hours of material were fully reviewed; Pierpont simply doesn't state the numbers.
- The volume trigger carries the entire measured edge and is simultaneously the least-supported single figure in the recipe. Any other plausible choice for that number would have produced a different result — from almost no edge at all (no filter) to a larger edge resting on even fewer trades (at 2.0x).
- Small samples across nearly all secondary setups. IPO bases (N 33), the combination of both core setups (N 4), and the intraday gap sample (N 9) are too small for reliable return claims and are flagged accordingly.
- The hidden-breakout edge is untested. As above, this backtest checks the conservative standard pivot entry — not Pierpont's actual, discretionary advantage of entering before the obvious breakout.
Our other momentum backtest studies — including the Qullamaggie Backtest on Kristjan Kullamägi's setups and the Episodic Pivots Backtest on price jumps after earnings — live in Studies.
Figures as of 9 August 2026.
This article is a historical analysis of publicly described trading rules and not investment advice. It contains no buy or sell recommendation and no forecast; individual companies named in it serve solely to illustrate historical price patterns. Past results — whether simulated or real — are not a reliable indicator of future returns. Anyone making investment decisions should assess their own situation and risks, if in doubt with professional advice.
Frequently Asked Questions
A part-time growth-stock swing trader based in Los Gatos, California, who works full-time in financial planning at ServiceNow. His craft comes out of the O'Neil/CANSLIM school, shaped by William O'Neil's books, Dan Zanger's newsletters, and a personal mentor. He has traded for roughly 11 to 14 years, stocks only. In the US Investing Championship he placed 3rd of 124 in the Stock Division in 2020 (+448.4%, externally verified via brokerage statements) and 3rd again in 2021, that time of 338 entrants (+201.0%). Unlike many self-reported track records, his returns are independently verified — but he discloses almost no concrete numbers about the method itself.
His core "tightness" setup — buying the breakout from a very tight consolidation within an uptrend, marked by drying-up volume and a shrinking daily range — plus his secondary setups Character Change (a sudden shift in behavior after a massive volume surge), IPO bases, and a gap lead-in variant. Since Pierpont states almost no numbers — no volume multiplier, no base depth in percent, no moving average used as a hard filter — every threshold had to be translated from vague phrasing like "tight, quiet price action." Every such figure is individually flagged in our rule documentation as a translation, not an original statement.
With an identical exit rule — essential, otherwise the comparison would also be measuring the exit — it clearly beats the Qullamaggie project's reference breakout: a 39.3% hit rate against 28.7%, and +1.77% average expectancy against +0.68%. The problem isn't the effect, it's the frequency: 168 trades in 41.8 years across the entire US stock market is too few for a workable portfolio, and their distribution over time is extremely uneven.
The volume trigger — breakout-day volume at least 1.5 times the 50-day average — is an unsupported translation; Pierpont himself only requires volume qualitatively, without a multiplier. Removing it drops expectancy from +1.77% to +0.06% per trade, on almost four times as many signals (671 instead of 168). That single filter is therefore responsible for both the measured edge and the near-empty 2020/2021 core phase — it is our number, not his rule.
Not in the simulation: at 1% risk per trade and a five-position cap it returned 1.04% a year since 1993; SPY (total return) delivered 10.61% over the same window. Even though the average trade is profitable, trading roughly four times a year across the entire US stock market isn't frequent enough to grow a portfolio meaningfully.
Pierpont's actual claimed edge is the "hidden breakout": entering before the breakout becomes obvious to everyone else, based on trendlines inside the base itself, shakeout reclaims used as a first buy tranche, and confluence across several chart signals at once. None of that can be mechanized. This backtest only tests his conservative standard pivot entry — much as the Qullamaggie backtest found the harder-to-define Breakout weaker than the cleanly definable Episodic Pivot, this translation problem hits Pierpont's setup even harder.


