Market Trend Filter Backtest: Buying Only in Uptrends Cuts Returns From 15.51% to 13.01–13.63%
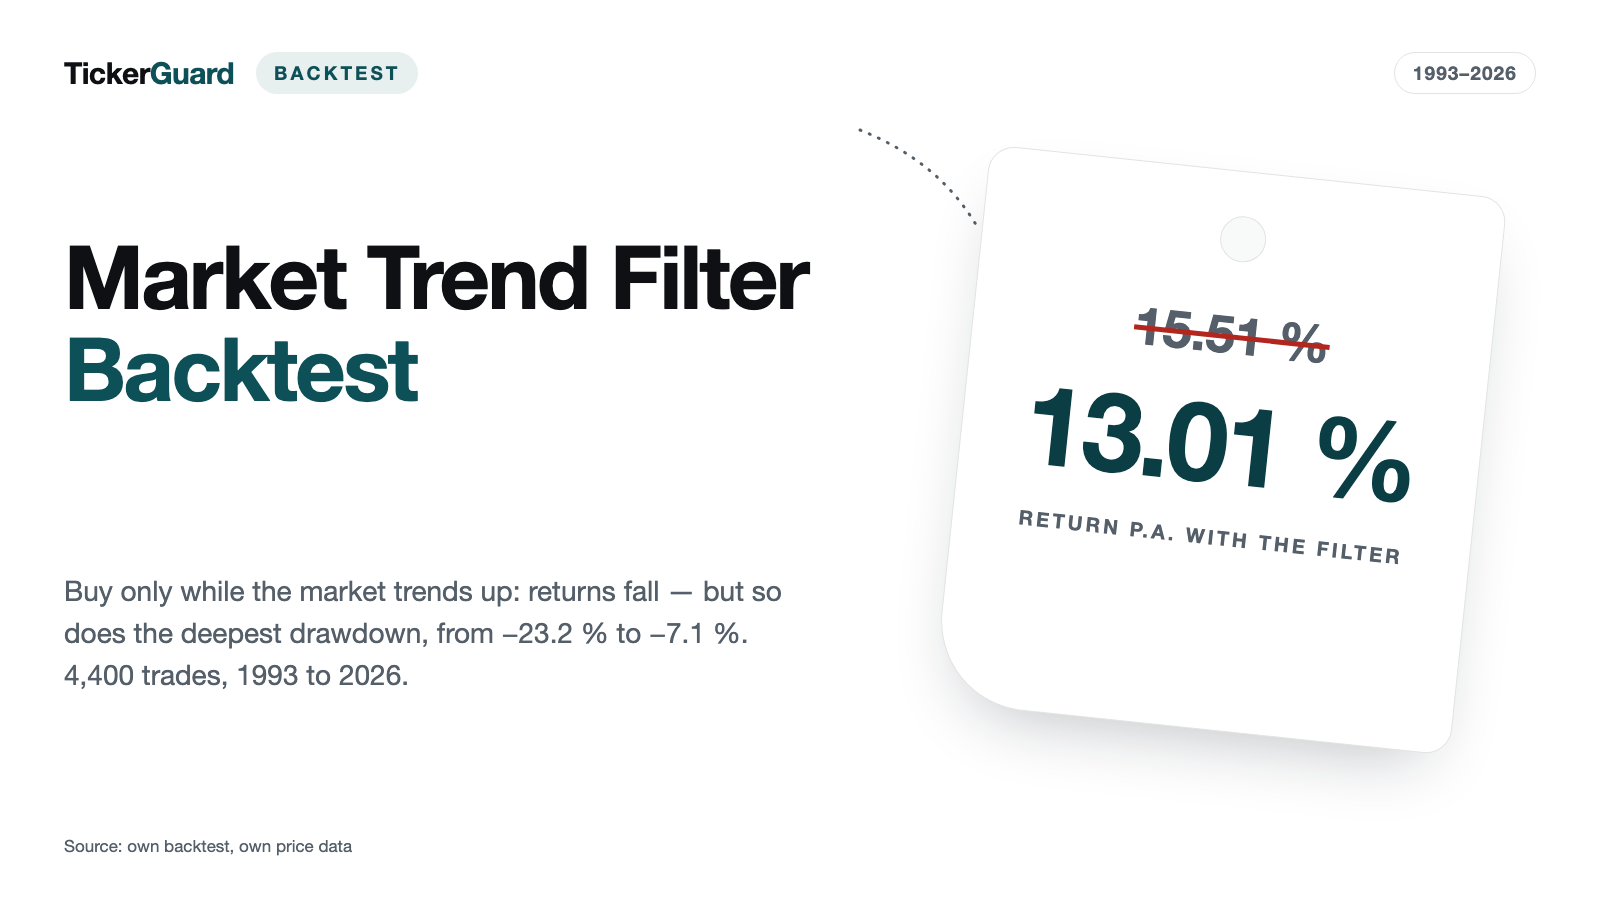
Should you only buy new stocks when the S&P 500 itself is trending up — and simply skip every trade while it isn't, without touching your sell rules? We layered that exact rule as a pure buy filter on top of a finished swing-trading backtest (4,400 trades, 1976–2026, portfolio simulation from 1993), testing three pre-registered trend filters, plus a long-horizon contrast run over 19,914 trades from a separate momentum-combo backtest. The finding is sobering: returns fall in all three filter arms — from 15.51% down to 13.01%, 13.63% and 13.49% a year — because the trades that got blocked were profitable on average (up 2.78% to 3.09% per trade). Most of that cost lands in bear years, because the strongest swing setups of the entire period fired exactly when the broad market itself was falling. The one real payoff: in two of the three filters, the worst drawdown on the realized equity curve drops from 23.21% to 7.05% and 8.30% — buying that calm costs roughly two percentage points of annual return. The sluggish 200-day filter does not even deliver that.
 Thomas Mücke
Founder & Publisher
Thomas Mücke
Founder & Publisher
Almost every breakout or momentum strategy eventually picks up the same footnote: "but only buy while the broad market is trending up." The idea is so widespread that it rarely gets justified any more — a trend filter on the index, usually the 200-day moving average, is supposed to keep entries out of bad market phases and give the account some peace.
We did not build that rule from scratch. We layered it as a pure buy filter on top of an already finished backtest: the Qullamaggie swing-trading backtest, 4,400 trades from 1976 to 2026 with a portfolio simulation from 1993 onward. Exits run exactly as before in every arm; the only thing that changes is whether an entry happens at all. Three trend filters were locked in before the measurement ran. The result is unambiguous — and it cuts against the common expectation.
The premise: only buy stocks while the broad market is trending up
The market-trend flag shows whether the S&P 500 is in an uptrend (green) or not (red). Here it is tested not as a sell signal but purely as a buy filter: new positions open only while the flag is green; positions already open keep running under the unchanged exit rule of the underlying strategy.
Three filter definitions, all registered before the measurement — no parameter sweep, no re-optimization:
- Filter A (strict). The 10-day moving average is above the 20-day average AND the close is above the 10-day average.
- Filter B (looser). The 10-day moving average is above the 20-day average AND the close is above the 20-day average.
- Filter C (sluggish textbook benchmark). The close is above the 200-day moving average — the classic of the trend-following literature.
- Unfiltered. No filter, for comparison.
The filter state that matters is always the one on the last trading day strictly before the entry day (T−1) — no look-ahead. The test bed is the finished Qullamaggie backtest (4,400 trades, portfolio simulation from 1993, index price series from 29 January 1993 to 24 July 2026). The Green Line Breakout combo backtest with 19,914 trades serves only as a long-horizon contrast on a per-trade basis — it runs no portfolio simulation with a buy filter of its own.
The result in four numbers
Does it pay to allow new stock buys only while the broad market itself is trending up, and to sit out whenever the flag turns red? We tested that across three pre-registered filter arms on top of the finished Qullamaggie swing-trading backtest (1993 to 2026). Four numbers carry the result:
- 15.51% a year is what the unfiltered portfolio returned — with the buy filter engaged, returns fell in all three arms to 13.01–13.63%.
- 10.76% a year is what the S&P 500 returned over the same window — all three filtered arms still beat it by a wide margin.
- 2.78% to 3.09% per trade is what the blocked trades returned on average — the filter screened by market state, not by signal quality.
- −23.21% was the worst equity-curve drawdown with no filter — Filter A pulled it to −7.05%, Filter B to −8.30%; only the sluggish 200-day Filter C stayed essentially unchanged at −23.52%, costing return without buying any calm.
Across the 1993-to-2026 test window, the buy filter cost return in all three filter arms, while it eased the worst drawdown in only two of the three.
The result: returns fall in all three filter arms
| Arm | Signals offered | Trades taken | Ending capital | Return p.a. | Worst drawdown |
|---|---|---|---|---|---|
| Unfiltered | 4,359 | 2,607 | $12,520,840 | 15.51% | −23.21% |
| Filter A (strict) | 2,122 | 1,393 | $6,023,332 | 13.01% | −7.05% |
| Filter B (looser) | 2,456 | 1,538 | $7,225,390 | 13.63% | −8.30% |
| Filter C (200-day) | 3,084 | 2,034 | $6,933,348 | 13.49% | −23.52% |
| S&P 500 (buy and hold) | — | — | +2,964.0% total | 10.76% | — |
Portfolio with buy filter, 29 January 1993 to 24 July 2026 (33.50 years, capped price-series window).
All three filter arms still beat the S&P 500 (10.76% a year) by a wide margin — but none of them beats the unfiltered version. The buy filter costs the portfolio between 1.88 and 2.50 percentage points of annual return, depending on which filter is used. A trend filter that still beats the index while weakening the strategy it sits on is not an edge; it is an expensive brake.
Where does the lost return go? The blocked trades were profitable
| Arm | Blocked trades | Avg. return per trade | Median | Hit rate |
|---|---|---|---|---|
| Filter A | 2,237 | +2.79% | −0.57% | 46.0% |
| Filter B | 1,903 | +2.78% | −0.61% | 45.4% |
| Filter C | 1,275 | +3.09% | −0.15% | 49.25% |
Signals never taken because the flag was red.
The buy filter does not quietly weed out a worthless slice of the signal pool: the blocked trades would have been profitable on average — between 2.78% and 3.09% per trade, and under Filter C they even carry the highest hit rate of all three arms (49.25%). The reason is simple: the filter is not screening out weak setups on their own merits; it is screening them out based on the state of the broad market, regardless of how good the individual setup was. A strong signal in a red market is still a strong signal.
The only payoff: calm in bear years — and only for two of three filters
| Arm | Avg. bear years | Avg. other years |
|---|---|---|
| Unfiltered | 42.52% | 10.62% |
| Filter A | 21.23% | 11.50% |
| Filter B | 25.40% | 11.30% |
| Filter C | 25.02% | 11.99% |
Portfolio return in bear years vs. other years (average; seven bear years: 2000–2003, 2008, 2020, 2022).
Almost all of the lost return is concentrated in bear years. In calm years the arms barely differ (10.6% to 12.0%) — the filtered arms are even marginally ahead there. Across the seven bear years, though, the filtered arms' returns fall to roughly half to three-fifths of the unfiltered value (Filter A 49.9%, Filter C 58.9%, Filter B 59.7% of the unfiltered figure). The reason is the uncomfortable core of this study: the strongest swing setups of the entire study period fired during the 2000–2002 bear market, precisely while the S&P 500 itself was falling — and the flag was red at exactly that time, blocking those entries. In the year 2000 the unfiltered portfolio returns 111.3%; Filter A manages 25.2%.
The worst drawdown on the realized equity curve does show the hoped-for effect — but only in two of the three filters:
| Arm | Worst drawdown | Date |
|---|---|---|
| Unfiltered | −23.21% | 15 June 2012 |
| Filter A | −7.05% | 8 May 2008 |
| Filter B | −8.30% | 25 January 2001 |
| Filter C | −23.52% | 25 May 2012 |
Filters A and B pull the worst drawdown from about minus 23% down to minus 7% and minus 8% — a portfolio with a noticeably calmer capital curve. That calm costs roughly 2 to 2.5 percentage points of annual return. The sluggish 200-day filter never delivers that trade-off at all: its worst drawdown, at minus 23.52%, is essentially identical to the unfiltered version — Filter C lowers returns without improving drawdown. That is the worst possible bargain.
On a per-trade basis, the filter barely separates short swing trades
| Arm | Green N | Green avg. return | Green hit rate | Red N | Red avg. return | Red hit rate |
|---|---|---|---|---|---|---|
| Filter A | 2,122 | 2.81% | 45.33% | 2,237 | 2.79% | 46.0% |
| Filter B | 2,456 | 2.82% | 45.89% | 1,903 | 2.78% | 45.4% |
| Filter C | 3,075 | 2.68% | 44.2% | 1,275 | 3.09% | 49.25% |
Swing-trading backtest, all trades, green vs. red (4,400 trades; for Filter C, 9 trades stay undetermined during warm-up).
For short swing trades, green and red phases land almost on top of each other — for Filters A and B the results are nearly identical (2.81% vs. 2.79%, and 2.82% vs. 2.78%). Under Filter C the picture even reverses: red trades outperform green trades on average (3.09% vs. 2.68%). On a per-trade basis, the market-trend filter carries essentially no separating power for short holding periods.
On the long-horizon contrast run, the filter separates clearly
| Arm | Green N | Green avg. return | Green hit rate | Red N | Red avg. return | Red hit rate |
|---|---|---|---|---|---|---|
| Filter A | 9,643 | 8.46% | 44.71% | 7,730 | 6.61% | 41.35% |
| Filter B | 11,544 | 8.07% | 44.18% | 5,829 | 6.79% | 41.29% |
| Filter C | 15,233 | 8.20% | 43.98% | 1,961 | 3.70% | 37.33% |
Green Line Breakout combo backtest, long-horizon contrast, green vs. red (19,914 trades).
The picture flips on the long-horizon contrast run, which holds positions for much longer periods. Here, green is clearly better than red in all three filter arms — most sharply under the sluggish 200-day filter (8.20% vs. 3.70%, a 4.5-percentage-point gap). That contrast between the two test beds is the real finding of this section: trend filters separate outcomes on long holding periods, not on short ones. A swing trade is usually already closed before the broader market trend can meaningfully affect it; a long-horizon position, by contrast, stays open long enough for the state of the overall market to actually matter.
Whipsaw — how often does the filter flip color?
| Arm | Flips per year | Share of days green | Avg. green streak | Avg. red streak |
|---|---|---|---|---|
| Filter A | 34.0 | 45.7% | 6.8 days | 8.0 days |
| Filter B | 23.2 | 54.4% | 11.8 days | 9.9 days |
| Filter C | 6.5 | 77.2% | 59.4 days | 17.7 days |
Color flips and dwell time per filter, 1993 to 2026.
The strict Filter A flips 34 times a year — a new state roughly every seven trading days, with green flagged only 45.7% of the time. The looser Filter B flips 23 times a year (54.4% green). The sluggish 200-day Filter C flips only 6.5 times a year and stays green 77.2% of the time, with green streaks averaging about 59 trading days — close to three months.
That pattern also explains why Filter C never delivers the calm effect the other two do: a filter that is green 77% of the time simply does not have enough red time left to build meaningful drawdown protection. Filter C blocks too rarely to protect — but often enough to cost return.
Putting it in context — does this match what the textbooks predict?
Only halfway. The standard expectation for trend filters — lower returns in exchange for lower risk — holds up on the drawdown side: Filters A and B pull the worst equity-curve drawdown from roughly 23% down to 7% and 8%, a genuine calm dividend. The return side of that trade-off never materializes, though: none of the three filters, under any of the three definitions, beats the unfiltered portfolio. And the sluggish 200-day filter, often treated in the literature as the most robust long-term trend gauge, delivers neither return nor calm here.
For practical purposes: traders who want a calmer account and are willing to give up roughly two percentage points of annual return for it will find that with Filter A or B. Traders optimizing purely for return will not find an edge in any of the three filters — as a buy filter, the market-trend flag delivers no return advantage here.
How we calculated this
- T−1 rule. The entry day T is governed by the filter state on the last index trading day STRICTLY BEFORE T — no look-ahead. Verified with a self-check (entry 26 April 1994, T−1 = 25 April 1994) and a non-trading-day probe (entry 22 March 2020, a Sunday, correctly resolving T−1 to 20 March 2020).
- Warm-up. While a moving average cannot yet be computed, the filter is treated as undetermined and never blocks: 19 trading days for Filters A/B, 199 for Filter C (about 2.4% of the price series).
- Buy filter, no makeup entries. A blocked signal expires outright — there is no automatic makeup purchase once the filter turns green again.
- Post-hoc partitioning, slightly conservative for the filter arms. The buy filter removes trades from an already-finished trade list; a follow-on signal that was crowded out in the unfiltered run by an open position stays crowded out even if that position would never have been opened under the filter arm. This tends to push the filter arms' results slightly lower than a from-scratch simulation would.
- Window convention. Headline figures use the capped price-series window (33.50 years, 29 January 1993 to 24 July 2026) — the same denominator used for the S&P 500 benchmark. Under the alternative trade-window convention of the underlying swing-trading study (33.33 years from the first entry), the unfiltered arm comes out to 15.59% instead of 15.51% a year — same calculation, different window length; checked as a regression gate against the original study.
- Worst drawdown refers to the realized equity curve; unrealized gains on open positions are not counted in this proxy.
- No parameter sweep, no re-optimization. All four arms (unfiltered, Filter A, Filter B, Filter C) were locked in before the measurement ran.
- Data basis. Index price series (adjusted close), 29 January 1993 to 24 July 2026, 8,428 trading days, from our own price archive. Test bed: the finished swing-trading backtest (4,400 trades) for the portfolio simulation with a buy filter; the Green Line Breakout combo backtest (19,914 trades) additionally as a long-horizon contrast on a per-trade basis.
What this study does not say
- The filter was tested exclusively as a buy filter — not as a sell signal. Whether exiting on a red flip would improve or worsen results is a separate question this measurement does not answer.
- No parameter sweep. Other thresholds (different moving-average lengths, for instance) might perform differently — that was deliberately left untested to avoid re-optimizing after the fact.
- The long-horizon contrast run is a per-trade breakdown by filter color, not a standalone portfolio simulation with its own buy filter — it shows a tendency (trend filters bite on long holding periods) but is not directly comparable to the portfolio figures in the first table.
- The post-hoc partitioning works slightly against the filter arms (see methodology) — the real-world gap to the unfiltered version could turn out marginally smaller in practice.
- The result depends on the test bed. It was measured on a short-horizon swing strategy; for other holding periods the long-horizon contrast already tells a different story.
- A backtest is not a forecast. This study is market research, not investment advice and not a buy recommendation.
What we did (not) build from this
This backtest produces no live scanner and no new rule for our vetted signals. A buy filter that costs return in all three tested definitions, and delivers calm in only two of them, is not a signal — it is a risk decision, and that decision belongs to the investor, not to the scanner.
What remains is a usable rule of thumb: the longer the intended holding period, the more a trend filter is worth. On short swing trades the state of the market on entry day is almost irrelevant; on positions held for months, it clearly matters. If you want to get to know the underlying strategy, it is covered in the Qullamaggie study.
Frequently Asked Questions
Whether a "market-trend flag" — green while the S&P 500 is trending up, red otherwise — helps when used purely as a buy filter for new positions. Three pre-registered trend filters (Filter A strict, Filter B looser, Filter C a sluggish 200-day filter) are tested on top of a finished swing-trading backtest (4,400 trades). Exits stay unchanged in every arm, and the filter state that counts is always the one from the prior close (T−1), with no look-ahead.
The S&P 500 (10.76% a year) is still beaten by a wide margin in all three filter arms. Against the unfiltered portfolio, though, the buy filter loses ground in every arm: 13.01% (Filter A), 13.63% (Filter B) and 13.49% (Filter C) versus 15.51% unfiltered.
Only in two of the three filters. Filter A pulls the worst equity-curve drawdown from minus 23.21% to minus 7.05%, Filter B to minus 8.30% — a real calm dividend. The sluggish 200-day Filter C does not deliver that: its drawdown, at minus 23.52%, sits essentially where the unfiltered portfolio's does.
Because some of the strongest swing setups of the entire study period fired during the 2000–2002 bear market, right as the S&P 500 itself was falling. The flag was red through that stretch and blocked exactly those entries — average portfolio return across the seven bear years falls from 42.52% (unfiltered) to between 21.23% and 25.40% across the three filter arms.
Barely, for short swing trades: green and red trades land almost dead even in the swing-trading backtest (2.81% vs. 2.79% under Filter A), and under Filter C red trades actually outperform green ones on average. On the long-horizon contrast run, though, the filter separates outcomes clearly — most of all under Filter C (8.20% vs. 3.70%). Trend filters appear to bite on long holding periods, not short ones.
Filter A flips 34 times a year (45.7% of days green, averaging 6.8 days green and 8.0 days red in a row), Filter B flips 23 times a year (54.4% green), and the sluggish Filter C flips only 6.5 times a year at 77.2% green, with green streaks averaging about 59 trading days — close to three months.


