Low-Volatility Backtest: The Calmest Decile Does Not Beat the S&P 500 — But It Beats the Average Stock
The low-volatility anomaly is one of the best-known violations of efficient-market theory: calm stocks are not supposed to underperform risky ones in the long run — some studies find they even outperform — even though the standard capital asset pricing model says the opposite. We tested the claim across 181 monthly entry points from 2011 to 2026 in the US stock universe, using overlapping cohort portfolios, tiered trading costs and a purpose-built guard against price errors. The result splits in two, and both halves matter equally: against the S&P 500, the calmest decile loses, even on a risk-adjusted basis. Against the average of all stocks in the same universe, it wins clearly on a risk-adjusted basis — and the wildest decile turns out to be the real warning sign.
 Thomas Mücke
Founder & Publisher
Thomas Mücke
Founder & Publisher
The question: are investors actually paid for risk?
The standard capital asset pricing model (CAPM) offers a simple trade: more volatility, more expected return. The low-volatility anomaly is the best-known empirical violation of that rule — the repeatedly documented finding that calm stocks do not underperform, and in some samples even outperform, risky ones over the long run.
Four papers shaped the field. Haugen and Baker showed in 1991, in "The Efficient Market Inefficiency of Capitalization-Weighted Stock Portfolios," that a minimum-variance portfolio of large US stocks beat cap-weighted indices at equal or higher return and markedly lower volatility. Blitz and van Vliet delivered the most-cited global confirmation in 2007:
"The Volatility Effect: Lower Risk Without Lower Return"
Title of the study by David Blitz and Pim van Vliet, Journal of Portfolio Management, Vol. 34, No. 1 (Fall 2007). In the global large-cap universe from 1986 to 2006, the calmest decile achieved a Sharpe ratio of 0.72 against 0.40 for the overall market.
Baker, Bradley and Wurgler explained the anomaly in 2011 through benchmarking as a limit to arbitrage: one dollar "invested according to capitalization weights" in the calmest quintile of the CRSP universe from 1968 to 2008 grew to $59.55, against just $0.58 in the wildest. Frazzini and Pedersen built the tradable version on low beta rather than low volatility in 2014's "Betting Against Beta."
Two of these four papers are US-only, though (Haugen/Baker: the 1,000 largest US stocks; Baker/Bradley/Wurgler: the US-wide CRSP universe) — only Blitz/van Vliet, and Frazzini/Pedersen with a US core plus 19 further markets, are truly global. All four are long-horizon (roughly 18 to 86 years), and some — chiefly Frazzini/Pedersen with their genuine, self-financing short leg — additionally take a short position against risky stocks. Our question is narrower: does the same effect hold US-only, long-only, over a shorter, mostly friendly market window (2011–2026), under today's practical portfolio rules?
The result in four numbers
Are investors actually paid for risk — or does the calmest decile of stocks beat the market? We tested that in the US stock universe between 2011 and 2026. Four numbers carry the result:
- 8.60% a year is what the calmest decile of US stocks (D1) returned in the cohort portfolio, net of costs, across 181 monthly entry points from 2011 to 2026.
- 14.27% is what the S&P 500 including dividends returned over the same window — the index came out ahead, even on a risk-adjusted basis (Sharpe 1.01 against 0.75).
- 8.39% is what the equal-weighted average of every stock in the same universe returned — almost the same return as the calm decile, but at 18.74% instead of 12.05% volatility. Against that yardstick, calm won clearly (Sharpe 0.75 against 0.53).
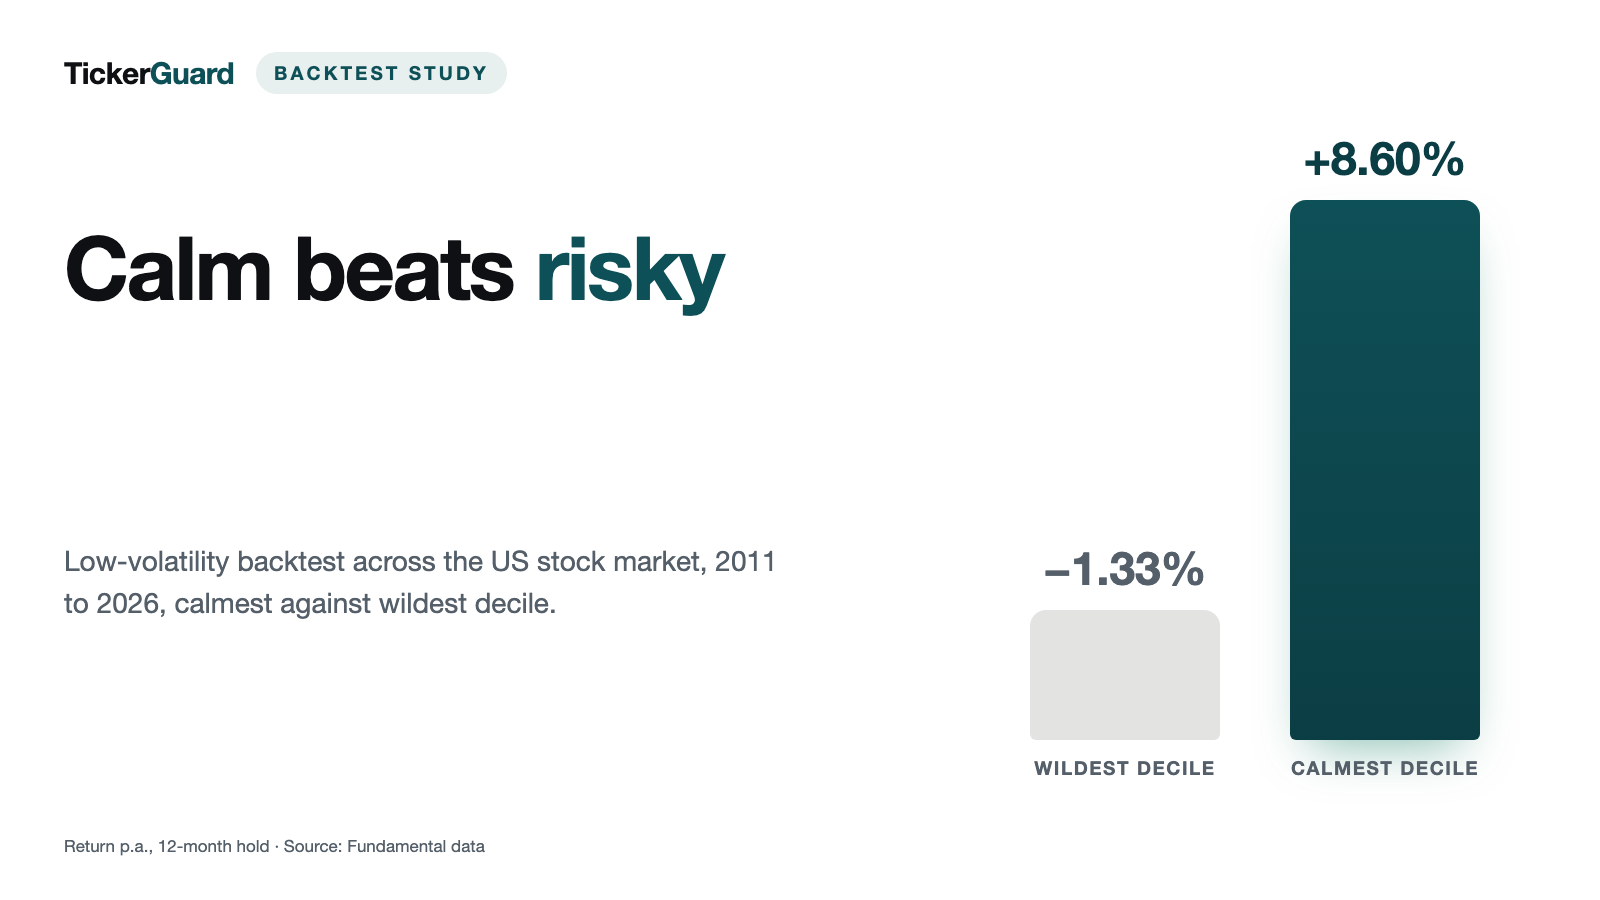
- −1.33% a year is what the wildest decile (D10) returned — median twelve-month return −15.05%, only a 40.4% hit rate. The warning came from the wild decile, not the calm one.
In the 2011–2026 test window, the calmest decile of US stocks beat neither the S&P 500 nor its risk-adjusted metric, but it did beat the equal-weighted average of every stock in the same universe — while the wildest decile mostly lost money over the same period.
The result: low-vol loses to the index, wins against the average
Every month from June 2011 to June 2026 (181 entry points), we ranked all US stocks by their trailing 252-trading-day volatility into deciles, held the calmest decile (D1) as a twelve-month cohort portfolio, and compared it against the S&P 500 Total Return and the equal-weighted average of every stock in the same universe. Costs are tiered by trading volume and already deducted.
| Portfolio | Return p.a. | Vol p.a. | Sharpe | Max drawdown | Worst 12 months |
|---|---|---|---|---|---|
| Calmest decile (D1) | 8.60% | 12.05% | 0.75 | −28.46% | −18.94% |
| Wildest decile (D10) | −1.33% | 32.18% | 0.12 | −70.56% | −60.40% |
| S&P 500 Total Return | 14.27% | 14.30% | 1.01 | −23.87% | −18.11% |
| Universe, equal-weighted | 8.39% | 18.74% | 0.53 | −32.65% | −27.79% |
The picture splits in two, and both halves matter equally. Against the S&P 500, the calm decile loses — at nearly the same volatility, it delivers 5.67 points a year less and a clearly lower Sharpe ratio. Anyone taking away from this study that calm stocks automatically beat the market is wrong.
Against the equal-weighted average of every stock in the same universe, though, it wins clearly on a risk-adjusted basis. The return is practically identical (8.60% against 8.39%), but volatility runs a third lower (12.05% against 18.74%) and the maximum drawdown is markedly shallower (−28.46% against −32.65%). The Sharpe ratio climbs from 0.53 to 0.75. That is the actual claim of the low-volatility literature: not "beats the market," but "offers a better risk-return trade than the average stock's own risk."
The warning side: the wild decile as a lottery ticket
The second half of the finding sits at the other end of the scale. Across all ten twelve-month deciles of the headline run, a clear pattern shows up:
| Decile | Positions | Mean | Trimmed | Median | Hit rate |
|---|---|---|---|---|---|
| D1 (calmest) | 53,558 | 9.03% | 8.79% | 8.31% | 68.6% |
| D2 | 53,513 | 10.32% | 9.74% | 9.12% | 65.8% |
| D3 | 53,497 | 10.82% | 9.83% | 8.75% | 63.8% |
| D4 | 53,479 | 11.22% | 9.91% | 8.39% | 62.2% |
| D5 | 53,457 | 11.75% | 9.95% | 8.18% | 60.7% |
| D6 | 53,401 | 11.45% | 9.03% | 6.56% | 58.3% |
| D7 | 53,303 | 11.34% | 8.05% | 4.67% | 55.5% |
| D8 | 53,119 | 11.16% | 6.39% | 2.02% | 52.5% |
| D9 | 52,637 | 12.04% | 4.36% | −1.21% | 48.8% |
| D10 (wildest) | 51,119 | 7.38% | −4.92% | −15.05% | 40.4% |
Spread D1 minus D10: mean +1.65 points, trimmed +13.71 points, median +23.36 points — positive means the calm decile came out ahead.
Two numbers stand out. First, the wild decile (D10) lost money on average across the cohort portfolios — a median twelve-month return of −15.05%, while the arithmetic mean still looks clearly positive (+7.38%) because of a handful of extreme winners. That gap between mean and median is exactly the signature of a lottery profile: many small losses, a few huge upside outliers that skew the average. Second, the hit rate falls at every single step from decile 1 to decile 10 — from 68.6% down to 40.4%, without a single exception. Buying into the wildest decile loses money in three out of five cases.
Beta is not the same thing as volatility
An obvious objection: isn't "calm" just another word for "low beta"? We reran the same test with two beta variants — a simple 252-day beta against the S&P 500, and a beta built to the Frazzini/Pedersen recipe (separate estimation of volatility and correlation, with shrinkage). The result is surprising:
| Sort metric | D1 | D10 |
|---|---|---|
| Volatility, 252 days (headline variant) | 8.60% | −1.33% |
| Beta, 252 days against S&P 500 | 3.48% | 9.47% |
| Beta, Frazzini/Pedersen-style | 8.06% | 9.09% |
The BAB arm (Frazzini/Pedersen recipe) needs a longer correlation history and therefore starts only in April 2013: 160 months instead of 181. It is directly comparable only to the S&P 500 in the same window (14.46%, instead of 14.27% in the 181-month window above) — not directly to the 181-month rows.
With the simple beta, the ranking flips entirely: the lowest-beta decile sits at just 3.48% a year, the highest at 9.47%. The more carefully estimated Frazzini/Pedersen-style beta sits closer to the volatility finding at 8.06%, but runs over a shorter, later window (from April 2013, 160 instead of 181 months) and stays clearly below its own window's S&P 500 (14.46%). "Calm" and "low beta" evidently do not measure the same thing: a raw beta signal is not a reliable stand-in for volatility in our window, and the choice of beta construction itself decides the direction of the finding.
Does the effect only carry in downturns?
The literature expects the advantage of calm stocks to show up mainly in bad market phases — as protection, not as a return engine. We split every entry month by how far the S&P 500 stood below its running high at that point:
| Regime | Entry months | D1 mean | D1 median | D10 mean | D10 median |
|---|---|---|---|---|---|
| Bull market (within 10% of high) | 160 | 9.32% | 8.75% | 7.23% | −15.08% |
| Moderate drawdown (10–20% below high) | 19 | 6.48% | 4.50% | 8.86% | −15.29% |
| Severe drawdown (20%+ below high) | 2 | 11.51% | 10.88% | 4.96% | −8.96% |
The picture is mixed and the sample sizes are small. In the 160 bull-market months — roughly 88% of the whole window — the calm decile led the wild one by about two points on average (2.09 points). In the 19 moderate-drawdown months, the mean spread flips, while the median for the calm decile stays clearly more positive (4.50% against −15.29%) — the same lottery effect distorting the mean here as with the wild decile overall. The two severe-drawdown months (at least 20% below the high) are simply too few to draw a measurement from. More important than any single number here is the limitation behind it: the 2008 financial crisis sits before this study's data starts — precisely the phase in which low-volatility strategies are said to show their biggest advantage is one this backtest does not see.
How robust is the finding?
Three counter-checks: does the result depend on the chosen stock universe, the volatility window, or the assumption about what happens to a delisted stock?
Universe. In both the unfiltered universe (U0, including micro-caps) and the main screen (U1, price at least $3 and average daily volume at least $2M), the trimmed and median spread between the calm and wild deciles stays clearly positive. Only with the additional market-cap screen (U2, at least $250M as well) does the plain mean flip negative — because a handful of multi-baggers in the wild decile dominate the average there (with roughly 42,000 positions in that decile, no single stock could do that), while the trimmed mean and median still favor low-vol. That is exactly Novy-Marx's critique of the anomaly's short side: part of the effect sits in barely tradable micro-caps.
Volatility window. A second, three-times-longer window (756 instead of 252 trading days — our analogue to Blitz/van Vliet's three-year weekly volatility) confirms the result almost unchanged: the trimmed spread comes in at 14.10 instead of 13.71 points, the median spread at 23.51 instead of 23.36. The finding does not hang on the arbitrary choice of 252 trading days.
Delisting assumption. Booking every premature series end as a total loss instead of a sale at the last known price makes the spread between the calm and wild deciles even wider (trimmed, from 13.71 to 18.93 points) — so the finding does not depend on a generous delisting assumption. On the simple beta arm, the reversal also survives this stricter assumption and becomes more pronounced (trimmed spread from −5.03 to −9.80 points).
| Counter-check | Mean | Trimmed | Median |
|---|---|---|---|
| U0 — unfiltered | +0.69 points | +23.37 points | +36.22 points |
| U1 — main screen | +1.65 points | +13.71 points | +23.36 points |
| U2 — additional market-cap screen | −4.85 points | +5.21 points | +14.92 points |
| 756-day volatility window | +1.44 points | +14.10 points | +23.51 points |
| Total loss instead of sale at last price (mean basis) | measured +1.65 points → conservative +4.22 points | — | |
What the break guard removed
US stock price series contain jumps that are not real price moves — usually reverse splits that never made it into the adjusted price. A purpose-built guard flags every monthly jump of at least a factor of ten without a documented split as the end of the series rather than as a return.
Between May 2010 and July 2026, the guard flagged 2,480 price jumps across 1,347 stocks. Of those, 324 are covered by a documented split and remain as a seam — the series continues, only no measurement crosses that point. Of the remaining 2,156 undocumented jumps, only the first counts per stock: 1,147 cases end a series outright. The other 1,009 already sit behind such a cutoff and no longer have any effect.
A price break is explicitly not a delisting: prices continue in the source afterward, so trading continued. The conservative track therefore books no −100% at that point, but a sale at the last credible price — a total loss would have replaced a data error with an invented bankruptcy, and because these breaks cluster in the wild decile, that alone would have swayed the finding.
What this study does not say
- Not a crisis test. The backtest starts in 2011 and does not include the 2008 financial crisis — the window is roughly 88% bull market, the least favorable environment for low-volatility strategies. A non-finding against the index in this window does not refute the original studies.
- Long-only. Much of the alpha in the original studies sits in the short leg against risky stocks, which is deliberately not modeled here. The wild decile stands as an observation, not a short position.
- Cohorts, not a standing portfolio. Monthly cohorts with a fixed twelve-month hold correspond to an overlapping-portfolio design, not the fully rebalanced standing portfolio of the original studies. The cumulative curves are therefore not directly comparable.
- Different volatility definitions. We use 252 (or 756) days of daily returns; the originals use 24 monthly returns (Haugen/Baker), three years of weekly returns (Blitz/van Vliet), or five years of monthly returns plus beta (Baker/Bradley/Wurgler). Number comparisons against the literature are directional, not point comparisons.
- US-only, essentially one market cycle. 181 monthly entry points are a fraction of the roughly 18 to 86 years covered by the original studies and span, at their core, only one business cycle.
- A series end counts as a delisting once it falls before the data cutoff; a mere ticker change for the same company is not distinguished from that — the conservative track therefore overstates failures rather than understating them.
- A backtest is not a forecast. This study is market research, not investment advice and not a buy recommendation.
How we calculated this
- Universe and period. US stocks, entry points from June 2011 to June 2026 (181 months), data cutoff July 2026. Main screen (U1): price at least $3, average daily volume at least $2M. Counter-checks with no screen at all (U0) and with an additional market-cap screen of at least $250M (U2).
- Ranking. Percentile-rank deciles per entry month, ranking measure (volatility or beta) and universe, ascending by metric — decile 1 carries the lowest values (calmest stocks or lowest beta), decile 10 the highest.
- Portfolio. Cohort portfolio, twelve-month hold, as many overlapping tranches as there are months in the window. Equal-weighted within each cohort first, then averaged across tranches. Costs tiered by the entry month's trading-volume tercile: 0.5 / 0.2 / 0.1 percent per side.
- Gaps and series ends. Missing monthly prices carry forward the last known price. If a series ends before the horizon and before the data cutoff, it is force-sold at the last price (conservative counter-check: −100%). If the twelve-month horizon extends past the data cutoff, the observation is dropped.
- Metrics. Sharpe ratio at a risk-free rate of zero (the US money-market rate ranged from zero to above five percent between 2011 and 2026 — any other choice would be an additional assumption, while zero treats every compared series the same). Trimmed mean: the most extreme 5 percent of values at each end excluded.
- Beta construction. Simple beta: 252 trading days against the S&P 500 price series. Frazzini/Pedersen-style arm: volatility over 252 days, correlation over a longer, overlapping window, with shrinkage — not a plain OLS beta.
What we did (not) build from this
This study deliberately produced no scanner. Unlike several of our other backtests, the split finding — loses to the index, wins risk-adjusted against the average, partly reverses under robustness checks — does not lend itself to a simple buy signal. For readers who want to use these metrics for their own position sizing, our organic hypergrowth backtest is documented with the same rigor, holding claims against cohort data the same way. An overview of all our backtests is available on the studies page.
A backtest is a finding, not a promise about the future.
Frequently Asked Questions
The observation that calm stocks do not underperform, and in some samples even outperform, risky stocks over the long run — even though the standard capital asset pricing model (CAPM) predicts higher risk should earn higher return. The foundational work is Haugen and Baker (1991) and Blitz and van Vliet (2007); Baker, Bradley and Wurgler (2011) explain the anomaly through benchmarking as a limit to arbitrage.
No, not in our backtest. The calmest decile of US stocks returned 8.60% a year at 12.05% volatility (Sharpe 0.75) between 2011 and 2026, against 14.27% at 14.30% volatility (Sharpe 1.01) for the S&P 500 including dividends. The index wins on both raw and risk-adjusted terms. That is an honest, not a flattering, finding.
Because the S&P 500 is not the right yardstick for the question low-vol actually answers. Against the equal-weighted average of every stock in the same universe — an investor buying broadly and unfiltered — the calm decile matches the return (8.60% against 8.39%) at a third less volatility and a clearly better Sharpe ratio (0.75 against 0.53). The anomaly shows up against average stock-level risk, not against the market index.
A warning, not an investment idea. The highest-volatility decile returned −1.33% a year in the portfolio test at 32.18% volatility, the median twelve-month return sat at −15.05% (the mean, by contrast, at +7.38% — that gap is the signature of a lottery profile), and only 40.4% of positions ended up in the green. The hit rate falls at every single step from decile 1 to decile 10 — from 68.6% down to 40.4%, without a single exception. That matches the "lottery" pattern in the research literature: many small losses, a few huge winners that distort the average.
No, and that is one of the most striking findings of this study. Sorting instead by a simple 252-day beta against the S&P 500 flips the picture: the lowest-beta decile returned just 3.48% a year, the highest 9.47%. Only a beta built to the Frazzini/Pedersen recipe (separate volatility and correlation estimation, with shrinkage) moves back toward the volatility finding at 8.06%. "Calm" and "low beta" evidently do not measure the same thing.
The picture is mixed and the sample sizes are small. In the 160 bull-market entry months (roughly 88% of the window) the calm decile led the wild one by 2.09 points on average. In the 19 moderate-drawdown months the average reversed to −2.38 points, even though the median return for the calm decile stayed clearly more positive (4.50% against −15.29%) — the same lottery effect distorting the average here as with the wild decile overall. The two severe-drawdown months are simply too few to measure.
Directionally, yes. Both the unfiltered universe (U0) and the main screen (U1) keep a clearly positive trimmed and median spread between the calm and wild deciles; only with an additional market-cap screen (U2, at least $250M) does the plain average flip, because a handful of multi-baggers in the wild decile dominate it there. A second, three-times-longer volatility window (756 instead of 252 trading days) confirms the result almost unchanged.
No. This study is pure market research with no live application. Unlike several of our other backtests, we deliberately did not turn this one into a scanner — the split finding (loses to the index, wins risk-adjusted against the average) does not lend itself to a simple buy signal.


