Debt Paydown Turnaround Backtest: It Is Not THAT Debt Falls That Matters — It Is HOW It Was Paid Down
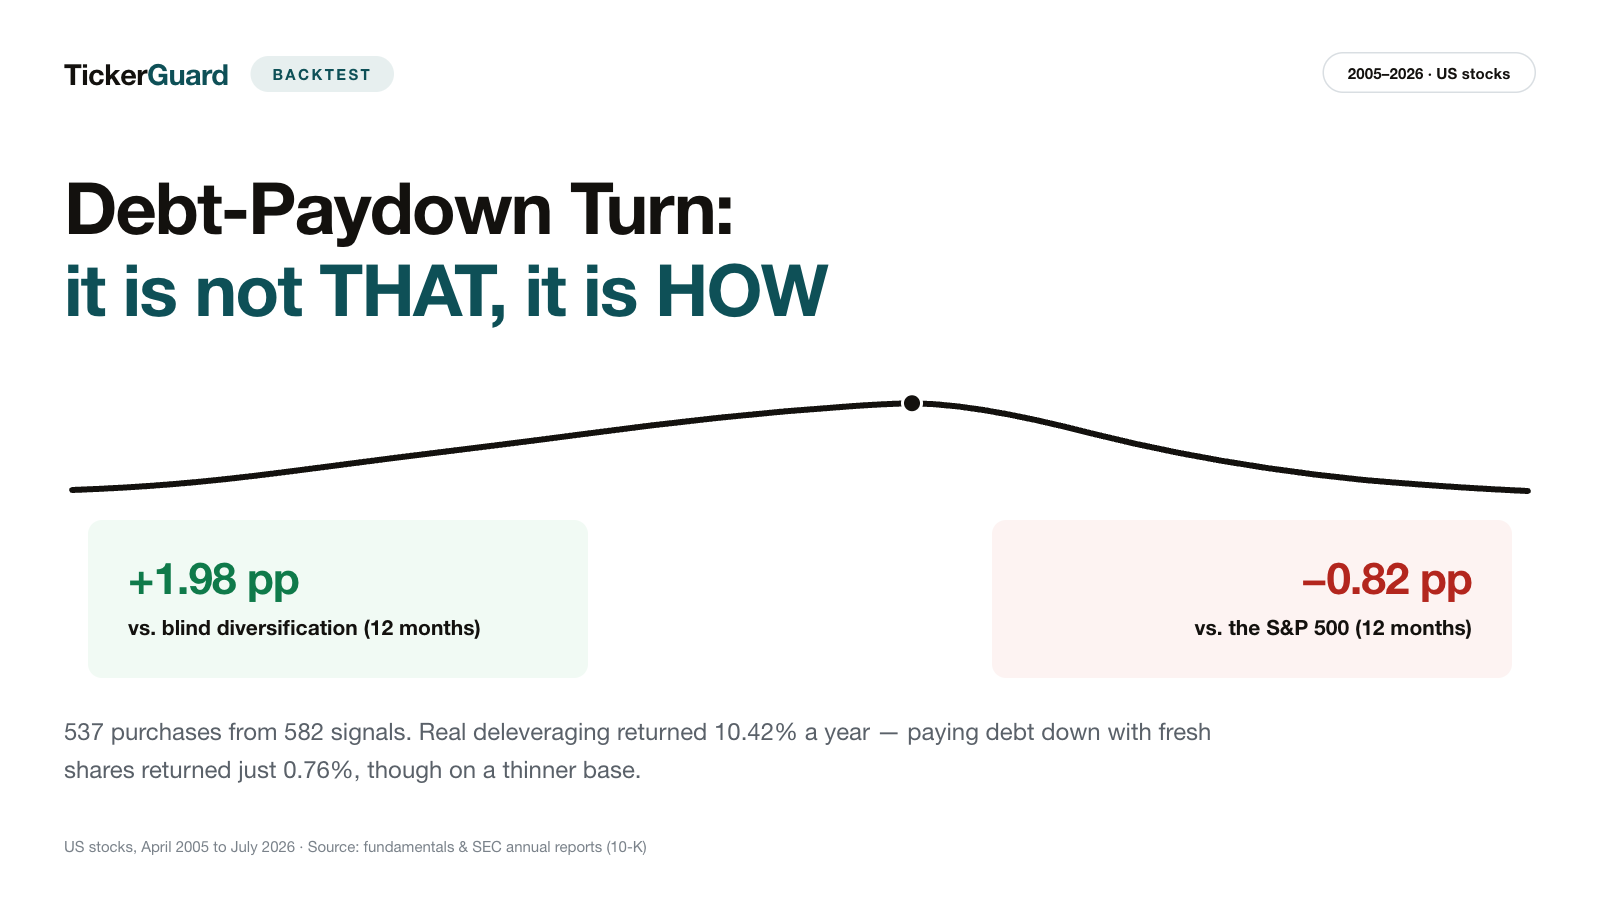
Companies that earned their debt mountain back down returned 10.42% a year. Companies that made the same debt mountain disappear by issuing fresh shares returned 0.76% — the same falling debt line, an entirely different outcome. We tested the rule "pile up debt for years, then pay it down for good" across 256 months and 582 signals, always buying after the annual report was actually filed. Against randomly spreading bets across the same pool of stocks the signal wins clearly; against the S&P 500 with dividends only with a signal exit. The 0.76% figure rests on a markedly thinner base than the main segment — there, what holds is the direction, not the level.
 Thomas Mücke
Founder & Publisher
Thomas Mücke
Founder & Publisher
The question: has the company really put its debt peak behind it?
"Debt paydown turnaround" here simply means a company that piled up a debt mountain for years and is finally paying it back down. A company whose debt has grown for years is rightly seen as riskier: higher interest cost, less room to manoeuvre, greater bankruptcy risk at the next setback. The interesting question is not whether high debt hurts — it is whether the moment debt first starts falling again is a reliable buy signal. Our thesis: a company whose net debt rose for at least three years running and then falls sustainably — at least two years running, at least ten percent cumulatively — has likely put its debt peak behind it. Falling interest cost and falling bankruptcy risk should then show up in a better stock return.
We tested that thesis for you on US stocks across 256 months, from April 2005 to July 2026. The result is neither a clean yes nor a clean no: the signal clearly beats randomly spreading bets across the same pool of stocks — but beats the S&P 500 only if you hold until the next relapse, not on a fixed holding period. And the single most important finding is not about the size of the return at all, but about a different question entirely: it is not that debt falls that matters, it is how it was paid down.
The result in four numbers
Does it pay to buy a company whose net debt, after years of rising, starts falling sustainably? We tested that on US stocks from April 2005 to July 2026. Four numbers carry the result:
- 10.42% per year is what the main segment "genuine deleveraging" returned on a twelve-month hold — companies whose net debt rose for at least three years running and then fell for at least two years running, cutting at least ten percent cumulatively, without new shares and without shrinking.
- 0.76% per year is what the same falling debt line returned when it was paid down with freshly issued shares ("diluted deleveraging") — the core finding: it is not that debt falls that matters, it is how. The figure rests on a markedly thinner base (7 against 26 positions held at once, median); what holds is the direction, not the level.
- 11.24% is what the S&P 500 with dividends returned over the same window — on a fixed holding period the signal trailed narrowly, only a signal exit (12.20%) got ahead of it.
- 8.44% is what the equal-weighted universe returned over the same window — against randomly spreading bets across the same pool of stocks, the signal won clearly.
In the tested window, April 2005 through July 2026, it was not the falling debt level that separated winners from losers, but how it was paid down.
How we measured it: the rule and the buy date
The starting point is net debt — short- and long-term financial debt minus cash — per company and fiscal year, built from the annual reports we evaluated. A signal fires once two conditions are met in sequence:
- The rise. Net debt climbs for at least three years running and reaches an economically meaningful size at its peak: more than 1x operating earnings before depreciation, or more than 20 percent of total assets. It must also be greater than zero at the peak — a company holding more cash than debt has no debt mountain to climb down from.
- The turn. Net debt then falls for at least two years running, cutting at least ten percent cumulatively from the peak.
The buy date is the crux: purchases happen not on the balance-sheet date of the second paydown year, but on the first month-end after that year's annual report was actually filed. A backtest that buys on the reporting date itself assumes knowledge an investor could not yet have had — the figures are typically filed weeks or months later. Financial-sector companies are excluded entirely, because debt is part of the business model there, not a warning sign.
Not every company that cuts debt does it the same way. We therefore separate segments that are never mixed: the main segment "genuine deleveraging" (share count and total assets stay within bounds), "diluted deleveraging" (share count grows by more than ten percent during the paydown window — debt was partly retired with fresh shares rather than earned down), and the "shrinking cure" (total assets shrink by more than 20 percent in the same window, so the company cut or sold its way smaller). Anything that meets both at once gets its own row.
Of 163,456 company-years reviewed, 90,466 (55.3%) remained usable after excluding financials, incomplete data and implausible balance-sheet values, across 7,929 of 13,675 tickers. Every signal in this study comes from that set.
The core result: clearly ahead of random, past the index only with the right exit
Of 582 signals in the main segment, 537 were actually bought; the remaining 45 fell out because the stock was blocked over questionable price data (24 cases) or had no price in the entry month (21 cases). The portfolio math is a signal-return construction: every buyable case is taken, every open position enters each month's average equal-weighted, at 0.1 percent cost on the buy and on the sale. The comparison series "Universe" is built exactly the same way — only that makes the two figures comparable.
| Holding period | Positions (median) | Largest drawdown | Share of closed positions in profit | Return p.a. | S&P 500 TR p.a. | Universe p.a. |
|---|---|---|---|---|---|---|
| 12 months | 26 | −43.88% | 59.32% | 10.42% | 11.24% | 8.44% |
| 24 months | 47.5 | −52.80% | 61.29% | 10.58% | 11.24% | 8.44% |
| 36 months | 79 | −57.42% | 65.23% | 10.88% | 11.24% | 8.44% |
| as long as the signal holds | 47.5 | −55.46% | 58.92% | 12.20% | 11.24% | 8.44% |
The ranking is unambiguous: at every holding period tested, the signal beats the equal-weighted universe — the average of every non-financial stock in the same dataset — by 1.98 to 3.76 points. Against the S&P 500 with dividends, the picture flips: on a fixed 12-, 24- or 36-month hold, the signal trails the index by 0.36 to 0.82 points. Only holding not for a fixed period but until net debt rises again in a later annual report gets ahead of the index — 12.20% against 11.24%, an edge of 0.96 points.
That is the honest headline of this study: the debt paydown turnaround is a reliable signal against randomly spreading bets across the same pool of stocks. Against a plain index fund, it only pays off if you follow the signal on the way out too — not if you sell after a fixed calendar period.
And even that edge should be read as small: 0.96 points across 256 months, on a median of 47.5 stocks held at once, is not a robust margin. A portfolio of that width swings by a multiple of it in a single month, so the gap to the index sits inside the range chance alone can produce. The gap to blind diversification, at up to 3.76 points, is by far the more robust of the two claims — and it is also the one that matters for a selection rule.
A word on the position counts standing next to every return in the table: they belong there. A monthly average across a single position is that one stock's return, not a statement about a strategy. The main run holds a median of 26 to 79 stocks at once — enough not to be measuring individual companies, but few enough that one outlier can noticeably move the monthly average.
The strongest single finding: not that, but how
Falling net debt can tell very different stories. Either the company earns its way there — more cash flow, fewer new loans. Or it issues fresh shares and uses the proceeds to retire old debt: net debt falls, but every existing shareholder ends up owning a smaller slice of a company that has not actually grown. Or it sells off divisions and shrinks its way to health. Split apart, these paths are rewarded very differently:
| Segment | Period | Signals | Purchases | p.a. (12 months) | p.a. (24 months) | p.a. (36 months) | p.a. (signal exit) | Positions (median, 12 months) | Positions (median, signal exit) | Largest drawdown (12 months) |
|---|---|---|---|---|---|---|---|---|---|---|
| Main segment: genuine deleveraging | 2005-04 to 2026-07 | 582 | 537 | 10.42% | 10.58% | 10.88% | 12.20% | 26 | 47.5 | −43.88% |
| Diluted deleveraging (share count above +10%) | 2005-07 to 2026-07 | 248 | 181 | 0.76% | 4.61% | 3.97% | 8.31% | 7 | 16 | −71.05% |
| Shrinking cure (total assets below −20%) | 2006-09 to 2026-07 | 123 | 101 | 5.01% | 15.64% | 18.65% | 19.09% | 4 | 13 | −91.45% |
| Diluted AND shrinking | 2005-05 to 2026-07 | 68 | 50 | −9.60% | −3.84% | 3.62% | 4.26% | 1 | 4 | −97.41% |
The gap is stark. The main segment with genuine deleveraging returns 10.42% per year; companies that instead deleveraged with new shares managed just 0.76% — barely more than a near-zero yield. Add a shrinking balance sheet on top, and the sign flips entirely: minus 9.60% per year.
Before reading that gap, the caveat we imposed on ourselves further up belongs in front of it. Both comparison segments are more thinly populated than the main one: a median of 7 stocks held at once for diluted deleveraging, and 1 where it coincides with a shrinking balance sheet, against 26 in the main segment. By the same rule we applied to the main run's position counts, the direction carries here, not the level. On top of that, the segments begin in different months, so each row of the table carries its own period. What remains is unambiguous all the same: the gap between genuine and diluted deleveraging holds at all four holding periods — 10.42% against 0.76% at twelve months, 10.58% against 4.61% at 24, 10.88% against 3.97% at 36, and 12.20% against 8.31% on a signal exit. We did not compute sensitivity checks per segment; the sensitivities in the next chapters apply to the main segment.
That last figure deserves the same restraint we applied to the position counts above. It rests on 50 purchases and a median of a single position held at once — and a monthly average across one position is that one stock's return, not a statement about a strategy. What holds here is the direction, not the level. To illustrate that one series: over its period — May 2005 to July 2026, 255 months — a $100,000 stake would have been worth roughly $11,700. This segment expressly does not measure a portfolio outcome; we report it because leaving it out would have suppressed the uncomfortable half of the finding.
The market, in other words, draws a line between a company that earns its way out of debt and one that dilutes existing shareholders to make the debt line go down. A backtest that only looked at the falling debt line would have missed this distinction entirely — which is exactly why separating the segments is not a footnote to this study, it is its most important result. In order of magnitude, that gap is more pronounced than any timing effect we measured.
The pure shrinking cure is the interesting special case — and a warning against hasty conclusions. At twelve months it sits at 5.01%, below the main segment; at the long holding periods it sits well above it — 15.64% at 24 months, 18.65% at 36 and 19.09% on a signal exit, the highest figure of any reported segment in each case. Shrinking your way back to health evidently takes time. But it rests on just 101 purchases, holds a median of 13 positions on a signal exit and 4 on a twelve-month hold — and shows a 91.45% drawdown at twelve months. That is too thin and too volatile to build a rule on; we report the number but base no recommendation on it. The same applies to the residual "unclassified" group, where the share count could not be established: it contains 3 signals and carries no conclusion.
Early or late entry: the price of waiting
How robust is the rule against its own definition? We turned the dials one at a time: the number of required up-years, the number of required paydown years before the buy, and the size of the required paydown.
| Variant | Period | Signals | Purchases | p.a. (12 months) | p.a. (24 months) | S&P 500 TR p.a. (same period) | Universe p.a. (same period) |
|---|---|---|---|---|---|---|---|
| 2 up-years, 2 paydown years (early entry) | 2004-04 to 2026-07 | 1,266 | 1,167 | 11.21% | 13.27% | 11.02% | 8.41% |
| 3 up-years, 2 paydown years (main recipe) | 2005-04 to 2026-07 | 582 | 537 | 10.42% | 10.58% | 11.24% | 8.44% |
| 4 up-years, 2 paydown years (late entry) | 2007-02 to 2026-07 | 287 | 265 | 3.31% | 6.28% | 11.04% | 7.07% |
| 3 up-years, 1 paydown year | 2004-06 to 2026-07 | 1,087 | 965 | 7.89% | 8.82% | 10.94% | 8.33% |
| 3 up-years, 3 paydown years (late entry) | 2007-02 to 2026-07 | 224 | 210 | 3.43% | 10.33% | 11.04% | 7.07% |
| Cumulative paydown of only 5% | 2005-04 to 2026-07 | 662 | 613 | 11.05% | 11.17% | 11.24% | 8.44% |
| Cumulative paydown of 20% | 2005-04 to 2026-07 | 409 | 378 | 10.93% | 10.23% | 11.24% | 8.44% |
Lowering the bar to two up-years instead of three buys earlier into the paydown cycle — and is rewarded for it: 11.21% at twelve months and 13.27% at 24 months, on a broad base of 1,167 purchases out of 1,266 signals. It is the only one of the seven variants that beats its own period-matched index comparison: over its period from April 2004, the S&P 500 with dividends returned 11.02%, against the variant's 11.21% (twelve months) and 13.27% (24 months). All twelve other variant-and-holding-period combinations trail their respective index — which is why the comparison columns stand beside them in the table.
Waiting instead — whether for a fourth up-year before the signal or a third paydown year before the buy — gives back almost the entire return: 3.31% and 3.43% per year respectively. The reason is intuitive: by the time a turn is confirmed three or four times over, the market has already priced in the recovery. Waiting for extra confirmation does not buy safety, it buys in too late.
One caution on the base of the late variants: they rest on 265 and 210 purchases and only begin in February 2007, almost two years after the other series. Their gap to the main recipe is wide enough that the shorter series alone can hardly explain it — but as point estimates the two figures are less robust than the main recipe's.
How much paydown to require, by contrast, barely matters: five percent cumulative paydown (11.05% per year) and twenty percent (10.93%) both sit close to the main recipe's ten percent (10.42%). The threshold for the size of the paydown is uncritical — the number of years is not.
What happened to the stocks that vanished
A backtest that simply drops stocks once they vanish from the price database overstates its own result systematically — the losses disappear along with the ticker. Our calculation sells every vanished position at its last traded price, and thereby assumes the investor received that money. Whether that holds depends on why the stock vanished. We therefore researched every such case in the main recipe and the main segment individually — not a sample, but a full census of exactly that cut: 43 cases. For the other recipe variants the rate is only an indication.
| Classification | Cases | Share of economically meaningful cases |
|---|---|---|
| Takeover, merger or going private | 30 | 96.77% |
| Bankruptcy | 1 | 3.23% |
| Purely technical (renaming, ticker change, share classes) | 12 | — |
| Remained unclear | 0 | — |
Of the 31 economically meaningful cases — technical events like renamings or ticker changes are counted separately, because the underlying company simply kept operating — 30 were acquired and only one went bankrupt (LL Flooring). That is a 96.77% takeover rate against 3.23% bankruptcy. The likely reading: companies that successfully cut their debt mostly disappear from the exchange because other companies find them attractive again — not because they fail.
For a takeover at a premium the last traded price is a realistic assumption; for a bankruptcy it is likely too generous. Treating every delisting as a total loss instead, as a conservative floor, drops the return to 8.38% on a twelve-month hold and to 9.81% on a signal exit. That is a lower bound, not a second, equally weighted answer — given the researched takeover rate, the truth sits much closer to the headline calculation.
One error runs the other way, and we name it because it understates our result: one of the stocks acquired for cash shows an 85% loss in our calculation. The cause is special distributions paid out to shareholders ahead of the takeover, which the adjusted price series does not add back. Wherever a company deleverages through special distributions, this backtest measures the outcome too low. The direction of that error is known; its size is not.
Sensitivities: what moves the result — and what does not
Four further checks show how stable the result is against edge conditions:
| Calculation | Signals | Purchases (12 months) | p.a. (12 months) | p.a. (24 months) | p.a. (36 months) | p.a. (signal exit) | S&P 500 TR p.a. (same period) | Universe p.a. (same period) |
|---|---|---|---|---|---|---|---|---|
| Headline calculation | 582 | 537 | 10.42% | 10.58% | 10.88% | 12.20% | 11.24% | 8.44% |
| Excluding Covid entries 2020–2022 | 463 | 427 | 12.99% | 9.84% | 10.26% | 13.65% | 11.24% | 8.44% |
| Excluding real-estate stocks | 542 | 500 | 11.77% | 11.04% | 11.20% | 12.58% | 11.24% | 8.44% |
| Every delisting as a total loss (floor) | 582 | 537 | 8.38% | 8.52% | 8.82% | 9.81% | 11.24% | 8.44% |
| Portfolio with finite cash (sensitivity only) | 582 | 290 (signal exit: 366) | 6.48% | 10.89% | 8.29% | 7.60% | 11.24% | 8.44% |
The Covid check cuts both ways, which is why we show it across all four holding periods. Without entries from 2020 to 2022, the twelve-month return rises from 10.42% to 12.99% and the signal exit from 12.20% to 13.65% — at twelve months that clears the index for the first time. On the long fixed holds the calculation flips: 24 months fall from 10.58% to 9.84%, and 36 months from 10.88% to 10.26%. Both therefore stay behind the index even without the Covid years. The pandemic depressed the short holding periods and propped up the long ones; there is no uniform picture. What is stable is the exclusion of real-estate stocks, where debt sits close to the business model itself: 11.77% at twelve months and 12.58% on a signal exit.
The cash-constrained mode deserves its own explanation, because at first glance it looks disappointing: just 6.48% on a twelve-month hold. That is not a weaker signal, though — it is a different question. There we simulate a portfolio with a finite starting stake, fully invested, without monthly rebalancing. If a signal falls in a month with no free cash, it simply does not get bought — of 582 signals, only 290 were bought at all on a twelve-month hold, and 366 on a signal exit. That figure measures which signals got lucky with cash allocation, not what the rule is worth. It is explicitly a sensitivity check, not this study's result; the signal-return figures above remain the benchmark.
Honest limits of this calculation
A backtest is only as good as its fine print. This one has several, and we list them in full:
- Static industry classification. We exclude financial companies based on today's sector label and apply it backward across all years. A company that ran a different business in the past may be wrongly included or excluded as a result.
- Estimated filing dates. For 35.6% of the annual reports evaluated since 2000, the actual filing date is unverified and estimated as balance-sheet date plus 90 days. Where a company actually filed earlier, the backtest buys too late; where it filed later, too early.
- Annual reports only. Quarterly figures and rolling twelve-month values are not part of this analysis. A turn therefore becomes visible only at the next annual report at the earliest — in practice it would often have been visible sooner.
- Narrow portfolios. The median number of positions held at once is 26 on a twelve-month hold, 47.5 at 24 months and on a signal exit, and 79 at 36 months. That is enough not to be measuring individual companies, but few enough that a handful of strong or weak stocks can noticeably move the monthly average.
- No calculation across price gaps. A position only contributes a monthly return if it traded in the previous month and in the current one. Pushing a multi-month return into a monthly average would be a silent error; the same rule applies to the comparison series.
- The cash-constrained portfolio is not a second answer. As described above, it mostly measures cash-allocation luck and is therefore run only as a sensitivity check.
- No taxes, no trading spreads. Only 0.1 percent cost per side is modelled, nothing else. A real portfolio also pays tax on realised gains and, for smaller stocks, a spread between bid and ask. Both reduce the result.
- The best variant is an in-sample variant. We ran seven recipe variants on the same data — two, three and four up-years; one, two and three paydown years; five, ten and twenty percent of paydown. That one of them comes out best is exactly what you would expect across that many runs, even if there were no effect at all. The early variant's 11.21% and 13.27% are therefore not numbers to project forward; what holds is the direction (early beats late), which points the same way across every variant, not the level of the winning cell.
- A backtest is not a forecast. This study is market research, not investment advice, and not a buy recommendation for any individual stock.
Conclusion
The debt paydown turnaround is not a miracle signal, but it is not a failure either. Buying a company whose net debt, after years of rising, starts falling sustainably beats randomly spreading bets across the same pool of stocks clearly, across 256 months and 537 purchases, at every holding period tested. Against the S&P 500, less of that edge survives than the headline number suggests: only following the signal on the way out, rather than selling after a fixed period, gets ahead of the index — and even then only by 0.96 points.
The most important finding of this study is not about how long to hold, but about what to buy in the first place. A falling debt line by itself says little. Only looking at how the paydown happened — earned or diluted — separates a 10.42% return from one near zero, measured on a markedly thinner segment. And entering early, rather than waiting for extra confirmation, keeps most of that return.
For how other balance-sheet signals fared in hindsight, read our accruals study, which asks the same question about the quality of reported earnings; an overview of every rule we have back-tested is in our studies.
Frequently Asked Questions
A two-step buy rule. First, a company's net debt must have risen for at least three years running and reached an economically meaningful size at its peak — more than 1x operating earnings before depreciation, or more than 20 percent of total assets. Then it must have fallen for at least two years running, cutting at least ten percent cumulatively from the peak. Purchases are equal-weighted, at 0.1 percent cost per side, on the first month-end AFTER the filing date of the second paydown year's annual report — never on the balance-sheet date itself. Positions are held for 12, 24 or 36 months, or until net debt rises again in a later annual report.
Only partly, and that is the most honest answer this study can give. Against randomly spreading bets across the same pool of stocks, the signal wins clearly: 10.42% against 8.44% per year on a twelve-month hold. Against the S&P 500 with dividends (11.24%), it trails on fixed holding periods — by 0.82 points at twelve months and 0.36 points at 36 months. Only holding until the next debt relapse gets ahead of the index, at 12.20%, and even then only by 0.96 points.
Because it is not enough for debt to fall — what matters is how it was paid off. Companies that deleveraged by issuing fresh shares returned just 0.76% per year on a twelve-month hold (181 purchases from 248 signals); add a shrinking balance sheet on top and purchases lost 9.60% a year (50 purchases from 68 signals). The main segment, which excludes both, returned 10.42%. Both comparison segments are more thinly populated than the main segment, though — a median of 7 and 1 positions held at once against 26. Net debt falls in all three cases — but the existing shareholder ends up owning a smaller slice of a company that has not grown.
Because the signal loses its power the longer you wait for confirmation. Requiring only two up-years instead of three, 1,167 purchases out of 1,266 signals returned 11.21% (12 months) and 13.27% (24 months) — at once the broadest and the best variant in the backtest. Waiting instead for a fourth up-year or a third paydown year before buying drops the return to 3.31% and 3.43% respectively; by then most of the price reaction has already happened. Two cautions on the base, though: both late variants rest on just 265 and 210 purchases and only start in February 2007 — and the early variant was selected on the same data as the other six. At twelve months it sits only about 0.2 points above its own period-matched index (11.21% against 11.02%) — the edge all but disappears once you compare like periods.
They are force-sold at their last traded price. We researched every such case in the main recipe and the main segment individually — 43 of them: 30 were acquired, 1 went bankrupt (LL Flooring), 12 were purely technical (renaming, ticker change, share classes), and 0 remained unclear. Of the 31 economically meaningful cases, that is 96.77% takeover against 3.23% bankruptcy — companies that successfully cut their debt mostly disappear because they get bought, not because they fail. Treating every delisting as a total loss instead, as a floor, drops the return to 8.38% (12 months) and 9.81% (signal exit); that is a lower bound, not a second result.
Because it answers a different question. In that mode we simulate a portfolio with a finite starting stake, fully invested, without monthly rebalancing. If a signal falls in a month with no free cash, it simply does not get bought: of 582 signals, only 290 were bought at all on a twelve-month hold — fewer than half. Such a figure measures which signals got lucky with cash allocation, not what the buy rule is worth. The headline result is therefore the signal return: every buyable signal is taken, and every open position enters each month equal-weighted. Only then is the series built line for line the same way as the comparison series "Universe" — and only then do the two figures compare like with like.
For 35.6% of the annual reports evaluated, the actual filing date is unverified and estimated as balance-sheet date plus 90 days; industry classification is static, applying today's sector label backward across all years; the calculation runs only on annual reports, so a reversal becomes visible late; and the median number of positions held at once is only 26 to 79, so individual stocks can noticeably move the monthly average. Taxes and trading spreads are not modelled anywhere.


